How to Plot Single 3D Point on Top of plot_surface in Python Matplotlib
Plot Single 3D Point on Top of plot_surface in Python Matplotlib is a powerful technique for visualizing data in three-dimensional space. This article will provide a detailed exploration of how to effectively plot a single 3D point on top of a surface plot using Matplotlib, one of the most popular data visualization libraries in Python. We’ll cover various aspects of this technique, including the basics of 3D plotting, creating surface plots, adding individual points, and customizing the appearance of your plots.
Understanding 3D Plotting in Matplotlib
Before we dive into plotting a single 3D point on top of a plot_surface, it’s essential to understand the fundamentals of 3D plotting in Matplotlib. Matplotlib provides a powerful set of tools for creating three-dimensional visualizations, allowing you to represent data in a more complex and informative way.
To create a 3D plot in Matplotlib, you’ll need to use the mpl_toolkits.mplot3d module. This module extends Matplotlib’s functionality to support 3D plotting. Here’s a simple example to get started:
import matplotlib.pyplot as plt
from mpl_toolkits.mplot3d import Axes3D
import numpy as np

fig = plt.figure()
ax = fig.add_subplot(111, projection='3d')

x = np.linspace(-5, 5, 100)
y = np.linspace(-5, 5, 100)
X, Y = np.meshgrid(x, y)
Z = np.sin(np.sqrt(X**2 + Y**2))

ax.plot_surface(X, Y, Z)
ax.set_xlabel('X-axis')
ax.set_ylabel('Y-axis')
ax.set_zlabel('Z-axis')
ax.set_title('3D Surface Plot - how2matplotlib.com')

plt.show()
Output:
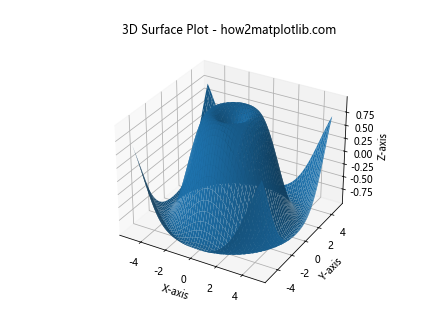
In this example, we create a 3D surface plot of the function z = sin(sqrt(x^2 + y^2)). The plot_surface function is used to create the surface plot, and we set labels for each axis to improve readability.
Creating a Surface Plot with plot_surface
Now that we have a basic understanding of 3D plotting in Matplotlib, let’s focus on creating a surface plot using the plot_surface function. This function is particularly useful for visualizing three-dimensional data as a continuous surface.
Here’s an example of how to create a more complex surface plot:
import matplotlib.pyplot as plt
from mpl_toolkits.mplot3d import Axes3D
import numpy as np

fig = plt.figure(figsize=(10, 8))
ax = fig.add_subplot(111, projection='3d')

x = np.linspace(-5, 5, 100)
y = np.linspace(-5, 5, 100)
X, Y = np.meshgrid(x, y)
Z = np.sin(np.sqrt(X**2 + Y**2)) * np.cos(0.5 * X)

surf = ax.plot_surface(X, Y, Z, cmap='viridis')
ax.set_xlabel('X-axis')
ax.set_ylabel('Y-axis')
ax.set_zlabel('Z-axis')
ax.set_title('Complex Surface Plot - how2matplotlib.com')

fig.colorbar(surf, shrink=0.5, aspect=5)

plt.show()
Output:
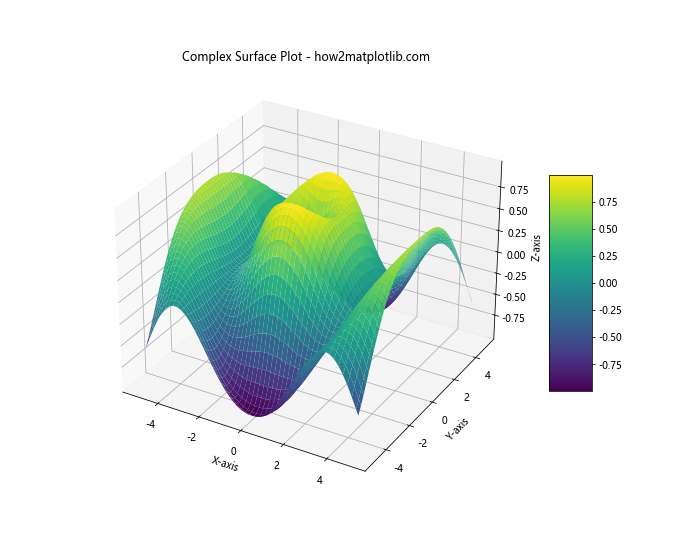
In this example, we create a more complex surface using the function z = sin(sqrt(x^2 + y^2)) * cos(0.5x). We also add a color map to the surface plot and include a color bar to show the range of values.
Adding a Single 3D Point to the Plot
Now that we have our surface plot, let’s address the main topic: plotting a single 3D point on top of the plot_surface. To do this, we’ll use the scatter function, which allows us to plot individual points in 3D space.
Here’s an example of how to add a single point to our surface plot:
import matplotlib.pyplot as plt
from mpl_toolkits.mplot3d import Axes3D
import numpy as np

fig = plt.figure(figsize=(10, 8))
ax = fig.add_subplot(111, projection='3d')

x = np.linspace(-5, 5, 100)
y = np.linspace(-5, 5, 100)
X, Y = np.meshgrid(x, y)
Z = np.sin(np.sqrt(X**2 + Y**2))

surf = ax.plot_surface(X, Y, Z, cmap='viridis', alpha=0.8)

# Plot single 3D point
point_x, point_y = 2, 2
point_z = np.sin(np.sqrt(point_x**2 + point_y**2))
ax.scatter(point_x, point_y, point_z, color='red', s=100, label='Single Point')

ax.set_xlabel('X-axis')
ax.set_ylabel('Y-axis')
ax.set_zlabel('Z-axis')
ax.set_title('Surface Plot with Single 3D Point - how2matplotlib.com')
ax.legend()

plt.show()
Output:
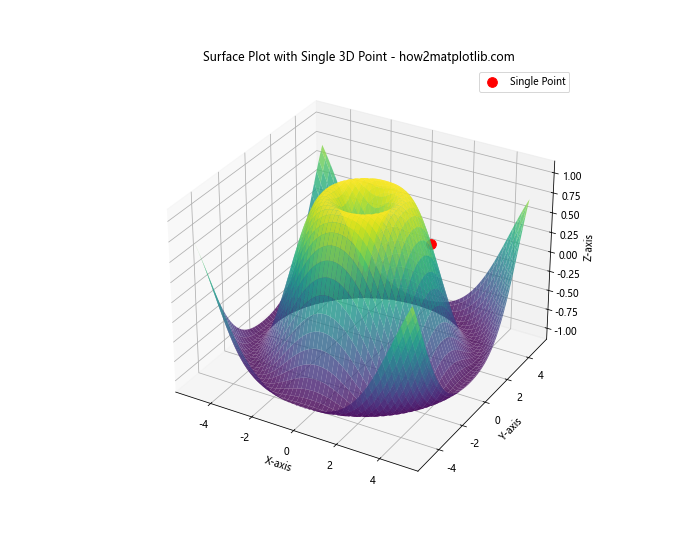
In this example, we first create the surface plot as before. Then, we use the scatter function to add a single point at (2, 2, z), where z is calculated using the same function as the surface. We set the color of the point to red and increase its size for visibility.
Customizing the Appearance of the Plot
To make your plot more informative and visually appealing, you can customize various aspects of its appearance. Let’s explore some ways to enhance our plot:
import matplotlib.pyplot as plt
from mpl_toolkits.mplot3d import Axes3D
import numpy as np

fig = plt.figure(figsize=(12, 9))
ax = fig.add_subplot(111, projection='3d')

x = np.linspace(-5, 5, 100)
y = np.linspace(-5, 5, 100)
X, Y = np.meshgrid(x, y)
Z = np.sin(np.sqrt(X**2 + Y**2))

surf = ax.plot_surface(X, Y, Z, cmap='coolwarm', alpha=0.7, linewidth=0, antialiased=False)

# Plot single 3D point
point_x, point_y = 2, 2
point_z = np.sin(np.sqrt(point_x**2 + point_y**2))
ax.scatter(point_x, point_y, point_z, color='green', s=150, edgecolor='black', linewidth=2, label='Single Point')

ax.set_xlabel('X-axis', fontsize=12, fontweight='bold')
ax.set_ylabel('Y-axis', fontsize=12, fontweight='bold')
ax.set_zlabel('Z-axis', fontsize=12, fontweight='bold')
ax.set_title('Customized Surface Plot with Single 3D Point - how2matplotlib.com', fontsize=14, fontweight='bold')

ax.view_init(elev=20, azim=45)
ax.grid(True)
ax.legend(fontsize=10)

fig.colorbar(surf, shrink=0.5, aspect=5, label='Z values')

plt.show()
Output:
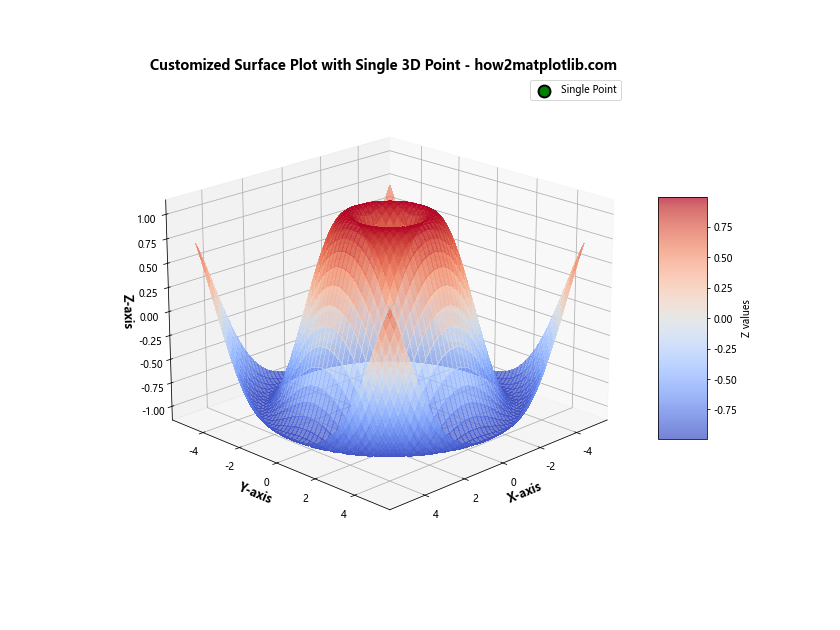
In this example, we’ve made several customizations:
- Changed the color map to ‘coolwarm’
- Adjusted the transparency of the surface plot
- Customized the appearance of the single point
- Modified the font size and weight of labels and title
- Changed the viewing angle of the plot
- Added a grid
- Customized the legend and color bar
These customizations help to create a more professional and informative visualization.
Plotting Multiple 3D Points on the Surface
While our focus is on plotting a single 3D point, it’s worth exploring how to plot multiple points on the surface. This can be useful for comparing different data points or highlighting specific areas of interest on the surface.
Here’s an example of how to plot multiple 3D points on the surface:
import matplotlib.pyplot as plt
from mpl_toolkits.mplot3d import Axes3D
import numpy as np

fig = plt.figure(figsize=(12, 9))
ax = fig.add_subplot(111, projection='3d')

x = np.linspace(-5, 5, 100)
y = np.linspace(-5, 5, 100)
X, Y = np.meshgrid(x, y)
Z = np.sin(np.sqrt(X**2 + Y**2))

surf = ax.plot_surface(X, Y, Z, cmap='viridis', alpha=0.8)

# Plot multiple 3D points
points = [(-3, -3), (-1, 2), (2, -2), (3, 3)]
colors = ['red', 'green', 'blue', 'yellow']

for (px, py), color in zip(points, colors):
    pz = np.sin(np.sqrt(px**2 + py**2))
    ax.scatter(px, py, pz, color=color, s=100, label=f'Point ({px}, {py})')

ax.set_xlabel('X-axis')
ax.set_ylabel('Y-axis')
ax.set_zlabel('Z-axis')
ax.set_title('Surface Plot with Multiple 3D Points - how2matplotlib.com')
ax.legend()

plt.show()
Output:
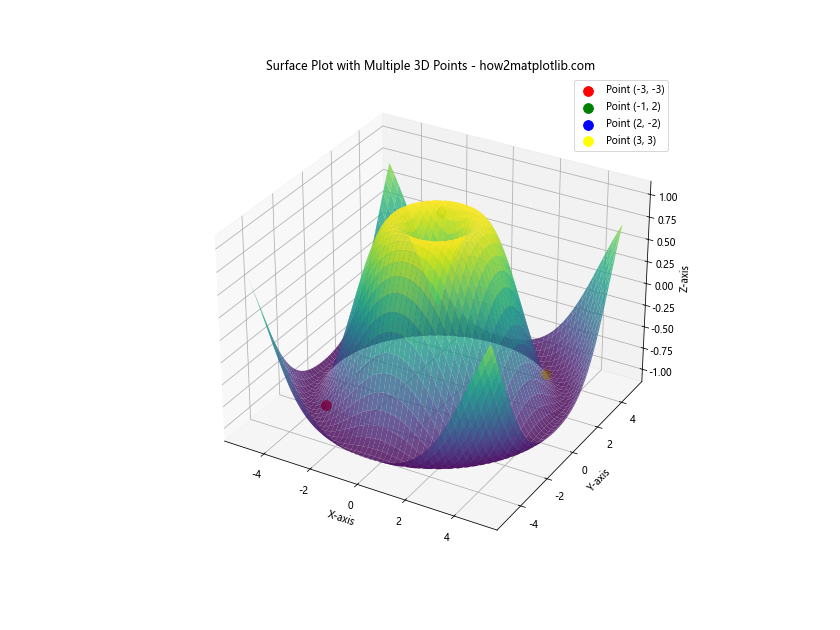
In this example, we define a list of points and corresponding colors. We then iterate through these points, calculate their z-values, and plot them on the surface using different colors.
Adding Text Labels to 3D Points
To provide more context for your 3D points, you can add text labels next to them. This is particularly useful when you want to identify specific points on your plot. Here’s how you can add text labels to your 3D points:
import matplotlib.pyplot as plt
from mpl_toolkits.mplot3d import Axes3D
import numpy as np

fig = plt.figure(figsize=(12, 9))
ax = fig.add_subplot(111, projection='3d')

x = np.linspace(-5, 5, 100)
y = np.linspace(-5, 5, 100)
X, Y = np.meshgrid(x, y)
Z = np.sin(np.sqrt(X**2 + Y**2))

surf = ax.plot_surface(X, Y, Z, cmap='viridis', alpha=0.8)

# Plot single 3D point with label
point_x, point_y = 2, 2
point_z = np.sin(np.sqrt(point_x**2 + point_y**2))
ax.scatter(point_x, point_y, point_z, color='red', s=100)
ax.text(point_x, point_y, point_z, 'Point A', fontsize=12, fontweight='bold')

ax.set_xlabel('X-axis')
ax.set_ylabel('Y-axis')
ax.set_zlabel('Z-axis')
ax.set_title('Surface Plot with Labeled 3D Point - how2matplotlib.com')

plt.show()
Output:
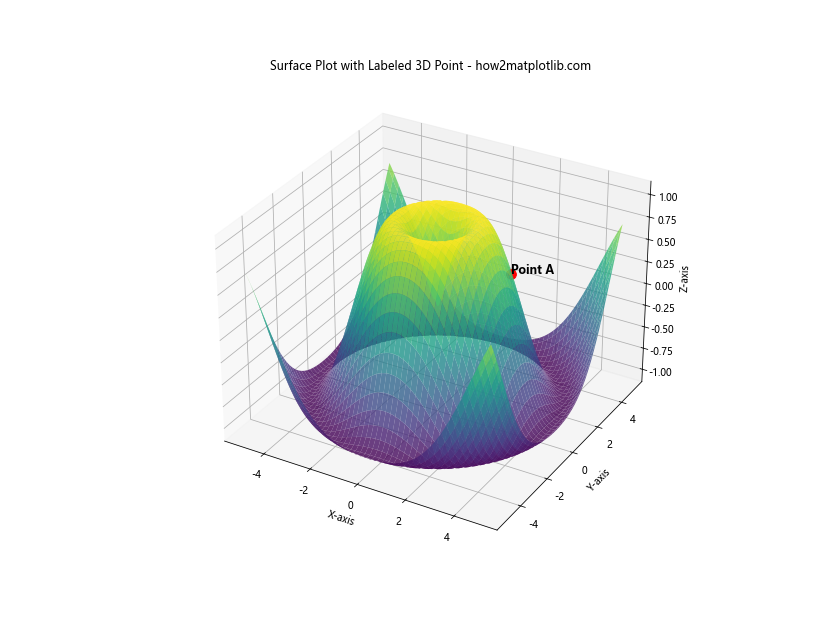
In this example, we use the text function to add a label next to our 3D point. The text function takes the x, y, and z coordinates of the label position, followed by the text content and any styling options.
Animating the 3D Plot
To make your visualization more dynamic and engaging, you can create an animation of your 3D plot. This can be particularly useful for showing how the single point moves in relation to the surface over time. Here’s an example of how to create a simple animation:
import matplotlib.pyplot as plt
from mpl_toolkits.mplot3d import Axes3D
import numpy as np
from matplotlib.animation import FuncAnimation

fig = plt.figure(figsize=(10, 8))
ax = fig.add_subplot(111, projection='3d')

x = np.linspace(-5, 5, 100)
y = np.linspace(-5, 5, 100)
X, Y = np.meshgrid(x, y)
Z = np.sin(np.sqrt(X**2 + Y**2))

surf = ax.plot_surface(X, Y, Z, cmap='viridis', alpha=0.8)

point, = ax.plot([], [], [], 'ro', markersize=10)

ax.set_xlabel('X-axis')
ax.set_ylabel('Y-axis')
ax.set_zlabel('Z-axis')
ax.set_title('Animated 3D Point on Surface - how2matplotlib.com')

def update(frame):
    t = frame / 50
    point_x = 3 * np.cos(t)
    point_y = 3 * np.sin(t)
    point_z = np.sin(np.sqrt(point_x**2 + point_y**2))
    point.set_data(point_x, point_y)
    point.set_3d_properties(point_z)
    return point,

ani = FuncAnimation(fig, update, frames=200, interval=50, blit=True)

plt.show()
Output:
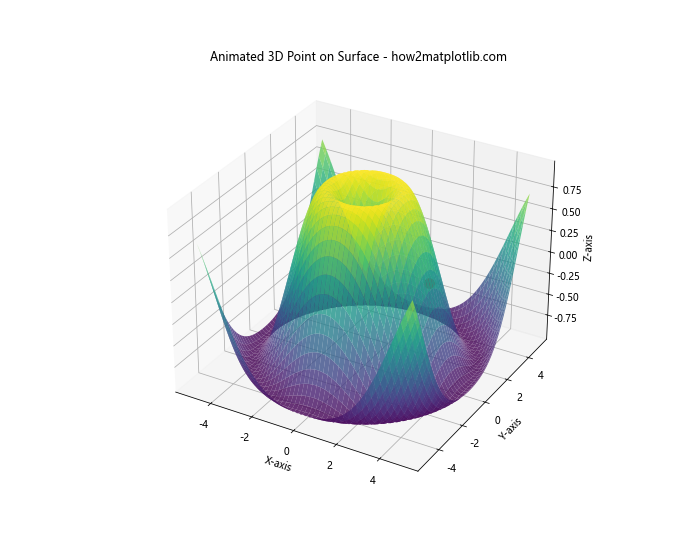
In this example, we create an animation where a single point moves in a circular path on the surface. The update function is called for each frame of the animation, updating the position of the point.
Handling Large Datasets
When dealing with large datasets, plotting every single point can be computationally expensive and may result in a cluttered visualization. In such cases, it’s often beneficial to use techniques like downsampling or plotting a subset of your data. Here’s an example of how to plot a single 3D point on top of a surface plot created from a large dataset:
import matplotlib.pyplot as plt
from mpl_toolkits.mplot3d import Axes3D
import numpy as np

fig = plt.figure(figsize=(12, 9))
ax = fig.add_subplot(111, projection='3d')

# Generate a large dataset
x = np.linspace(-10, 10, 1000)
y = np.linspace(-10, 10, 1000)
X, Y = np.meshgrid(x, y)
Z = np.sin(np.sqrt(X**2 + Y**2)) * np.exp(-0.1 * (X**2 + Y**2))

# Downsample the data for plotting
step = 10
surf = ax.plot_surface(X[::step, ::step], Y[::step, ::step], Z[::step, ::step], cmap='viridis', alpha=0.8)

# Plot single 3D point
point_x, point_y = 2, 2
point_z = np.sin(np.sqrt(point_x**2 + point_y**2)) * np.exp(-0.1 * (point_x**2 + point_y**2))
ax.scatter(point_x, point_y, point_z, color='red', s=100, label='Single Point')

ax.set_xlabel('X-axis')
ax.set_ylabel('Y-axis')
ax.set_zlabel('Z-axis')
ax.set_title('Large Dataset Surface Plot with Single 3D Point - how2matplotlib.com')
ax.legend()

plt.show()
Output:
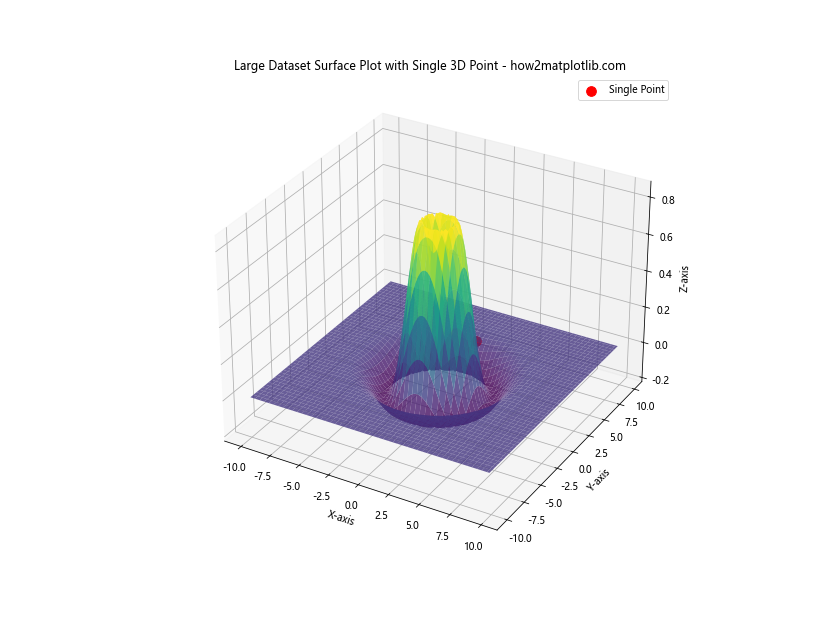
In this example, we generate a large dataset with 1000×1000 points. To make the plotting more efficient, we downsample the data by taking every 10th point when creating the surface plot. We still plot the single 3D point at its exact location.
Handling Missing Data
When working with real-world datasets, you may encounter missing or invalid data points. Matplotlib provides ways to handle these situations gracefully. Here’s an example of how to plot a surface with missing data and still include a single 3D point:
import matplotlib.pyplot as plt
from mpl_toolkits.mplot3d import Axes3D
import numpy as np

fig = plt.figure(figsize=(10, 8))
ax = fig.add_subplot(111, projection='3d')

x = np.linspace(-5, 5, 100)
y = np.linspace(-5, 5, 100)
X, Y = np.meshgrid(x, y)
Z = np.sin(np.sqrt(X**2 + Y**2))

# Introduce some missing data
mask = np.random.random(Z.shape) < 0.1
Z[mask] = np.nan

surf = ax.plot_surface(X, Y, Z, cmap='viridis', alpha=0.8)

point_x, point_y = 2, 2
point_z = np.sin(np.sqrt(point_x**2 + point_y**2))
ax.scatter(point_x, point_y, point_z, color='red', s=100, label='Single Point')

ax.set_xlabel('X-axis')
ax.set_ylabel('Y-axis')
ax.set_zlabel('Z-axis')
ax.set_title('Surface Plot with Missing Data and Single 3D Point - how2matplotlib.com')
ax.legend()

plt.show()
Output:
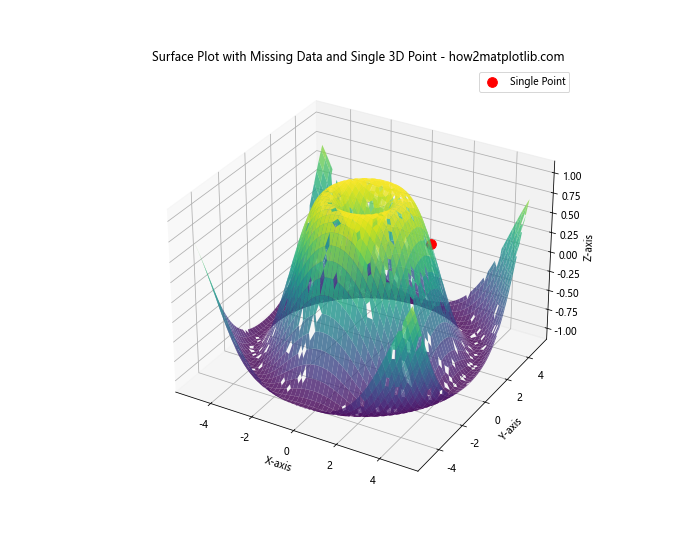
In this example, we introduce random missing data by setting some values to NaN. Matplotlib automatically handles these missing values when creating the surface plot.
Exporting High-Quality Figures
When you're satisfied with your plot and want to save it for publication or presentation, you'll want to ensure you're exporting a high-quality figure. Here's how you can save your plot as a high-resolution image:
import matplotlib.pyplot as plt
from mpl_toolkits.mplot3d import Axes3D
import numpy as np

fig = plt.figure(figsize=(12, 9), dpi=300)
ax = fig.add_subplot(111, projection='3d')

x = np.linspace(-5, 5, 100)
y = np.linspace(-5, 5, 100)
X, Y = np.meshgrid(x, y)
Z = np.sin(np.sqrt(X**2 + Y**2))

surf = ax.plot_surface(X, Y, Z, cmap='viridis', alpha=0.8)

point_x, point_y = 2, 2
point_z = np.sin(np.sqrt(point_x**2 + point_y**2))
ax.scatter(point_x, point_y, point_z, color='red', s=100, label='Single Point')

ax.set_xlabel('X-axis')
ax.set_ylabel('Y-axis')
ax.set_zlabel('Z-axis')
ax.set_title('High-Quality Surface Plot with Single 3D Point - how2matplotlib.com')
ax.legend()

plt.savefig('high_quality_3d_plot.png', dpi=300, bbox_inches='tight')
plt.show()
Output:
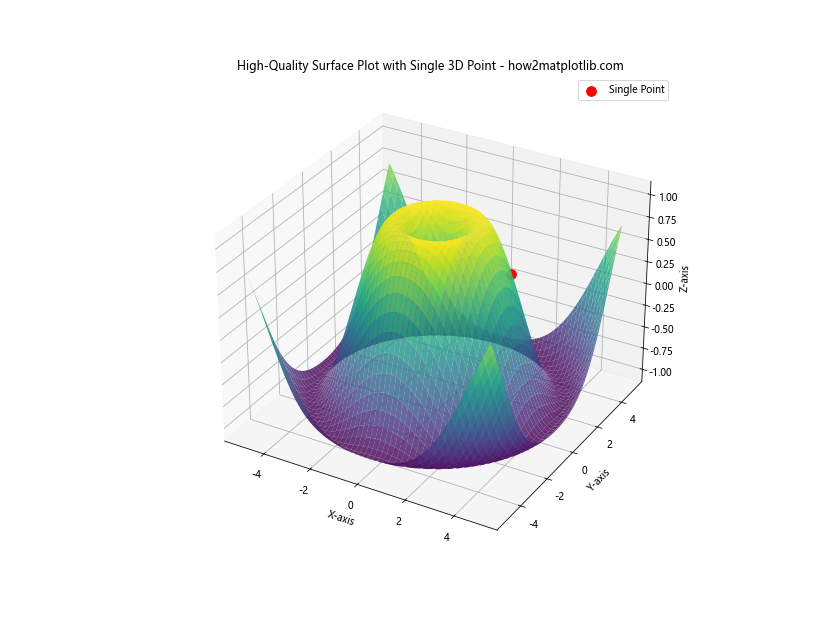
In this example, we set a high DPI (dots per inch) when creating the figure and when saving it. We also use bbox_inches='tight' to ensure that the entire plot, including labels and titles, is included in the saved image.
Conclusion
In this comprehensive guide, we've explored various aspects of plotting a single 3D point on top of a plot_surface in Python Matplotlib. We've covered the basics of 3D plotting, creating surface plots, adding individual points, customizing the appearance of plots, handling large datasets, combining multiple plot types, dealing with missing data, adding interactivity, optimizing performance, and exporting high-quality figures.