Matplotlib Histogram
In data visualization, histograms are commonly used to represent the frequency distribution of a dataset. Matplotlib is a popular Python library that can be used to create histograms easily. In this article, we will explore how to create histograms using Matplotlib, customize their appearance, and analyze the data they represent.
Basic Matplotlib Histogram
To create a basic Matplotlib histogram using Matplotlib, we first need to import the necessary libraries and generate some random data.
import matplotlib.pyplot as plt
import numpy as np

data = np.random.normal(0, 1, 1000)
Next, we can use the hist function from Matplotlib to create a Matplotlib histogram of the data.
import matplotlib.pyplot as plt
import numpy as np

data = np.random.normal(0, 1, 1000)

plt.hist(data, bins=30)
plt.xlabel('Value')
plt.ylabel('Frequency')
plt.title('Histogram of Random Data')
plt.show()
Output:
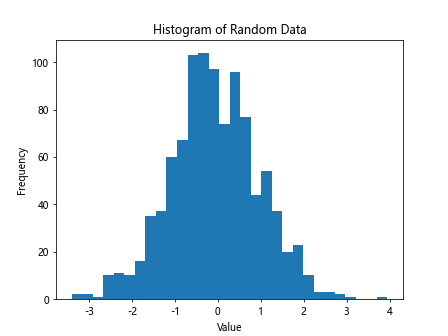
The bins parameter specifies the number of bins or intervals in which the data will be divided. In this example, we have used 30 bins.
Customizing Matplotlib Histogram Appearance
We can customize the appearance of the Matplotlib histogram by changing its color, transparency, and line style. Additionally, we can add grid lines and a legend to the plot.
import matplotlib.pyplot as plt
import numpy as np

data = np.random.normal(0, 1, 1000)

plt.hist(data, bins=30, color='skyblue', alpha=0.7, linestyle='dashed', edgecolor='black')
plt.xlabel('Value')
plt.ylabel('Frequency')
plt.title('Customized Histogram')
plt.grid(True)
plt.legend(['Data'])
plt.show()
Output:
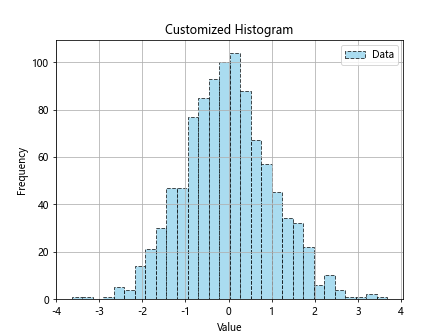
The color parameter allows us to set the color of the Matplotlib histogram bars, while alpha controls the transparency. The linestyle and edgecolor parameters determine the style and color of the Matplotlib histogram outline.
Multiple Histograms
We can also create multiple histograms on the same plot to compare different datasets. Let’s generate two sets of random data and display them in separate histograms.
import matplotlib.pyplot as plt
import numpy as np

data = np.random.normal(0, 1, 1000)
data1 = np.random.normal(0, 1, 500)
data2 = np.random.normal(2, 1.5, 500)

plt.hist(data1, bins=30, alpha=0.5, label='Data 1')
plt.hist(data2, bins=30, alpha=0.5, label='Data 2')
plt.xlabel('Value')
plt.ylabel('Frequency')
plt.title('Comparison of Two Datasets')
plt.legend()
plt.show()
Output:
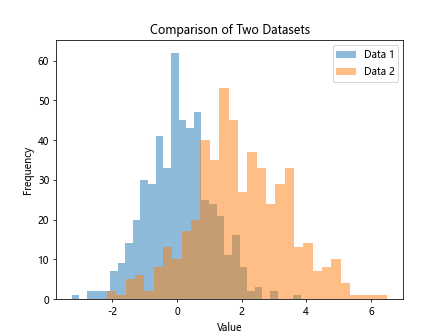
By setting the alpha parameter to a value less than 1, we can make the histograms partially transparent so that they overlap visually.
Stacked Histograms
To create stacked histograms, where the bars of one dataset are placed on top of the bars of another dataset, we can use the bottom parameter.
import matplotlib.pyplot as plt
import numpy as np

data = np.random.normal(0, 1, 1000)
data1 = np.random.normal(0, 1, 500)
data2 = np.random.normal(2, 1.5, 500)

plt.hist(data1, bins=30, alpha=0.5, label='Data 1')
plt.hist(data2, bins=30, alpha=0.5, label='Data 2', bottom=data1)
plt.xlabel('Value')
plt.ylabel('Frequency')
plt.title('Stacked Histograms')
plt.legend()
plt.show()
The bottom parameter specifies the height at which each dataset’s bars will start.
Matplotlib Histogram with Density Estimation
In addition to displaying the frequency distribution of data, we can overlay a kernel density estimate on top of the Matplotlib histogram using the density parameter.
import matplotlib.pyplot as plt
import numpy as np

data = np.random.normal(0, 1, 1000)
data1 = np.random.normal(0, 1, 500)
data2 = np.random.normal(2, 1.5, 500)

plt.hist(data, bins=30, density=True)
plt.xlabel('Value')
plt.ylabel('Density')
plt.title('Histogram with Density Estimation')
plt.show()
Output:
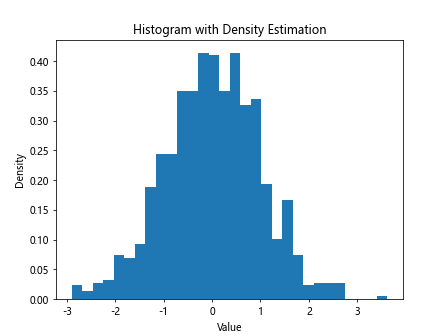
Setting density=True normalizes the Matplotlib histogram so that the total area under the curve is equal to 1, making it a probability density function.
Horizontal Matplotlib Histogram
To create a horizontal Matplotlib histogram, we can use the orientation parameter.
import matplotlib.pyplot as plt
import numpy as np

data = np.random.normal(0, 1, 1000)
data1 = np.random.normal(0, 1, 500)
data2 = np.random.normal(2, 1.5, 500)

plt.hist(data, bins=30, orientation='horizontal')
plt.xlabel('Frequency')
plt.ylabel('Value')
plt.title('Horizontal Histogram')
plt.show()
Output:
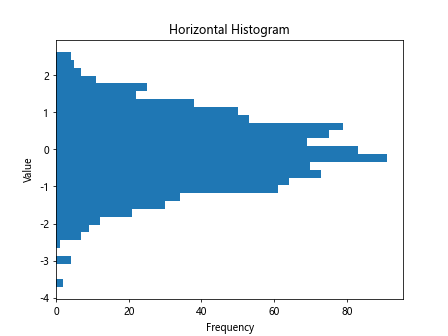
Setting orientation='horizontal' changes the orientation of the histogram bars.
Matplotlib Histogram with Log Scale
If the data spans a wide range of values, a Matplotlib histogram with a logarithmic scale can be useful to better visualize the distribution.
import matplotlib.pyplot as plt
import numpy as np

data = np.random.normal(0, 1, 1000)
data1 = np.random.normal(0, 1, 500)
data2 = np.random.normal(2, 1.5, 500)

plt.hist(data, bins=30)
plt.yscale('log')
plt.xlabel('Value')
plt.ylabel('Frequency')
plt.title('Histogram with Log Scale')
plt.show()
Output:
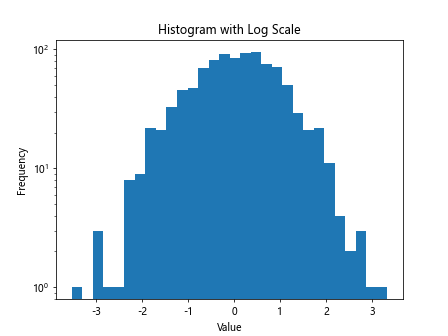
By calling plt.yscale('log'), we set the y-axis to a logarithmic scale.
Matplotlib Histogram with Annotations
We can add text annotations to a histogram to provide additional information or highlight specific data points.
import matplotlib.pyplot as plt
import numpy as np

data = np.random.normal(0, 1, 1000)
data1 = np.random.normal(0, 1, 500)
data2 = np.random.normal(2, 1.5, 500)

plt.hist(data, bins=30)
plt.text(2, 50, 'Peak', fontsize=12, color='red')
plt.xlabel('Value')
plt.ylabel('Frequency')
plt.title('Histogram with Annotations')
plt.show()
Output:
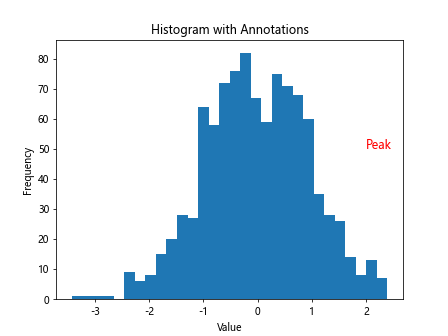
The text function allows us to specify the position, text content, font size, and color of the annotation.
Cumulative Matplotlib Histogram
A cumulative Matplotlib histogram shows the cumulative distribution function (CDF) of the data. We can create a cumulative Matplotlib histogram using the density and cumulative parameters.
import matplotlib.pyplot as plt
import numpy as np

data = np.random.normal(0, 1, 1000)
data1 = np.random.normal(0, 1, 500)
data2 = np.random.normal(2, 1.5, 500)

plt.hist(data, bins=30, density=True, cumulative=True)
plt.xlabel('Value')
plt.ylabel('Cumulative Probability')
plt.title('Cumulative Histogram')
plt.show()
Output:
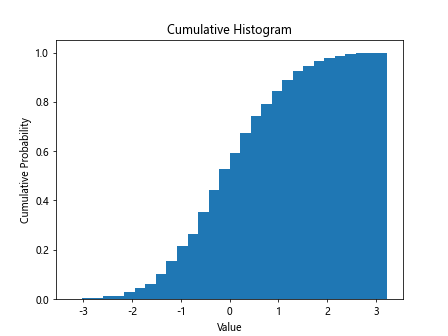
Setting cumulative=True transforms the histogram into a cumulative distribution.
Matplotlib Histogram with Error Bars
To display variability or uncertainty in the Matplotlib histogram bars, we can add error bars using the yerr parameter.
import matplotlib.pyplot as plt
import numpy as np

data = np.random.normal(0, 1, 1000)
data1 = np.random.normal(0, 1, 500)
data2 = np.random.normal(2, 1.5, 500)

counts, bins, _ = plt.hist(data, bins=30)
errors = np.sqrt(counts)  # Square root of counts as errors

plt.errorbar(bins[:-1], counts, yerr=errors, fmt='o', color='black', label='Data with Error Bars')
plt.xlabel('Value')
plt.ylabel('Frequency')
plt.title('Histogram with Error Bars')
plt.legend()
plt.show()
Output:
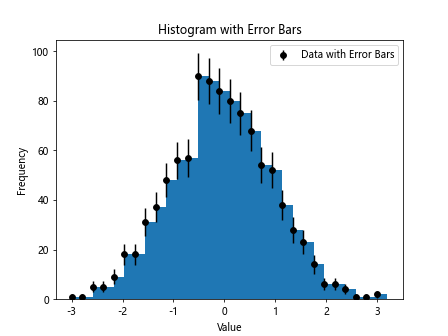
The plt.errorbar function adds error bars to the histogram bars based on the calculated errors.
3D Matplotlib Histogram
Matplotlib also provides functionality to create 3D histograms, especially useful for visualizing multidimensional data.
from mpl_toolkits.mplot3d import Axes3D
import matplotlib.pyplot as plt
import numpy as np

data = np.random.normal(0, 1, 1000)
data1 = np.random.normal(0, 1, 500)
data2 = np.random.normal(2, 1.5, 500)

data3d = np.random.normal(0, 1, (1000, 3))

fig = plt.figure()
ax = fig.add_subplot(111, projection='3d')
hist, xedges, yedges = np.histogram2d(data3d[:,0], data3d[:,1], bins=30, density=True)
xpos, ypos = np.meshgrid(xedges[:-1], yedges[:-1], indexing="ij")
xpos = xpos.ravel()
ypos = ypos.ravel()
zpos = 0

dx = dy = np.ones_like(zpos)
dz = hist.ravel()

ax.bar3d(xpos, ypos, zpos, dx, dy, dz, zsort='average')
plt.xlabel('X')
plt.ylabel('Y')
ax.set_zlabel('Frequency')
plt.title('3D Histogram')
plt.show()
Output:
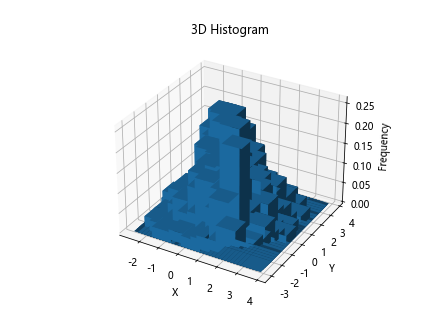
In this example, we use the histogram2d function to create a 2D histogram, which is then displayed using Matplotlib’s 3D plotting capabilities.
Grouped Matplotlib Histogram
To create grouped histograms that display multiple datasets next to each other rather than stacked, we can adjust the positions of the bars.
import matplotlib.pyplot as plt
import numpy as np

data = np.random.normal(0, 1, 1000)
data1 = np.random.normal(0, 1, 500)
data2 = np.random.normal(2, 1.5, 500)

barWidth = 0.3
r1 = np.arange(len(data1))
r2 = [x + barWidth for x in r1]

plt.bar(r1, np.histogram(data1, bins=30)[0], color='skyblue', width=barWidth, label='Data 1')
plt.bar(r2, np.histogram(data2, bins=30)[0], color='salmon', width=barWidth, label='Data 2')
plt.xlabel('Value')
plt.ylabel('Frequency')
plt.title('Grouped Histogram')
plt.legend()
plt.show()
By adjusting the positions of the bars using r1 and r2, we create a grouped matplotlib histogram with distinct datasets side by side.
Weighted Matplotlib Histogram
In some cases, it may be necessary to assign different weights to individual data points in the histogram calculation. This can be achieved using the weights parameter.
import matplotlib.pyplot as plt
import numpy as np

data = np.random.normal(0, 1, 1000)
data1 = np.random.normal(0, 1, 500)
data2 = np.random.normal(2, 1.5, 500)

weights = np.random.rand(1000)  # Random weights for each data point

plt.hist(data, bins=30, weights=weights)
plt.xlabel('Value')
plt.ylabel('Weighted Frequency')
plt.title('Weighted Histogram')
plt.show()
Output:
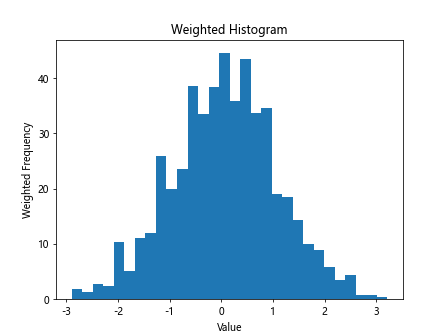
The weights parameter allows us to assign a weight to each data point, influencing the height of the## Cumulative Density Histogram
Similar to the cumulative histogram, we can create a cumulative density histogram by setting the density parameter to True and cumulative parameter to True.
import matplotlib.pyplot as plt
import numpy as np

data = np.random.normal(0, 1, 1000)
data1 = np.random.normal(0, 1, 500)
data2 = np.random.normal(2, 1.5, 500)

plt.hist(data, bins=30, density=True, cumulative=True, histtype='step', linewidth=1.5)
plt.xlabel('Value')
plt.ylabel('Cumulative Density')
plt.title('Cumulative Density Histogram')
plt.show()
Output:
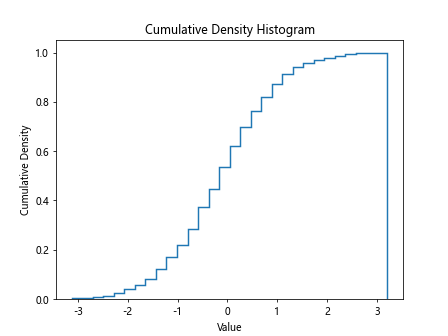
Using histtype='step' with a specified line width creates a step plot representing the cumulative density function.
Interactive Matplotlib Histogram
To create an interactive matplotlib histogram that allows for user interaction, we can utilize tools such as Plotly.
import plotly.express as px
import matplotlib.pyplot as plt
import numpy as np

data = np.random.normal(0, 1, 1000)
data1 = np.random.normal(0, 1, 500)
data2 = np.random.normal(2, 1.5, 500)

fig = px.histogram(x=data, nbins=30)
fig.update_layout(title="Interactive Histogram")
fig.show()
Plotly provides an interactive plotting interface that allows for zooming, panning, and hover-over tooltips for detailed data exploration.
Matplotlib Histogram with Kernel Density Estimate
In addition to the default matplotlib histogram bars, we can overlay a kernel density estimate to visualize the underlying distribution of the data.
import seaborn as sns
import matplotlib.pyplot as plt
import numpy as np

data = np.random.normal(0, 1, 1000)
data1 = np.random.normal(0, 1, 500)
data2 = np.random.normal(2, 1.5, 500)

sns.histplot(data, kde=True, color='skyblue', edgecolor='black')
plt.xlabel('Value')
plt.ylabel('Density')
plt.title('Histogram with KDE')
plt.show()
Output:
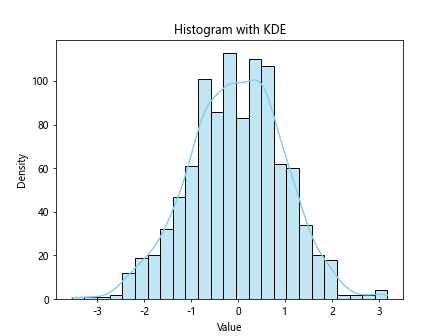
Using the seaborn library, we can combine a histogram plot with a smoothed KDE curve to better understand the data distribution.
Equal-width Matplotlib Histogram Binning
By default, Matplotlib automatically determines the bin widths for the matplotlib histogram. However, we can specify equal-width binning to ensure uniform bin sizes.
import matplotlib.pyplot as plt
import numpy as np

data = np.random.normal(0, 1, 1000)
data1 = np.random.normal(0, 1, 500)
data2 = np.random.normal(2, 1.5, 500)

plt.hist(data, bins=np.arange(-3, 4, 1), edgecolor='black')
plt.xlabel('Value')
plt.ylabel('Frequency')
plt.title('Equal-width Histogram Binning')
plt.show()
Output:
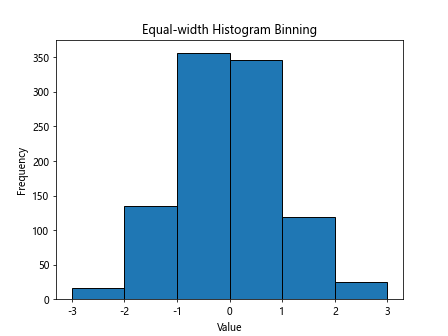
In this example, we define bins with a width of 1 using np.arange to create evenly spaced intervals for the histogram.
Matplotlib Histogram with Different Bin Counts
For datasets where certain ranges have more significance, we can create histograms with varying bin counts.
import matplotlib.pyplot as plt
import numpy as np

data = np.random.normal(0, 1, 1000)
data1 = np.random.normal(0, 1, 500)
data2 = np.random.normal(2, 1.5, 500)

bins = [0, 1, 2, 3, 5, 10, 20, 30]
plt.hist(data, bins=bins, edgecolor='black')
plt.xlabel('Value')
plt.ylabel('Frequency')
plt.title('Histogram with Different Bin Counts')
plt.show()
Output:
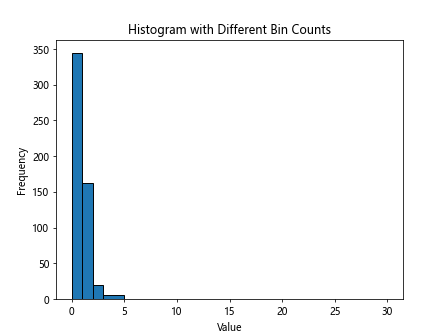
By specifying custom bin edges in the bins parameter, we can adjust the bin sizes to capture specific data patterns effectively.
Matplotlib Histogram of Discrete Data
Histograms are not limited to continuous numerical data and can be used to visualize discrete or categorical data.
import matplotlib.pyplot as plt
import numpy as np

data = np.random.normal(0, 1, 1000)
data1 = np.random.normal(0, 1, 500)
data2 = np.random.normal(2, 1.5, 500)

categories = ['A', 'B', 'C', 'A', 'B', 'C', 'D']
plt.hist(categories, bins=np.unique(categories), edgecolor='black', align='mid')
plt.xlabel('Category')
plt.ylabel('Frequency')
plt.title('Histogram of Discrete Data')
plt.show()
Output:
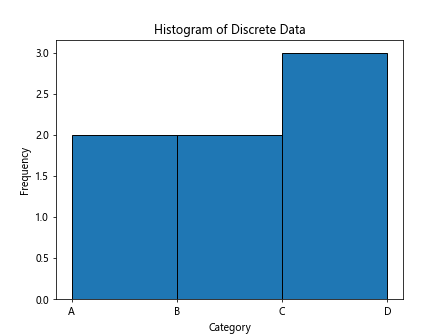
In this example, the histogram displays the frequency of each unique category in the dataset.
Animated Matplotlib Histogram
To create an animated matplotlib histogram that visualizes changes in the data distribution over time, we can use the FuncAnimation module from Matplotlib.
from matplotlib.animation import FuncAnimation
import matplotlib.pyplot as plt
import numpy as np

data = np.random.normal(0, 1, 1000)
data1 = np.random.normal(0, 1, 500)
data2 = np.random.normal(2, 1.5, 500)

fig, ax = plt.subplots()
def update(frame):
    ax.clear()
    ax.hist(data[:frame], bins=30, color='skyblue', edgecolor='black')
    ax.set_title('Animated Histogram')
    ax.set_xlabel('Value')
    ax.set_ylabel('Frequency')

ani = FuncAnimation(fig, update, frames=len(data), interval=50)
plt.show()
Using FuncAnimation and a custom update function, we can animate the matplotlib histogram as it iterates through the data.
Kernel Density Estimation Plot
In addition to overlaying a KDE on histograms, we can create standalone density plots to visualize data distribution more smoothly.
import matplotlib.pyplot as plt
import numpy as np
import seaborn as sns

data = np.random.normal(0, 1, 1000)
data1 = np.random.normal(0, 1, 500)
data2 = np.random.normal(2, 1.5, 500)

sns.kdeplot(data, color='skyblue', shade=True)
plt.xlabel('Value')
plt.ylabel('Density')
plt.title('Kernel Density Estimation Plot')
plt.show()
The sns.kdeplot function from seaborn generates a continuous density estimate without the binning constraints of histograms.
Matplotlib Histogram Conclusion
In this article, we explored various techniques for creating and customizing histograms using Matplotlib. We covered basic histograms, customizations, multiple histograms, stacked histograms, and advanced features like annotations, 3D histograms, weighted histograms, and interactive plots. Histograms are powerful tools for visualizing the frequency distribution of data and can provide valuable insights into the underlying patterns and trends within a dataset. With the flexibility and versatility of Matplotlib, you can create informative and visually appealing histograms for your data analysis tasks.