How to Master Matplotlib Markers: A Comprehensive Guide for Data Visualization
Matplotlib markers are essential elements in data visualization using the popular Python library Matplotlib. Markers help highlight specific data points on plots, making it easier for viewers to interpret and analyze the information presented. In this comprehensive guide, we’ll explore various aspects of matplotlib markers, including their types, customization options, and best practices for using them effectively in your data visualizations.
Matplotlib Markers Recommended Articles
- matplotlib markers empty circle
- matplotlib markers fillstyle
- matplotlib markers list
- matplotlib markers size
Understanding Matplotlib Markers
Matplotlib markers are symbols used to represent individual data points on a plot. They come in various shapes and sizes, allowing you to differentiate between different data series or emphasize specific points of interest. Matplotlib offers a wide range of built-in marker styles, and you can even create custom markers to suit your specific needs.
Let’s start with a simple example to demonstrate how to use matplotlib markers:
import matplotlib.pyplot as plt

x = [1, 2, 3, 4, 5]
y = [2, 4, 6, 8, 10]

plt.plot(x, y, marker='o', linestyle='-', label='how2matplotlib.com')
plt.title('Simple Plot with Markers')
plt.xlabel('X-axis')
plt.ylabel('Y-axis')
plt.legend()
plt.show()
Output:
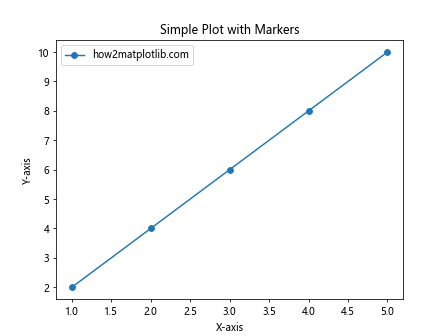
In this example, we use the ‘o’ marker to represent circular points on the plot. The marker parameter in the plt.plot() function allows you to specify the marker style.
Types of Matplotlib Markers
Matplotlib provides a variety of marker styles to choose from. Here’s a list of some commonly used markers:
- ‘o’: Circle
- ‘s’: Square
- ‘^’: Triangle up
- ‘v’: Triangle down
- ‘D’: Diamond
- ‘p’: Pentagon
- ‘*’: Star
- ‘+’: Plus
- ‘x’: X
- ‘.’: Point
Let’s create a plot showcasing different marker types:
import matplotlib.pyplot as plt

x = range(1, 11)
markers = ['o', 's', '^', 'v', 'D', 'p', '*', '+', 'x', '.']

for i, marker in enumerate(markers):
    plt.plot(x, [i*2]*10, marker=marker, linestyle='', label=f'{marker} - how2matplotlib.com')

plt.title('Different Matplotlib Markers')
plt.xlabel('X-axis')
plt.ylabel('Y-axis')
plt.legend(ncol=2)
plt.show()
Output:
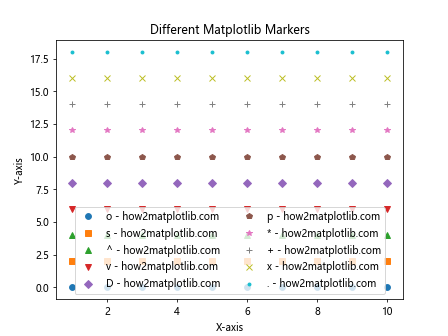
This example demonstrates various marker styles available in Matplotlib. Each line in the plot uses a different marker type, allowing you to compare and choose the most suitable one for your visualization needs.
Customizing Matplotlib Markers
Matplotlib offers extensive customization options for markers, allowing you to adjust their size, color, and other properties. Let’s explore some of these customization techniques:
Matplotlib Marker Size
You can control the size of markers using the markersize or ms parameter:
import matplotlib.pyplot as plt

x = [1, 2, 3, 4, 5]
y = [2, 4, 6, 8, 10]

plt.plot(x, y, marker='o', markersize=12, label='how2matplotlib.com')
plt.title('Customizing Marker Size')
plt.xlabel('X-axis')
plt.ylabel('Y-axis')
plt.legend()
plt.show()
Output:
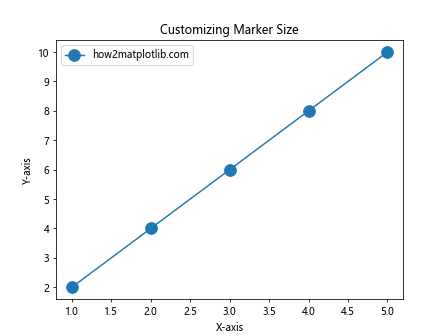
In this example, we set the marker size to 12 points, creating larger circular markers on the plot.
Matplotlib Marker Color
You can change the color of markers using the markerfacecolor and markeredgecolor parameters:
import matplotlib.pyplot as plt

x = [1, 2, 3, 4, 5]
y = [2, 4, 6, 8, 10]

plt.plot(x, y, marker='s', markerfacecolor='red', markeredgecolor='blue', label='how2matplotlib.com')
plt.title('Customizing Marker Colors')
plt.xlabel('X-axis')
plt.ylabel('Y-axis')
plt.legend()
plt.show()
Output:
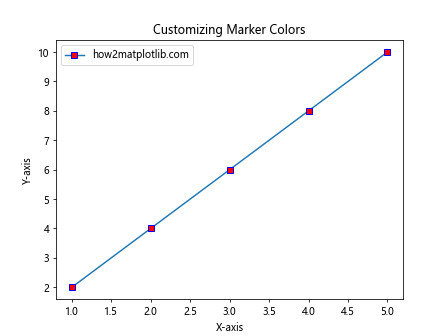
This example creates square markers with red fill and blue edges.
Matplotlib Marker Edge Width
You can adjust the width of marker edges using the markeredgewidth parameter:
import matplotlib.pyplot as plt

x = [1, 2, 3, 4, 5]
y = [2, 4, 6, 8, 10]

plt.plot(x, y, marker='D', markeredgewidth=2, markersize=10, label='how2matplotlib.com')
plt.title('Customizing Marker Edge Width')
plt.xlabel('X-axis')
plt.ylabel('Y-axis')
plt.legend()
plt.show()
Output:
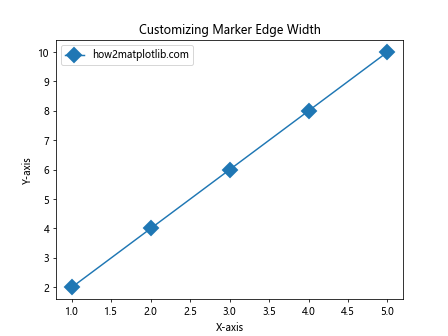
This example creates diamond-shaped markers with thicker edges.
Using Matplotlib Markers in Scatter Plots
Scatter plots are particularly well-suited for using markers to represent individual data points. Let’s create a scatter plot with custom markers:
import matplotlib.pyplot as plt
import numpy as np

x = np.random.rand(50)
y = np.random.rand(50)
colors = np.random.rand(50)
sizes = 1000 * np.random.rand(50)

plt.scatter(x, y, c=colors, s=sizes, alpha=0.5, marker='*')
plt.title('Scatter Plot with Custom Markers')
plt.xlabel('X-axis')
plt.ylabel('Y-axis')
plt.text(0.5, 0.95, 'how2matplotlib.com', ha='center', va='center', transform=plt.gca().transAxes)
plt.colorbar(label='Color')
plt.show()
Output:
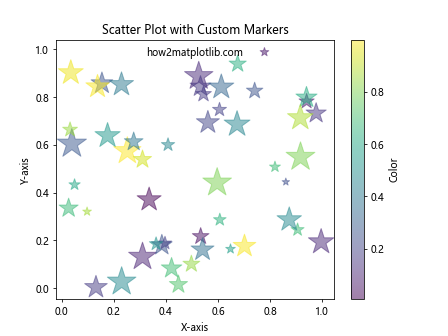
In this example, we create a scatter plot with star-shaped markers. The marker size and color vary based on random values, creating a visually interesting plot.
Combining Multiple Matplotlib Marker Types
You can use different marker types in the same plot to distinguish between multiple data series:
import matplotlib.pyplot as plt
import numpy as np

x = np.linspace(0, 10, 50)
y1 = np.sin(x)
y2 = np.cos(x)

plt.plot(x, y1, marker='o', linestyle='-', label='Sin - how2matplotlib.com')
plt.plot(x, y2, marker='^', linestyle='--', label='Cos - how2matplotlib.com')
plt.title('Multiple Marker Types')
plt.xlabel('X-axis')
plt.ylabel('Y-axis')
plt.legend()
plt.show()
Output:
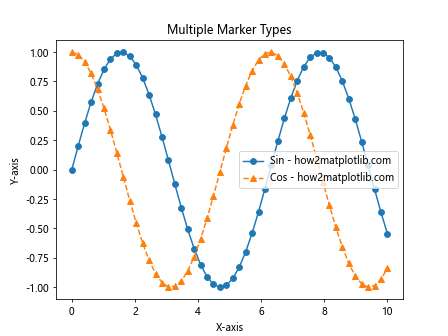
This example plots sine and cosine functions using different marker types and line styles to differentiate between the two series.
Creating Custom Matplotlib Markers
While Matplotlib provides a wide range of built-in markers, you can also create custom markers using Path objects:
import matplotlib.pyplot as plt
import matplotlib.path as mpath
import numpy as np

star = mpath.Path.unit_regular_star(5)
circle = mpath.Path.unit_circle()
# concatenate the circle with an internal star
verts = np.concatenate([circle.vertices, star.vertices[::-1, ...]])
codes = np.concatenate([circle.codes, star.codes])
cut_star = mpath.Path(verts, codes)

x = np.linspace(0, 2*np.pi, 10)
y = np.sin(x)

plt.plot(x, y, marker=cut_star, markersize=15, linestyle='', label='how2matplotlib.com')
plt.title('Custom Marker: Star in Circle')
plt.xlabel('X-axis')
plt.ylabel('Y-axis')
plt.legend()
plt.show()
Output:
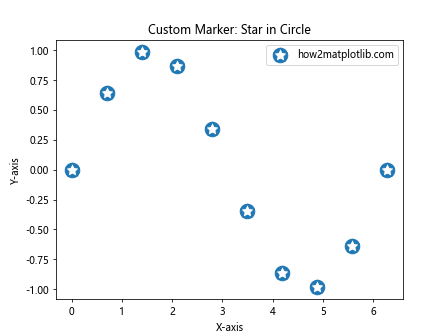
This example creates a custom marker that combines a circle with a star inside it.
Matplotlib Marker Filling Styles
Matplotlib allows you to control the filling style of markers using the fillstyle parameter:
import matplotlib.pyplot as plt

x = range(1, 6)
fillstyles = ['full', 'left', 'right', 'bottom', 'top']

for i, style in enumerate(fillstyles):
    plt.plot(x, [i]*5, marker='o', markersize=15, fillstyle=style, label=f'{style} - how2matplotlib.com')

plt.title('Marker Filling Styles')
plt.xlabel('X-axis')
plt.ylabel('Y-axis')
plt.legend()
plt.show()
Output:
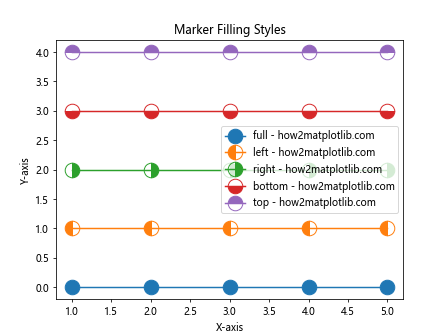
This example demonstrates different filling styles for circular markers.
Matplotlib Markers in 3D Plots
Matplotlib markers can also be used in 3D plots to represent data points in three-dimensional space:
import matplotlib.pyplot as plt
from mpl_toolkits.mplot3d import Axes3D
import numpy as np

fig = plt.figure()
ax = fig.add_subplot(111, projection='3d')

x = np.random.rand(50)
y = np.random.rand(50)
z = np.random.rand(50)

ax.scatter(x, y, z, marker='^', s=100)
ax.set_xlabel('X-axis')
ax.set_ylabel('Y-axis')
ax.set_zlabel('Z-axis')
ax.set_title('3D Scatter Plot with Markers')
plt.text(0.5, 0.95, 'how2matplotlib.com', ha='center', va='center', transform=plt.gca().transAxes)
plt.show()
This example creates a 3D scatter plot with triangle markers representing data points in three-dimensional space.
Matplotlib Markers in Polar Plots
Matplotlib markers can be used effectively in polar plots to represent data points in polar coordinates:
import matplotlib.pyplot as plt
import numpy as np

r = np.arange(0, 2, 0.01)
theta = 2 * np.pi * r

fig, ax = plt.subplots(subplot_kw={'projection': 'polar'})
ax.plot(theta, r, marker='o', markersize=5)
ax.set_rmax(2)
ax.set_rticks([0.5, 1, 1.5, 2])
ax.set_rlabel_position(-22.5)
ax.grid(True)
ax.set_title("Polar Plot with Markers")
plt.text(0.5, 0.95, 'how2matplotlib.com', ha='center', va='center', transform=plt.gca().transAxes)
plt.show()
Output:
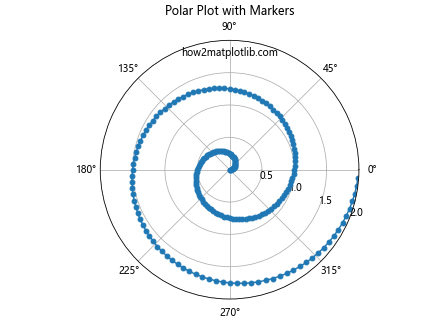
This example creates a polar plot with circular markers representing data points along a spiral path.
Matplotlib Markers in Subplots
You can use different marker styles in subplots to compare multiple datasets:
import matplotlib.pyplot as plt
import numpy as np

x = np.linspace(0, 10, 50)
y1 = np.sin(x)
y2 = np.cos(x)
y3 = np.tan(x)
y4 = np.exp(-x/10)

fig, ((ax1, ax2), (ax3, ax4)) = plt.subplots(2, 2, figsize=(12, 10))

ax1.plot(x, y1, marker='o', label='Sin - how2matplotlib.com')
ax1.set_title('Sine Function')
ax1.legend()

ax2.plot(x, y2, marker='^', label='Cos - how2matplotlib.com')
ax2.set_title('Cosine Function')
ax2.legend()

ax3.plot(x, y3, marker='s', label='Tan - how2matplotlib.com')
ax3.set_title('Tangent Function')
ax3.legend()

ax4.plot(x, y4, marker='D', label='Exp - how2matplotlib.com')
ax4.set_title('Exponential Function')
ax4.legend()

plt.tight_layout()
plt.show()
Output:
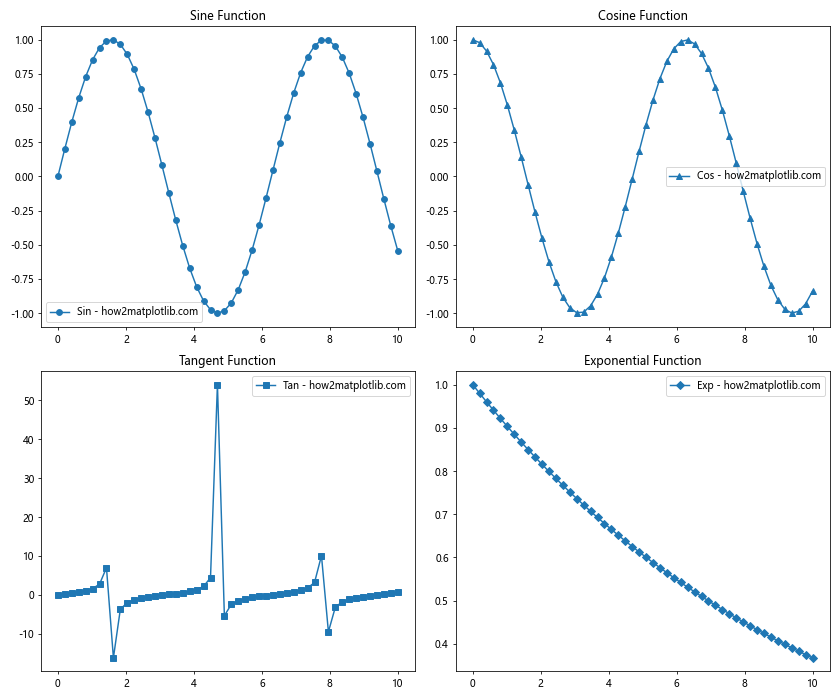
This example creates four subplots, each with a different function and marker style.
Matplotlib Markers in Error Bars
Matplotlib markers can be combined with error bars to represent data points and their associated uncertainties:
import matplotlib.pyplot as plt
import numpy as np

x = np.linspace(0, 10, 50)
y = np.sin(x)
yerr = 0.1 + 0.2 * np.random.rand(len(x))

plt.errorbar(x, y, yerr=yerr, fmt='o', markersize=8, capsize=5, label='how2matplotlib.com')
plt.title('Error Bars with Markers')
plt.xlabel('X-axis')
plt.ylabel('Y-axis')
plt.legend()
plt.show()
Output:
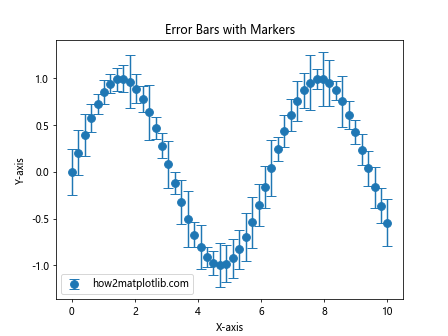
This example creates a plot with error bars and circular markers representing data points and their uncertainties.
Matplotlib Markers in Boxplots
While boxplots typically use specific shapes to represent statistical information, you can add markers to highlight individual data points:
import matplotlib.pyplot as plt
import numpy as np

data = [np.random.normal(0, std, 100) for std in range(1, 4)]

fig, ax = plt.subplots()
bp = ax.boxplot(data)

for i, d in enumerate(data):
    y = d
    x = np.random.normal(i + 1, 0.04, len(y))
    ax.plot(x, y, 'r.', alpha=0.2)

ax.set_title('Boxplot with Individual Data Points')
ax.set_xlabel('Group')
ax.set_ylabel('Value')
plt.text(0.5, 0.95, 'how2matplotlib.com', ha='center', va='center', transform=plt.gca().transAxes)
plt.show()
Output:
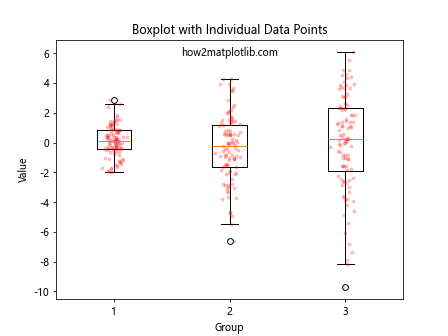
This example creates a boxplot with individual data points represented by red markers.
Matplotlib Markers in Histograms
While histograms typically don’t use markers, you can add them to highlight specific bins or values:
import matplotlib.pyplot as plt
import numpy as np

data = np.random.randn(1000)
counts, bins, _ = plt.hist(data, bins=30, edgecolor='black')

# Add markers at the top of each bin
bin_centers = 0.5 * (bins[:-1] + bins[1:])
plt.plot(bin_centers, counts, 'ro', markersize=8)

plt.title('Histogram with Markers')
plt.xlabel('Value')
plt.ylabel('Frequency')
plt.text(0.5, 0.95, 'how2matplotlib.com', ha='center', va='center', transform=plt.gca().transAxes)
plt.show()
Output:
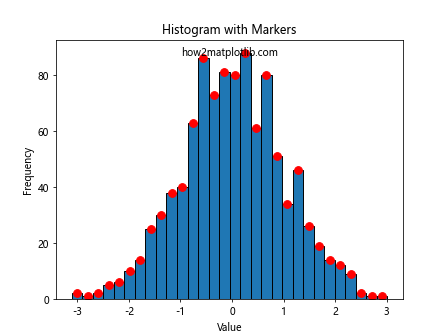
This example creates a histogram with red circular markers at the top of each bin.
Matplotlib Markers in Contour Plots
You can use markers in contour plots to highlight specific points of interest:
import matplotlib.pyplot as plt
import numpy as np

def f(x, y):
    return np.sin(np.sqrt(x ** 2 + y ** 2))

x = np.linspace(-6, 6, 30)
y = np.linspace(-6, 6, 30)
X, Y = np.meshgrid(x, y)
Z = f(X, Y)

plt.contourf(X, Y, Z, 20, cmap='RdYlBu_r')
plt.colorbar(label='Z value')

# Add markers for local maxima
max_points = [(0, 0), (3.8, 3.8), (-3.8, -3.8)]
for point in max_points:
    plt.plot(point[0], point[1], 'ko', markersize=10)

plt.title('Contour Plot with Markers')
plt.xlabel('X-axis')
plt.ylabel('Y-axis')
plt.text(0.5, 0.95, 'how2matplotlib.com', ha='center', va='center', transform=plt.gca().transAxes)
plt.show()
Output:
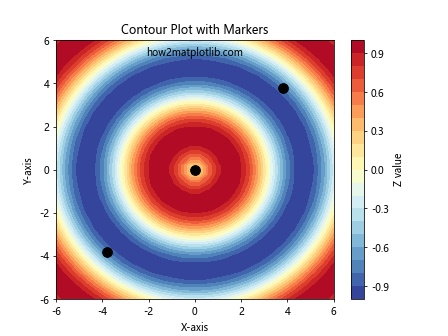
This example creates a contour plot with black circular markers highlighting local maxima.
Best Practices for Using Matplotlib Markers
When using matplotlib markers in your visualizations, consider the following best practices:
- Choose appropriate marker styles: Select marker stylesthat are easily distinguishable and suitable for your data type.
Use consistent marker sizes: Maintain consistent marker sizes across your plot unless you’re intentionally varying them to represent a specific variable.
Consider color contrast: Ensure that your markers have sufficient contrast with the background and other plot elements.
Avoid overcrowding: Use markers sparingly in plots with many data points to prevent visual clutter.
Combine markers with other visual elements: Use markers in conjunction with line styles, colors, and labels to create more informative visualizations.
Provide a legend: Include a legend to explain the meaning of different marker styles used in your plot.
Use markers to highlight important points: Employ markers to draw attention to specific data points of interest.
Consider the data-ink ratio: Use markers judiciously to maintain a good balance between data representation and visual simplicity.
Test for accessibility: Ensure that your chosen marker styles are distinguishable for colorblind viewers.
Document your marker choices: Include information about marker styles and their meanings in your plot’s documentation or caption.
Advanced Techniques with Matplotlib Markers
Let’s explore some advanced techniques for using matplotlib markers in your visualizations: