Mastering Matplotlib Subplots: A Comprehensive Guide
Matplotlib subplots are an essential feature of the popular data visualization library, allowing users to create multiple plots within a single figure. This comprehensive guide will explore the various aspects of Matplotlib subplots, providing detailed explanations and practical examples to help you master this powerful tool.
Matplotlib Subplots Recommended Articles
- matplotlib subplots figsize
- matplotlib subplots legend
- matplotlib subplots padding
- matplotlib subplots spacing
- matplotlib subplots title
- matplotlib subplots_adjust
Understanding Matplotlib Subplots
Matplotlib subplots provide a way to organize and arrange multiple plots within a single figure. This feature is particularly useful when you need to compare different datasets or visualize related information side by side. Subplots allow you to create complex layouts of plots, giving you full control over their arrangement and appearance.
Let’s start with a basic example of creating subplots:
import matplotlib.pyplot as plt
import numpy as np

# Create a figure with 2 subplots
fig, (ax1, ax2) = plt.subplots(1, 2, figsize=(10, 4))

# Generate some data
x = np.linspace(0, 10, 100)
y1 = np.sin(x)
y2 = np.cos(x)

# Plot data on the first subplot
ax1.plot(x, y1, label='Sine')
ax1.set_title('Sine Wave - how2matplotlib.com')
ax1.legend()

# Plot data on the second subplot
ax2.plot(x, y2, label='Cosine')
ax2.set_title('Cosine Wave - how2matplotlib.com')
ax2.legend()

plt.tight_layout()
plt.show()
Output:
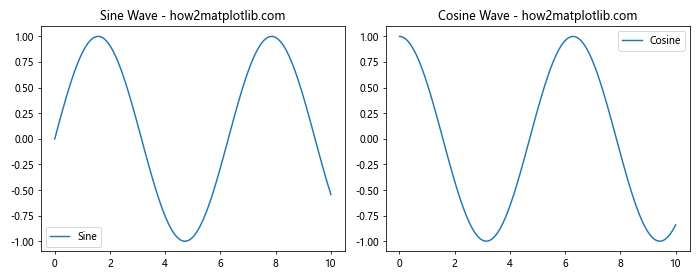
In this example, we create a figure with two subplots arranged horizontally. We use plt.subplots(1, 2) to create a 1×2 grid of subplots. The figsize parameter sets the overall figure size. We then plot a sine wave on the first subplot and a cosine wave on the second subplot.
Creating Matplotlib Subplots with Different Layouts
Matplotlib subplots offer flexibility in creating various layouts. You can arrange subplots in rows and columns to suit your visualization needs. Let’s explore different layout options:
Grid Layout with Matplotlib Subplots
import matplotlib.pyplot as plt
import numpy as np

# Create a 2x2 grid of subplots
fig, axs = plt.subplots(2, 2, figsize=(10, 8))

# Generate some data
x = np.linspace(0, 10, 100)
y1 = np.sin(x)
y2 = np.cos(x)
y3 = np.tan(x)
y4 = np.exp(x)

# Plot data on each subplot
axs[0, 0].plot(x, y1)
axs[0, 0].set_title('Sine - how2matplotlib.com')

axs[0, 1].plot(x, y2)
axs[0, 1].set_title('Cosine - how2matplotlib.com')

axs[1, 0].plot(x, y3)
axs[1, 0].set_title('Tangent - how2matplotlib.com')

axs[1, 1].plot(x, y4)
axs[1, 1].set_title('Exponential - how2matplotlib.com')

plt.tight_layout()
plt.show()
Output:
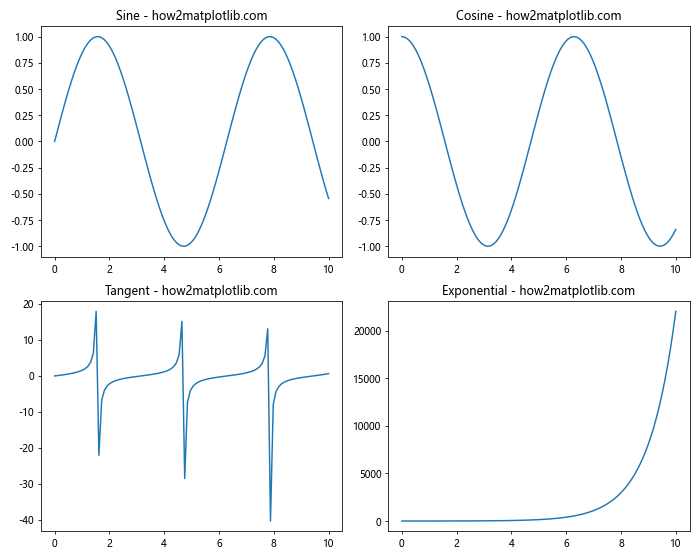
In this example, we create a 2×2 grid of subplots using plt.subplots(2, 2). The axs variable is now a 2D array of Axes objects, which we can access using indexing to plot on each subplot.
Uneven Layouts with Matplotlib Subplots
Matplotlib subplots also support uneven layouts, where subplots can span multiple rows or columns:
import matplotlib.pyplot as plt
import numpy as np

# Create an uneven layout of subplots
fig = plt.figure(figsize=(12, 8))
gs = fig.add_gridspec(3, 3)

ax1 = fig.add_subplot(gs[0, :])
ax2 = fig.add_subplot(gs[1, :-1])
ax3 = fig.add_subplot(gs[1:, -1])
ax4 = fig.add_subplot(gs[-1, 0])
ax5 = fig.add_subplot(gs[-1, -2])

# Generate some data
x = np.linspace(0, 10, 100)
y1 = np.sin(x)
y2 = np.cos(x)
y3 = np.tan(x)
y4 = np.exp(x)
y5 = np.log(x)

# Plot data on each subplot
ax1.plot(x, y1)
ax1.set_title('Sine - how2matplotlib.com')

ax2.plot(x, y2)
ax2.set_title('Cosine - how2matplotlib.com')

ax3.plot(x, y3)
ax3.set_title('Tangent - how2matplotlib.com')

ax4.plot(x, y4)
ax4.set_title('Exponential - how2matplotlib.com')

ax5.plot(x, y5)
ax5.set_title('Logarithm - how2matplotlib.com')

plt.tight_layout()
plt.show()
Output:
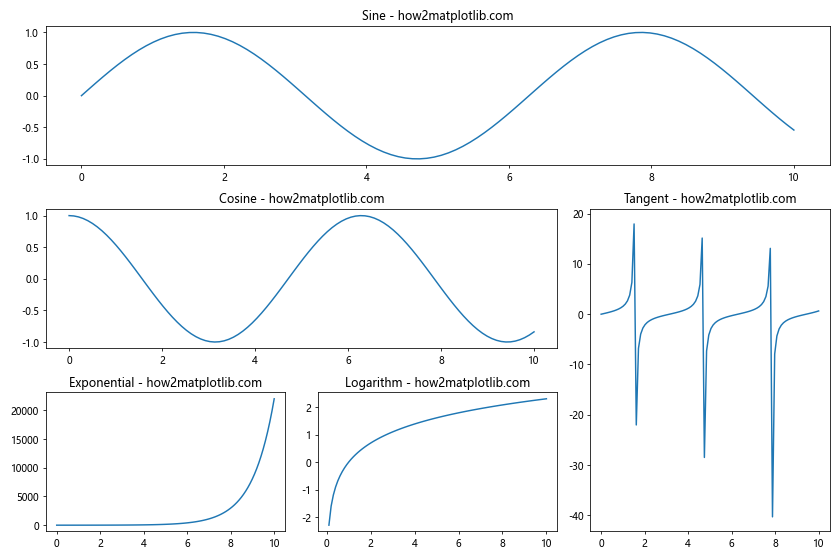
In this example, we use GridSpec to create an uneven layout of subplots. The gs object defines a 3×3 grid, and we use slicing to create subplots that span multiple cells in the grid.
Customizing Matplotlib Subplots
Matplotlib subplots offer various customization options to enhance the appearance and readability of your visualizations. Let’s explore some common customization techniques:
Adjusting Spacing between Matplotlib Subplots
import matplotlib.pyplot as plt
import numpy as np

# Create a figure with 2x2 subplots
fig, axs = plt.subplots(2, 2, figsize=(10, 8))

# Generate some data
x = np.linspace(0, 10, 100)
y1 = np.sin(x)
y2 = np.cos(x)
y3 = np.tan(x)
y4 = np.exp(x)

# Plot data on each subplot
axs[0, 0].plot(x, y1)
axs[0, 0].set_title('Sine - how2matplotlib.com')

axs[0, 1].plot(x, y2)
axs[0, 1].set_title('Cosine - how2matplotlib.com')

axs[1, 0].plot(x, y3)
axs[1, 0].set_title('Tangent - how2matplotlib.com')

axs[1, 1].plot(x, y4)
axs[1, 1].set_title('Exponential - how2matplotlib.com')

# Adjust spacing between subplots
plt.subplots_adjust(wspace=0.3, hspace=0.3)

plt.show()
Output:
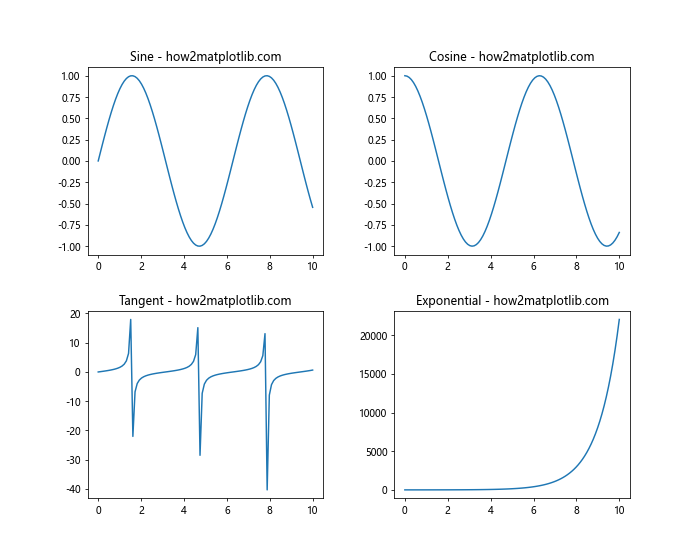
In this example, we use plt.subplots_adjust() to control the spacing between subplots. The wspace parameter adjusts the horizontal spacing, while hspace adjusts the vertical spacing.
Adding a Common Title to Matplotlib Subplots
import matplotlib.pyplot as plt
import numpy as np

# Create a figure with 2x2 subplots
fig, axs = plt.subplots(2, 2, figsize=(10, 8))

# Generate some data
x = np.linspace(0, 10, 100)
y1 = np.sin(x)
y2 = np.cos(x)
y3 = np.tan(x)
y4 = np.exp(x)

# Plot data on each subplot
axs[0, 0].plot(x, y1)
axs[0, 0].set_title('Sine - how2matplotlib.com')

axs[0, 1].plot(x, y2)
axs[0, 1].set_title('Cosine - how2matplotlib.com')

axs[1, 0].plot(x, y3)
axs[1, 0].set_title('Tangent - how2matplotlib.com')

axs[1, 1].plot(x, y4)
axs[1, 1].set_title('Exponential - how2matplotlib.com')

# Add a common title to the figure
fig.suptitle('Trigonometric and Exponential Functions', fontsize=16)

plt.tight_layout()
plt.show()
Output:
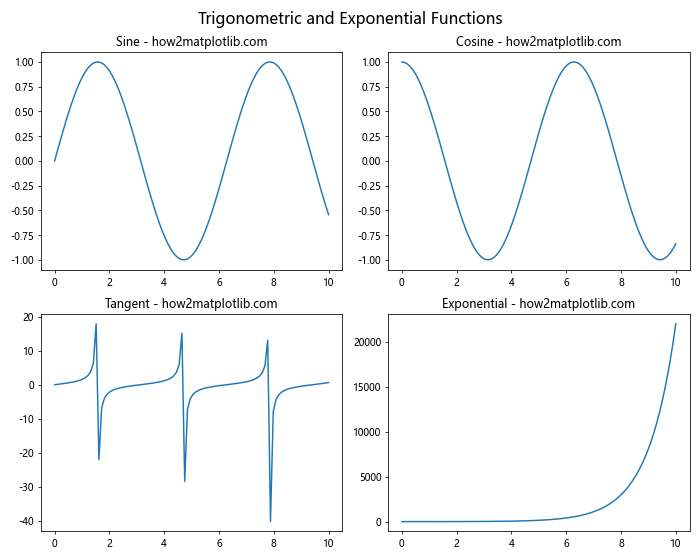
Here, we use fig.suptitle() to add a common title to the entire figure containing multiple subplots.
Sharing Axes in Matplotlib Subplots
Sharing axes between subplots can be useful when comparing data with the same scale. Matplotlib subplots provide options to share x-axes, y-axes, or both:
import matplotlib.pyplot as plt
import numpy as np

# Create a figure with 2x2 subplots, sharing x and y axes
fig, axs = plt.subplots(2, 2, figsize=(10, 8), sharex=True, sharey=True)

# Generate some data
x = np.linspace(0, 10, 100)
y1 = np.sin(x)
y2 = np.cos(x)
y3 = np.tan(x)
y4 = np.exp(x)

# Plot data on each subplot
axs[0, 0].plot(x, y1)
axs[0, 0].set_title('Sine - how2matplotlib.com')

axs[0, 1].plot(x, y2)
axs[0, 1].set_title('Cosine - how2matplotlib.com')

axs[1, 0].plot(x, y3)
axs[1, 0].set_title('Tangent - how2matplotlib.com')

axs[1, 1].plot(x, y4)
axs[1, 1].set_title('Exponential - how2matplotlib.com')

# Add labels to the shared axes
fig.text(0.5, 0.04, 'X-axis', ha='center')
fig.text(0.04, 0.5, 'Y-axis', va='center', rotation='vertical')

plt.tight_layout()
plt.show()
Output:
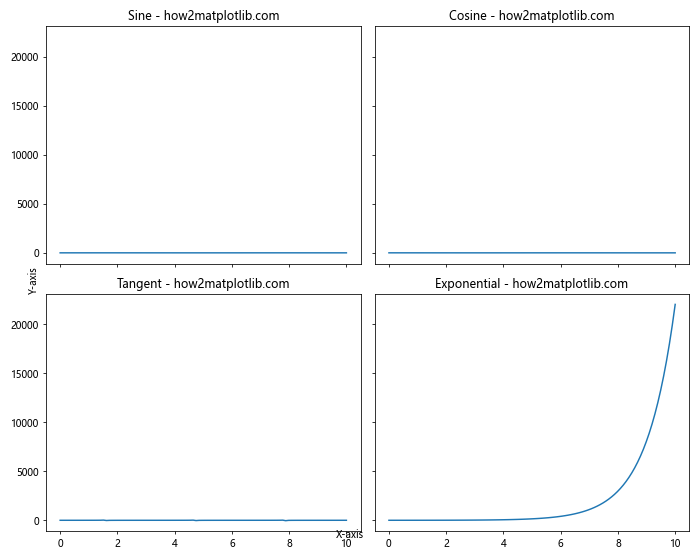
In this example, we set sharex=True and sharey=True when creating the subplots to share both x and y axes. We then use fig.text() to add labels to the shared axes.
Creating Matplotlib Subplots with Different Sizes
Matplotlib subplots allow you to create layouts with different subplot sizes. This can be useful when you want to emphasize certain plots or accommodate different types of visualizations:
import matplotlib.pyplot as plt
import numpy as np

# Create a figure with subplots of different sizes
fig = plt.figure(figsize=(12, 8))
gs = fig.add_gridspec(3, 3)

ax1 = fig.add_subplot(gs[0, :])
ax2 = fig.add_subplot(gs[1:, :-1])
ax3 = fig.add_subplot(gs[1:, -1])

# Generate some data
x = np.linspace(0, 10, 100)
y1 = np.sin(x)
y2 = np.cos(x)
y3 = np.tan(x)

# Plot data on each subplot
ax1.plot(x, y1)
ax1.set_title('Sine - how2matplotlib.com')

ax2.plot(x, y2)
ax2.set_title('Cosine - how2matplotlib.com')

ax3.plot(x, y3)
ax3.set_title('Tangent - how2matplotlib.com')

plt.tight_layout()
plt.show()
Output:
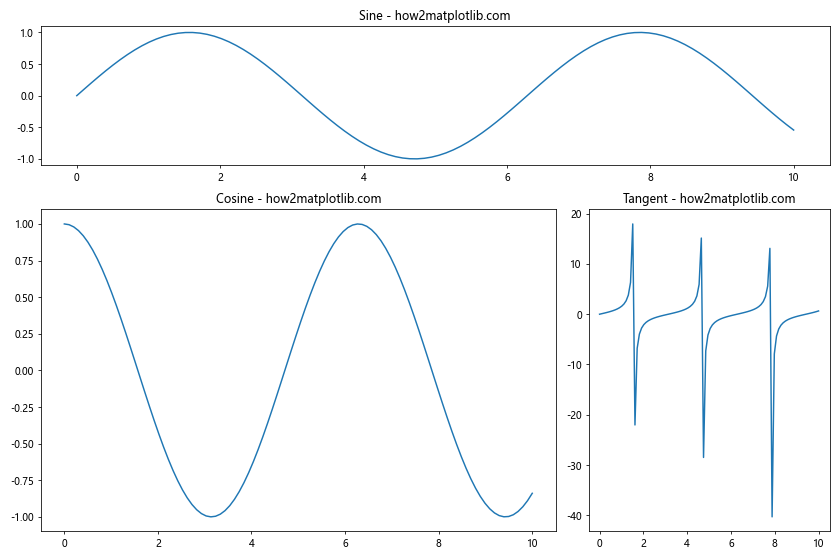
In this example, we use GridSpec to create subplots of different sizes. The first subplot spans the entire top row, the second subplot takes up the bottom-left 2×2 area, and the third subplot occupies the bottom-right column.
Adding Colorbars to Matplotlib Subplots
When working with color-mapped plots, adding colorbars to Matplotlib subplots can provide valuable information about the color scale:
import matplotlib.pyplot as plt
import numpy as np

# Create a figure with 2x2 subplots
fig, axs = plt.subplots(2, 2, figsize=(12, 10))

# Generate some data
x = np.linspace(-5, 5, 100)
y = np.linspace(-5, 5, 100)
X, Y = np.meshgrid(x, y)
Z1 = np.sin(np.sqrt(X**2 + Y**2))
Z2 = np.cos(np.sqrt(X**2 + Y**2))
Z3 = np.exp(-(X**2 + Y**2))
Z4 = np.log(X**2 + Y**2 + 1)

# Plot data on each subplot with colorbars
im1 = axs[0, 0].imshow(Z1, extent=[-5, 5, -5, 5], origin='lower', cmap='viridis')
axs[0, 0].set_title('Sine - how2matplotlib.com')
fig.colorbar(im1, ax=axs[0, 0])

im2 = axs[0, 1].imshow(Z2, extent=[-5, 5, -5, 5], origin='lower', cmap='plasma')
axs[0, 1].set_title('Cosine - how2matplotlib.com')
fig.colorbar(im2, ax=axs[0, 1])

im3 = axs[1, 0].imshow(Z3, extent=[-5, 5, -5, 5], origin='lower', cmap='inferno')
axs[1, 0].set_title('Exponential - how2matplotlib.com')
fig.colorbar(im3, ax=axs[1, 0])

im4 = axs[1, 1].imshow(Z4, extent=[-5, 5, -5, 5], origin='lower', cmap='magma')
axs[1, 1].set_title('Logarithm - how2matplotlib.com')
fig.colorbar(im4, ax=axs[1, 1])

plt.tight_layout()
plt.show()
Output:
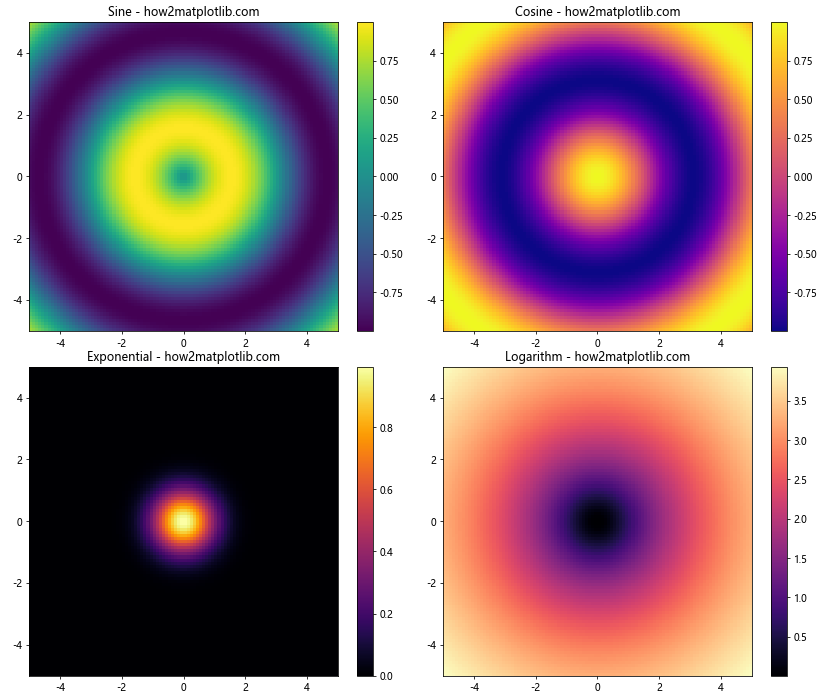
In this example, we create four different color-mapped plots using imshow(). We then add colorbars to each subplot using fig.colorbar(), specifying the corresponding Axes object for each colorbar.
Creating 3D Matplotlib Subplots
Matplotlib subplots also support 3D visualizations. Let’s create a figure with both 2D and 3D subplots:
import matplotlib.pyplot as plt
import numpy as np
from mpl_toolkits.mplot3d import Axes3D

# Create a figure with 2x2 subplots, including a 3D subplot
fig = plt.figure(figsize=(12, 10))

ax1 = fig.add_subplot(221)
ax2 = fig.add_subplot(222)
ax3 = fig.add_subplot(223)
ax4 = fig.add_subplot(224, projection='3d')

# Generate some data
x = np.linspace(-5, 5, 100)
y = np.linspace(-5, 5, 100)
X, Y = np.meshgrid(x, y)
Z = np.sin(np.sqrt(X**2 + Y**2))

# Plot data on each subplot
ax1.plot(x, np.sin(x))
ax1.set_title('Sine - how2matplotlib.com')

ax2.plot(x, np.cos(x))
ax2.set_title('Cosine - how2matplotlib.com')

ax3.imshow(Z, extent=[-5, 5, -5, 5], origin='lower', cmap='viridis')
ax3.set_title('2D Color Map - how2matplotlib.com')

ax4.plot_surface(X, Y, Z, cmap='viridis')
ax4.set_title('3D Surface - how2matplotlib.com')

plt.tight_layout()
plt.show()
Output:
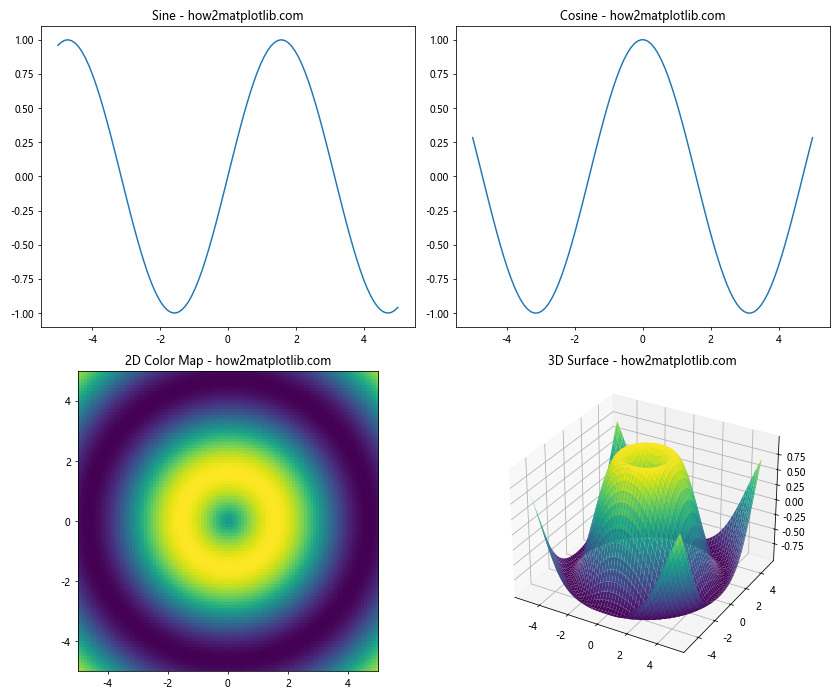
In this example, we create a 2×2 grid of subplots, with the last subplot being a 3D visualization. We use projection='3d' when creating the 3D subplot. This example demonstrates how Matplotlib subplots can accommodate both 2D and 3D visualizations within the same figure.
Animating Matplotlib Subplots
Matplotlib subplots can also be used to create animated visualizations. Here’s an example of how to create a simple animation using subplots:
import matplotlib.pyplot as plt
import numpy as np
from matplotlib.animation import FuncAnimation

# Create a figure with 2x2 subplots
fig, axs = plt.subplots(2, 2, figsize=(10, 8))
axs = axs.flatten()

# Generate initial data
x = np.linspace(0, 2*np.pi, 100)
lines = [ax.plot([], [])[0] for ax in axs]

# Initialize the plots
def init():
    for ax, line in zip(axs, lines):
        ax.set_xlim(0, 2*np.pi)
        ax.set_ylim(-1, 1)
        ax.set_title(f'Subplot - how2matplotlib.com')
    return lines

# Update function for the animation
def update(frame):
    for i, line in enumerate(lines):
        y = np.sin(x + frame * 0.1 + i * np.pi/2)
        line.set_data(x, y)
    return lines

# Create the animation
anim = FuncAnimation(fig, update, frames=100, init_func=init, blit=True)

plt.tight_layout()
plt.show()
Output:
In this example, we create an animation of four sine waves with different phase shifts. The FuncAnimation class is used to create the animation, with the update function defining how the plots change in each frame.
Handling Large Datasets with Matplotlib Subplots
When working with large datasets, it’s important to optimize your Matplotlib subplots for performance. Here’s an example of how to efficiently plot a large dataset using subplots:
import matplotlib.pyplot as plt
import numpy as np

# Create a figure with 2x2 subplots
fig, axs = plt.subplots(2, 2, figsize=(12, 10))
axs = axs.flatten()

# Generate a large dataset
n_points = 1000000
x = np.random.randn(n_points)
y = np.random.randn(n_points)

# Plot data on each subplot using different techniques
axs[0].plot(x[:1000], y[:1000], 'o', markersize=1, alpha=0.5)
axs[0].set_title('Scatter Plot (1000 points) - how2matplotlib.com')

axs[1].hexbin(x, y, gridsize=50, cmap='viridis')
axs[1].set_title('Hexbin Plot - how2matplotlib.com')

h, xedges, yedges = np.histogram2d(x, y, bins=100)
axs[2].imshow(h.T, origin='lower', extent=[xedges[0], xedges[-1], yedges[0], yedges[-1]],
              aspect='auto', cmap='viridis')
axs[2].set_title('2D Histogram - how2matplotlib.com')

axs[3].hist2d(x, y, bins=100, cmap='viridis')
axs[3].set_title('2D Histogram (hist2d) - how2matplotlib.com')

plt.tight_layout()
plt.show()
Output:
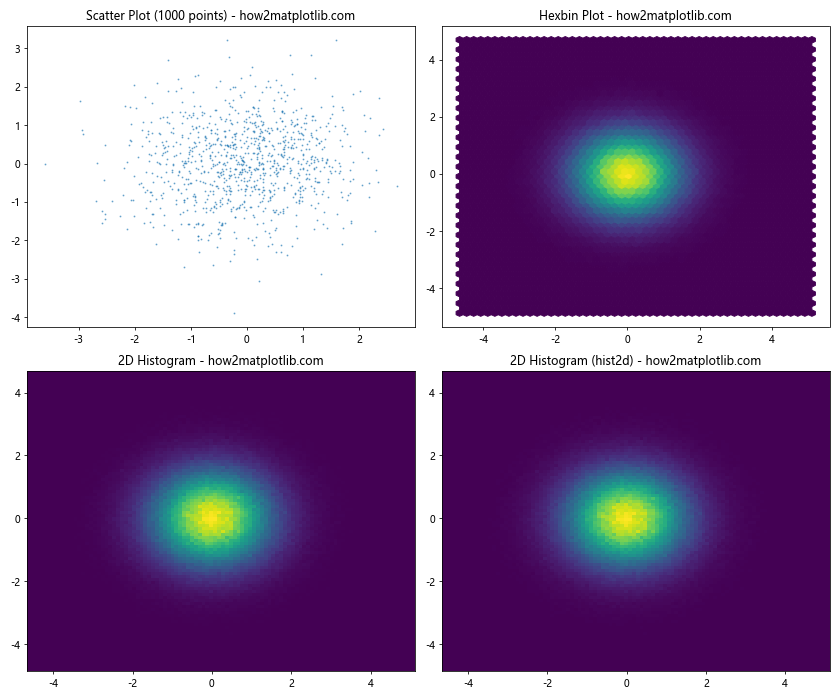
This example demonstrates different techniques for visualizing large datasets using Matplotlib subplots. We use scatter plots for a small subset of the data, hexbin plots for density visualization, and 2D histograms for efficient representation of large point clouds.
Customizing Tick Labels in Matplotlib Subplots
Customizing tick labels can greatly enhance the readability of your Matplotlib subplots. Here’s an example of how to customize tick labels:
import matplotlib.pyplot as plt
import numpy as np

# Create a figure with 2x2 subplots
fig, axs = plt.subplots(2, 2, figsize=(12, 10))
axs = axs.flatten()

# Generate some data
x = np.linspace(0, 10, 100)
y = np.sin(x)

# Plot data on each subplot with custom tick labels
axs[0].plot(x, y)
axs[0].set_title('Default Ticks - how2matplotlib.com')

axs[1].plot(x, y)
axs[1].set_title('Custom Tick Locations - how2matplotlib.com')
axs[1].set_xticks(np.arange(0, 11, 2))
axs[1].set_yticks(np.arange(-1, 1.1, 0.5))

axs[2].plot(x, y)
axs[2].set_title('Custom Tick Labels - how2matplotlib.com')
axs[2].set_xticks(np.arange(0, 11, 2))
axs[2].set_xticklabels(['Zero', 'Two', 'Four', 'Six', 'Eight', 'Ten'])

axs[3].plot(x, y)
axs[3].set_title('Rotated Tick Labels - how2matplotlib.com')
axs[3].set_xticks(np.arange(0, 11, 1))
axs[3].set_xticklabels(axs[3].get_xticks(), rotation=45, ha='right')

plt.tight_layout()
plt.show()
Output:
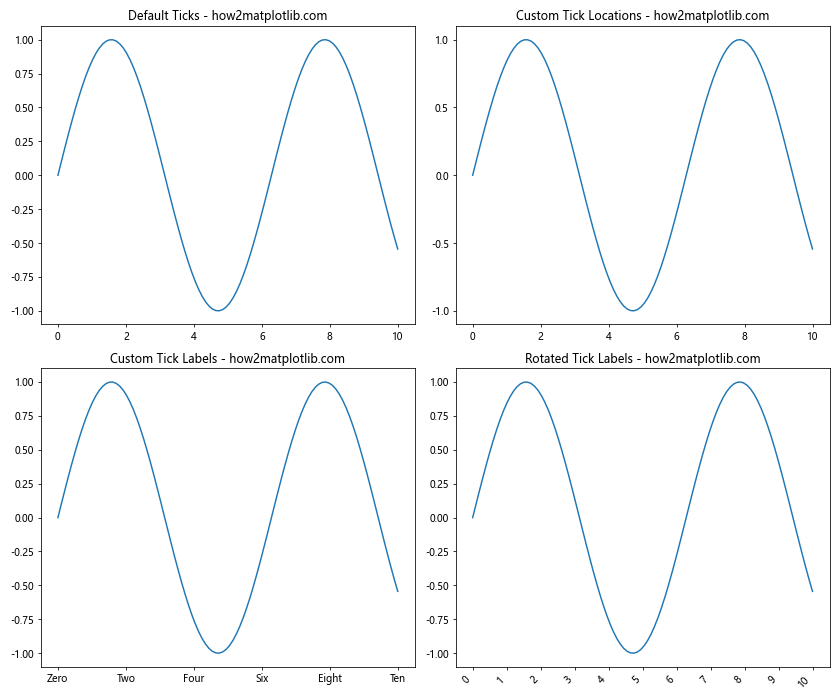
This example shows different ways to customize tick labels in Matplotlib subplots, including setting custom tick locations, using custom tick labels, and rotating tick labels for better readability.
Adding Annotations to Matplotlib Subplots
Annotations can provide additional context and information to your Matplotlib subplots. Here’s an example of how to add various types of annotations:
import matplotlib.pyplot as plt
import numpy as np

# Create a figure with 2x2 subplots
fig, axs = plt.subplots(2, 2, figsize=(12, 10))
axs = axs.flatten()

# Generate some data
x = np.linspace(0, 10, 100)
y = np.sin(x)

# Plot data on each subplot with different annotations
axs[0].plot(x, y)
axs[0].set_title('Text Annotation - how2matplotlib.com')
axs[0].annotate('Peak', xy=(np.pi/2, 1), xytext=(np.pi/2, 0.5),
                arrowprops=dict(facecolor='black', shrink=0.05))

axs[1].plot(x, y)
axs[1].set_title('Arrow Annotation - how2matplotlib.com')
axs[1].annotate('', xy=(np.pi, 0), xytext=(np.pi, 1),
                arrowprops=dict(facecolor='red', shrink=0.05))

axs[2].plot(x, y)
axs[2].set_title('Rectangle Annotation - how2matplotlib.com')
rect = plt.Rectangle((4, -0.5), 2, 1, fill=False, edgecolor='green')
axs[2].add_patch(rect)

axs[3].plot(x, y)
axs[3].set_title('Textbox Annotation - how2matplotlib.com')
axs[3].text(5, 0.5, 'Important\nRegion', bbox=dict(facecolor='yellow', alpha=0.5))

plt.tight_layout()
plt.show()
Output:
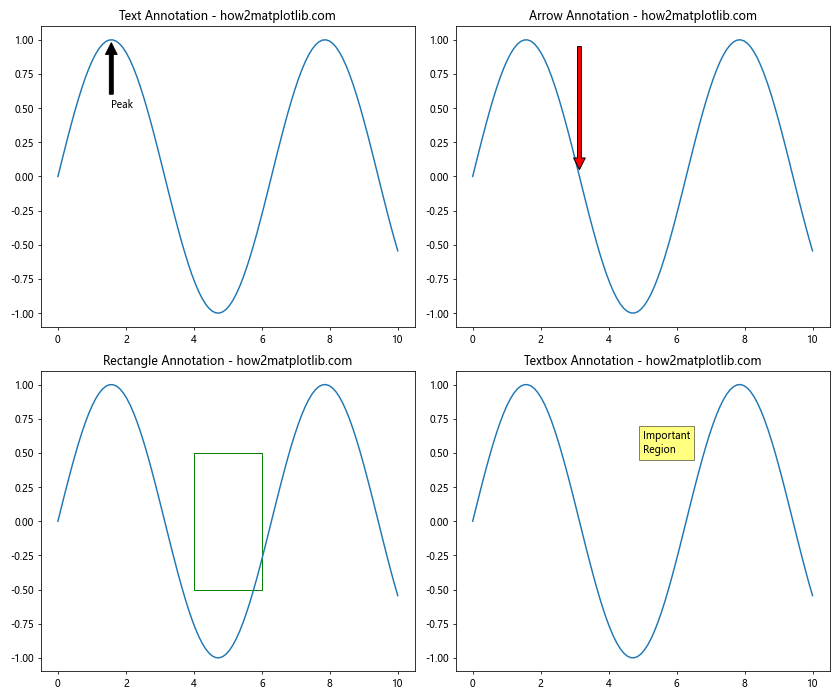
This example demonstrates various types of annotations that can be added to Matplotlib subplots, including text annotations with arrows, standalone arrows, rectangles, and text boxes.
Creating Inset Axes in Matplotlib Subplots
Inset axes allow you to create smaller plots within your main subplots, which can be useful for showing detailed views or additional information. Here’s an example:
import matplotlib.pyplot as plt
import numpy as np
from mpl_toolkits.axes_grid1.inset_locator import inset_axes

# Create a figure with 2x2 subplots
fig, axs = plt.subplots(2, 2, figsize=(12, 10))
axs = axs.flatten()

# Generate some data
x = np.linspace(0, 10, 1000)
y = np.sin(x) + 0.1 * np.random.randn(1000)

# Plot data on each subplot with inset axes
for ax in axs:
    ax.plot(x, y)
    ax.set_title('Main Plot with Inset - how2matplotlib.com')

    # Create inset axes
    axins = inset_axes(ax, width="40%", height="30%", loc=1)
    axins.plot(x, y)
    axins.set_xlim(4, 6)
    axins.set_ylim(-0.5, 0.5)
    axins.set_xticklabels([])
    axins.set_yticklabels([])
    ax.indicate_inset_zoom(axins, edgecolor="black")

plt.tight_layout()
plt.show()
Output:
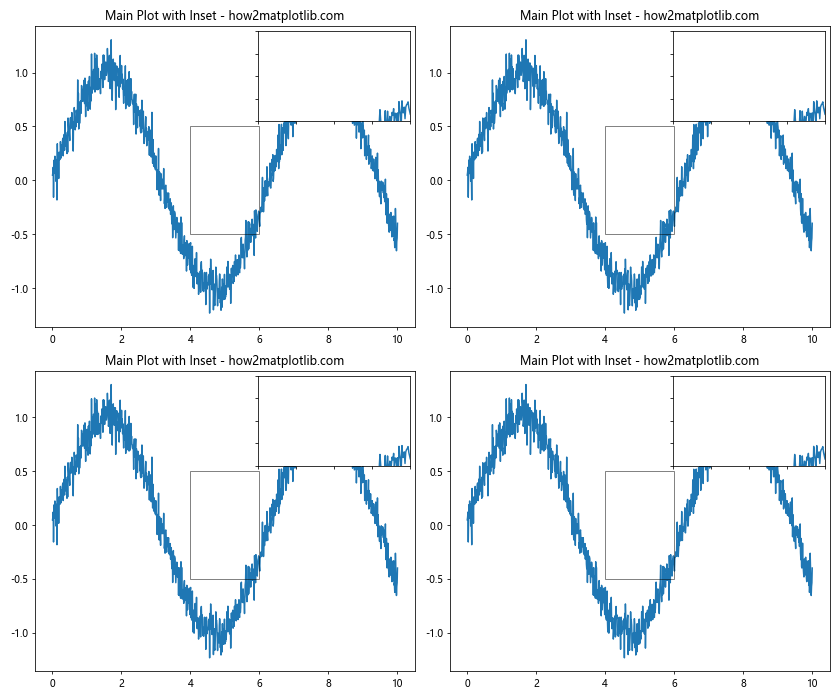
In this example, we create inset axes for each subplot to show a zoomed-in view of a specific region of the main plot. The inset_axes function is used to create the inset, and indicate_inset_zoom is used to draw connecting lines between the main plot and the inset.
Matplotlib Subplots Conclusion
Matplotlib subplots are a powerful tool for creating complex and informative visualizations. This comprehensive guide has covered various aspects of working with Matplotlib subplots, including:
- Creating basic subplots
- Customizing subplot layouts
- Sharing axes between subplots
- Adding colorbars and annotations
- Creating 3D subplots
- Animating subplots
- Handling large datasets
- Customizing tick labels
- Adding inset axes
By mastering these techniques, you can create sophisticated and professional-looking visualizations that effectively communicate your data and insights. Remember to experiment with different subplot configurations and customizations to find the best way to present your specific data and tell your story visually.
As you continue to work with Matplotlib subplots, you’ll discover even more ways to enhance your visualizations and create compelling data stories. The flexibility and power of Matplotlib subplots make them an invaluable tool for data scientists, researchers, and anyone working with data visualization in Python.