Comprehensive Guide to Using Matplotlib.figure.Figure.sca() in Python for Data Visualization
Matplotlib.figure.Figure.sca() in Python is a powerful method used in data visualization with Matplotlib. This function is essential for managing and manipulating subplots within a figure. In this comprehensive guide, we’ll explore the various aspects of Matplotlib.figure.Figure.sca(), its usage, and how it can enhance your data visualization projects.
Understanding Matplotlib.figure.Figure.sca() in Python
Matplotlib.figure.Figure.sca() is a method that belongs to the Figure class in Matplotlib. The primary purpose of this function is to set the current axes instance on a figure. When working with multiple subplots, Matplotlib.figure.Figure.sca() allows you to switch between different axes, making it easier to add content to specific subplots.
Let’s start with a basic example to illustrate the usage of Matplotlib.figure.Figure.sca():
import matplotlib.pyplot as plt

# Create a figure with two subplots
fig, (ax1, ax2) = plt.subplots(1, 2, figsize=(10, 5))

# Plot data on the first subplot
ax1.plot([1, 2, 3, 4], [1, 4, 2, 3], label='Data 1')
ax1.set_title('Subplot 1 - how2matplotlib.com')

# Use sca() to set the current axes to the second subplot
fig.sca(ax2)

# Plot data on the second subplot
plt.plot([1, 2, 3, 4], [4, 3, 2, 1], label='Data 2')
plt.title('Subplot 2 - how2matplotlib.com')

plt.tight_layout()
plt.show()
Output:
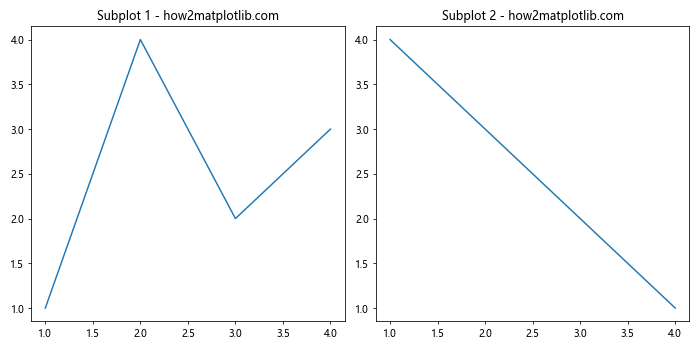
In this example, we create a figure with two subplots using plt.subplots(). We plot data on the first subplot using ax1.plot(). Then, we use fig.sca(ax2) to set the current axes to the second subplot. After that, we can use plt.plot() to add data to the second subplot without explicitly specifying the axes.
Benefits of Using Matplotlib.figure.Figure.sca() in Python
Matplotlib.figure.Figure.sca() offers several advantages when working with complex visualizations:
- Simplified subplot management
- Improved code readability
- Easier integration with existing Matplotlib functions
Let’s explore these benefits in more detail with another example:
import matplotlib.pyplot as plt
import numpy as np

# Create a figure with four subplots
fig, ((ax1, ax2), (ax3, ax4)) = plt.subplots(2, 2, figsize=(12, 10))

# Generate some data
x = np.linspace(0, 10, 100)
y1 = np.sin(x)
y2 = np.cos(x)
y3 = np.exp(-x/10)
y4 = x**2

# Plot data on each subplot using sca()
fig.sca(ax1)
plt.plot(x, y1, label='Sin(x)')
plt.title('Subplot 1: Sin(x) - how2matplotlib.com')
plt.legend()

fig.sca(ax2)
plt.plot(x, y2, label='Cos(x)')
plt.title('Subplot 2: Cos(x) - how2matplotlib.com')
plt.legend()

fig.sca(ax3)
plt.plot(x, y3, label='Exp(-x/10)')
plt.title('Subplot 3: Exp(-x/10) - how2matplotlib.com')
plt.legend()

fig.sca(ax4)
plt.plot(x, y4, label='x^2')
plt.title('Subplot 4: x^2 - how2matplotlib.com')
plt.legend()

plt.tight_layout()
plt.show()
Output:
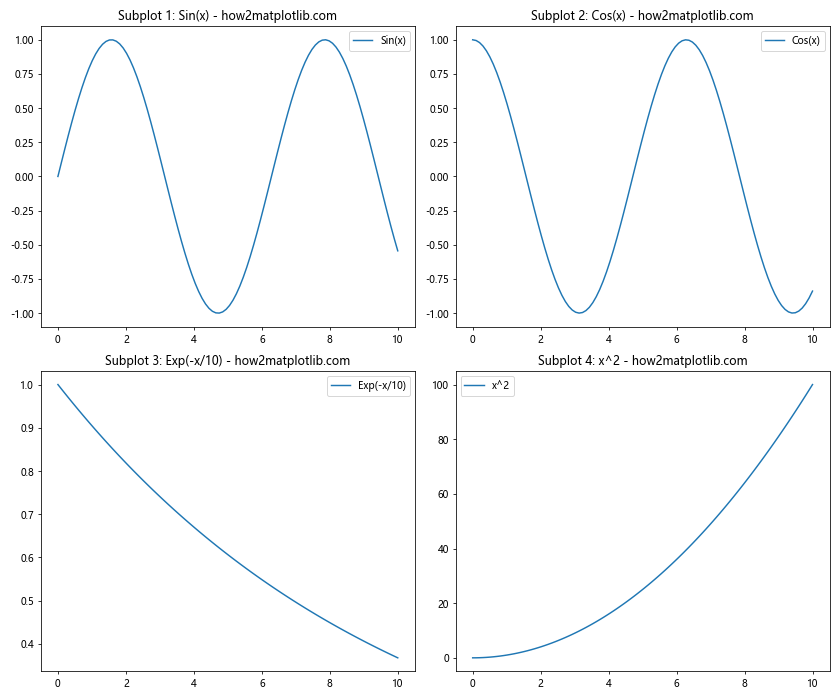
In this example, we create a figure with four subplots and use Matplotlib.figure.Figure.sca() to switch between them. This approach allows us to use familiar Matplotlib functions like plt.plot() and plt.title() without explicitly specifying the axes for each subplot.
Advanced Usage of Matplotlib.figure.Figure.sca() in Python
Matplotlib.figure.Figure.sca() can be particularly useful when working with more complex visualizations or when you need to dynamically update subplots. Let’s explore some advanced use cases:
1. Combining Different Plot Types
import matplotlib.pyplot as plt
import numpy as np

# Create a figure with three subplots
fig, (ax1, ax2, ax3) = plt.subplots(1, 3, figsize=(15, 5))

# Generate data
x = np.linspace(0, 10, 100)
y1 = np.sin(x)
y2 = np.random.rand(100)

# Line plot
fig.sca(ax1)
plt.plot(x, y1)
plt.title('Line Plot - how2matplotlib.com')

# Scatter plot
fig.sca(ax2)
plt.scatter(x, y2)
plt.title('Scatter Plot - how2matplotlib.com')

# Bar plot
fig.sca(ax3)
plt.bar(range(5), [2, 4, 6, 8, 10])
plt.title('Bar Plot - how2matplotlib.com')

plt.tight_layout()
plt.show()
Output:
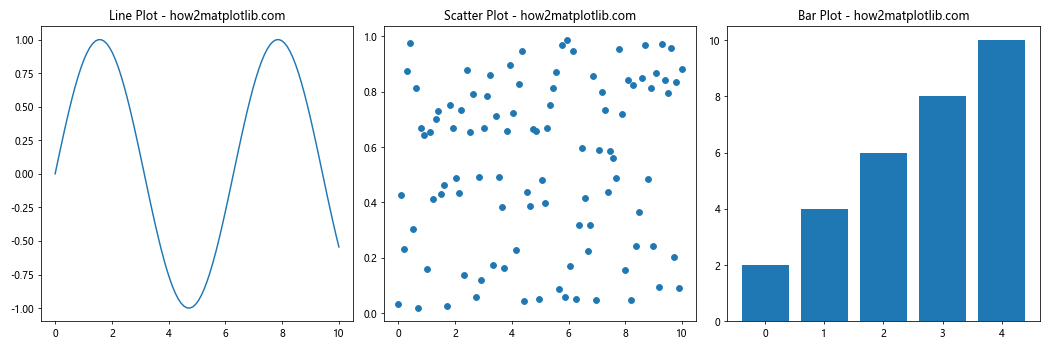
In this example, we use Matplotlib.figure.Figure.sca() to create three different types of plots in a single figure: a line plot, a scatter plot, and a bar plot.
2. Updating Subplots Dynamically
import matplotlib.pyplot as plt
import numpy as np

# Create a figure with two subplots
fig, (ax1, ax2) = plt.subplots(1, 2, figsize=(12, 5))

# Initialize empty lists for data
x_data = []
y_data1 = []
y_data2 = []

# Simulate real-time data updates
for i in range(50):
    x_data.append(i)
    y_data1.append(np.sin(i / 5))
    y_data2.append(np.cos(i / 5))

    # Update first subplot
    fig.sca(ax1)
    plt.cla()  # Clear the current axes
    plt.plot(x_data, y_data1)
    plt.title(f'Sin Plot (Step {i}) - how2matplotlib.com')

    # Update second subplot
    fig.sca(ax2)
    plt.cla()  # Clear the current axes
    plt.plot(x_data, y_data2)
    plt.title(f'Cos Plot (Step {i}) - how2matplotlib.com')

    plt.pause(0.1)  # Pause to create animation effect

plt.tight_layout()
plt.show()
Output:
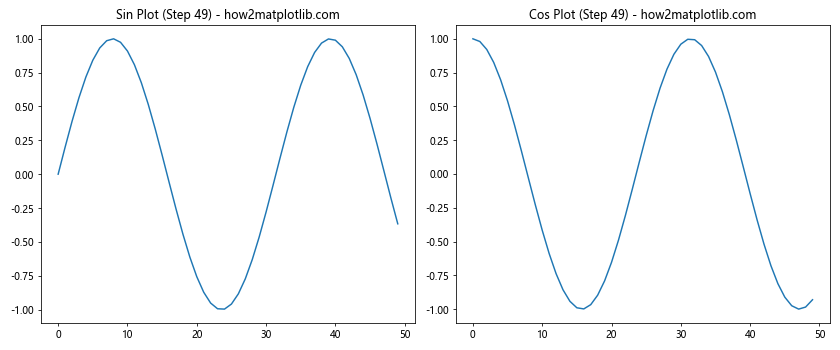
This example demonstrates how to use Matplotlib.figure.Figure.sca() to update subplots dynamically, simulating real-time data updates.
Best Practices for Using Matplotlib.figure.Figure.sca() in Python
When working with Matplotlib.figure.Figure.sca(), consider the following best practices:
- Always call
plt.figure()orplt.subplots()before usingsca(). - Use
sca()in conjunction with other Matplotlib functions for consistent behavior. - Clear the current axes using
plt.cla()when updating plots dynamically. - Use
plt.tight_layout()to adjust subplot parameters for better spacing.
Let’s see an example that incorporates these best practices:
import matplotlib.pyplot as plt
import numpy as np

# Create a figure with four subplots
fig, axes = plt.subplots(2, 2, figsize=(12, 10))

# Flatten the axes array for easier iteration
axes = axes.flatten()

# Generate data
x = np.linspace(0, 10, 100)
y_funcs = [np.sin, np.cos, np.tan, np.exp]

# Plot data on each subplot
for i, (ax, func) in enumerate(zip(axes, y_funcs)):
    fig.sca(ax)
    plt.cla()  # Clear the current axes
    plt.plot(x, func(x))
    plt.title(f'{func.__name__}(x) - how2matplotlib.com')
    plt.xlabel('x')
    plt.ylabel('y')

plt.tight_layout()
plt.show()
Output:
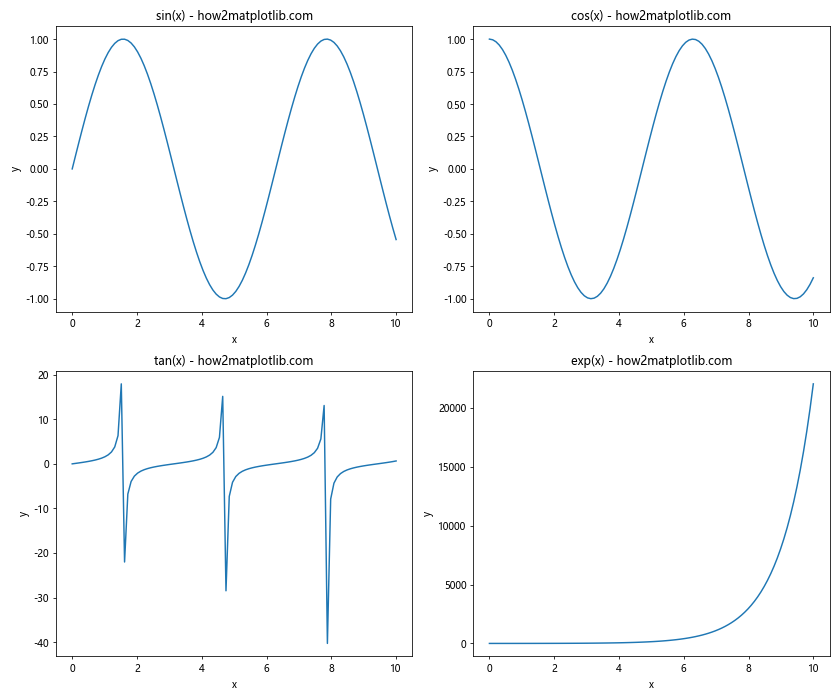
This example demonstrates how to use Matplotlib.figure.Figure.sca() with best practices, including clearing axes and using tight_layout() for better spacing.
Common Pitfalls and How to Avoid Them
When using Matplotlib.figure.Figure.sca(), there are some common pitfalls to be aware of:
- Forgetting to create a figure before using
sca(). - Using
sca()with the wrong figure object. - Not clearing the axes when updating plots.
Let’s look at an example that demonstrates these pitfalls and how to avoid them:
import matplotlib.pyplot as plt
import numpy as np

# Correct usage
fig1, ax1 = plt.subplots()
fig1.sca(ax1)
plt.plot([1, 2, 3], [1, 2, 3])
plt.title('Correct Usage - how2matplotlib.com')

# Incorrect usage (forgetting to create a figure)
# plt.sca(ax1)  # This would raise an error

# Incorrect usage (using sca() with the wrong figure)
fig2, ax2 = plt.subplots()
# fig1.sca(ax2)  # This would not work as expected

# Correct usage when updating plots
fig3, ax3 = plt.subplots()
for i in range(5):
    fig3.sca(ax3)
    plt.cla()  # Clear the axes before updating
    plt.plot(np.random.rand(10))
    plt.title(f'Updated Plot {i} - how2matplotlib.com')
    plt.pause(0.5)

plt.show()
Output:
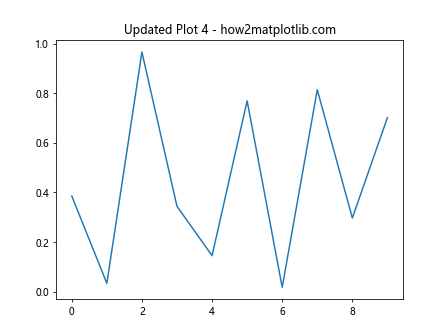
This example illustrates common pitfalls and how to avoid them when using Matplotlib.figure.Figure.sca().
Integrating Matplotlib.figure.Figure.sca() with Other Matplotlib Features
Matplotlib.figure.Figure.sca() can be seamlessly integrated with other Matplotlib features to create more complex and informative visualizations. Let’s explore some examples:
1. Combining sca() with Subplots and GridSpec
import matplotlib.pyplot as plt
import matplotlib.gridspec as gridspec
import numpy as np

# Create a figure with a custom layout using GridSpec
fig = plt.figure(figsize=(12, 8))
gs = gridspec.GridSpec(2, 3)

# Create subplots with different sizes
ax1 = fig.add_subplot(gs[0, :2])
ax2 = fig.add_subplot(gs[0, 2])
ax3 = fig.add_subplot(gs[1, :])

# Generate data
x = np.linspace(0, 10, 100)
y1 = np.sin(x)
y2 = np.cos(x)
y3 = np.tan(x)

# Plot data using sca()
fig.sca(ax1)
plt.plot(x, y1)
plt.title('Sin(x) - how2matplotlib.com')

fig.sca(ax2)
plt.scatter(x, y2)
plt.title('Cos(x) - how2matplotlib.com')

fig.sca(ax3)
plt.plot(x, y3)
plt.title('Tan(x) - how2matplotlib.com')

plt.tight_layout()
plt.show()
Output:
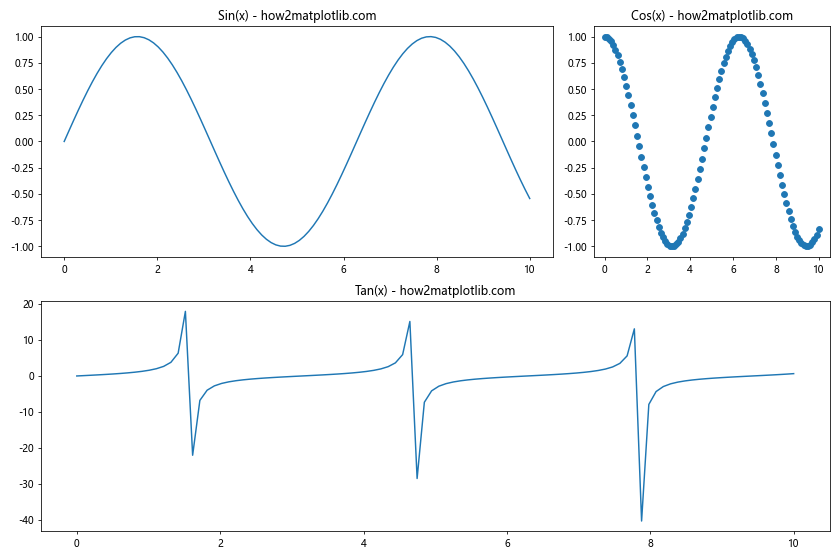
This example demonstrates how to use Matplotlib.figure.Figure.sca() with GridSpec to create a custom layout of subplots.
2. Using sca() with 3D Plots
import matplotlib.pyplot as plt
from mpl_toolkits.mplot3d import Axes3D
import numpy as np

# Create a figure with two 3D subplots
fig = plt.figure(figsize=(12, 6))
ax1 = fig.add_subplot(121, projection='3d')
ax2 = fig.add_subplot(122, projection='3d')

# Generate data
x = np.linspace(-5, 5, 50)
y = np.linspace(-5, 5, 50)
X, Y = np.meshgrid(x, y)
Z1 = np.sin(np.sqrt(X**2 + Y**2))
Z2 = np.cos(np.sqrt(X**2 + Y**2))

# Plot 3D surfaces using sca()
fig.sca(ax1)
surf1 = ax1.plot_surface(X, Y, Z1, cmap='viridis')
plt.title('3D Sin Surface - how2matplotlib.com')

fig.sca(ax2)
surf2 = ax2.plot_surface(X, Y, Z2, cmap='plasma')
plt.title('3D Cos Surface - how2matplotlib.com')

plt.tight_layout()
plt.show()
Output:
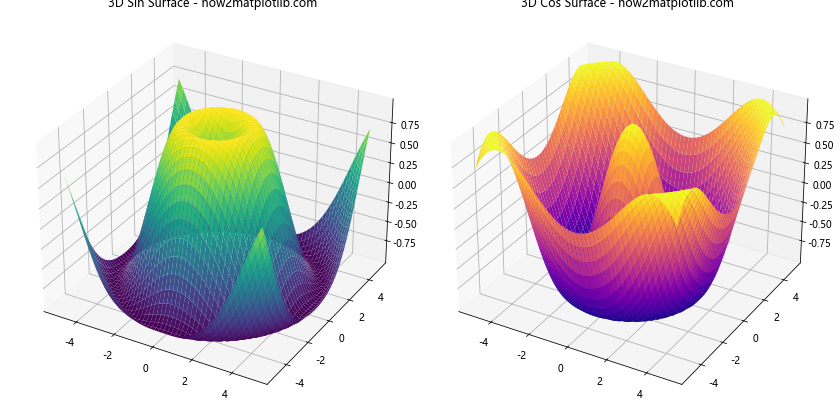
This example shows how to use Matplotlib.figure.Figure.sca() with 3D plots to create multiple 3D surfaces in a single figure.
Advanced Techniques with Matplotlib.figure.Figure.sca()
Let’s explore some advanced techniques that leverage Matplotlib.figure.Figure.sca() for more complex visualizations:
1. Creating an Interactive Plot Selector
import matplotlib.pyplot as plt
import numpy as np

# Create a figure with multiple subplots
fig, axes = plt.subplots(2, 2, figsize=(12, 10))
axes = axes.flatten()

# Generate data
x = np.linspace(0, 10, 100)
y_funcs = [np.sin, np.cos, np.exp, np.log]

# Plot data on each subplot
for ax, func in zip(axes, y_funcs):
    ax.plot(x, func(x))
    ax.set_title(f'{func.__name__}(x) - how2matplotlib.com')

# Function to handle subplot selection
def on_click(event):
    if event.inaxes in axes:
        fig.sca(event.inaxes)
        plt.title(f'Selected: {event.inaxes.get_title()}', color='red')
        fig.canvas.draw()

# Connect the click event to the figure
fig.canvas.mpl_connect('button_press_event', on_click)

plt.tight_layout()
plt.show()
Output:
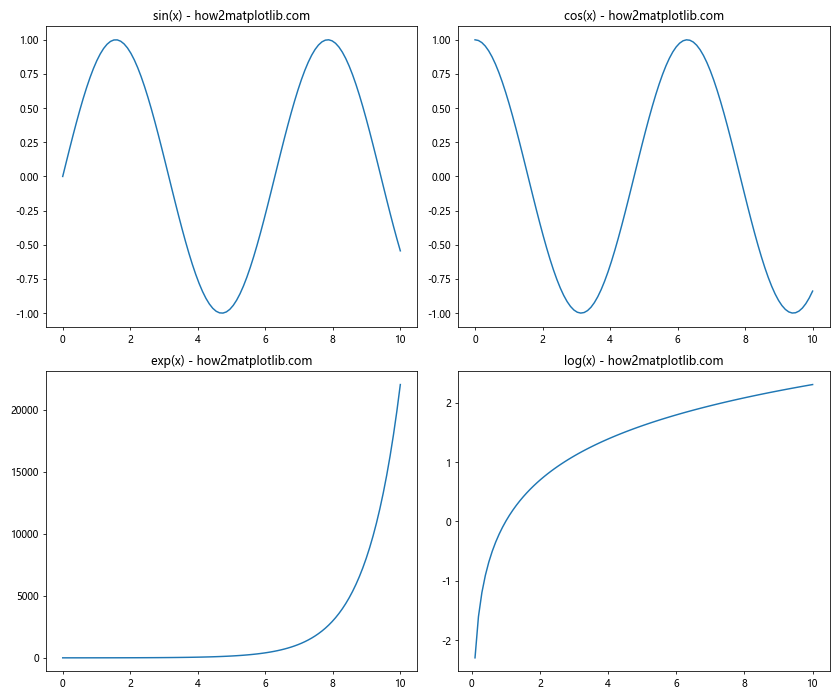
This example creates an interactive plot where clicking on a subplot highlights its title, demonstrating how Matplotlib.figure.Figure.sca() can be used in event-driven programming.
2. Creating a Custom Animation with sca()
import matplotlib.pyplot as plt
import numpy as np
from matplotlib.animation import FuncAnimation

# Create a figure with two subplots
fig, (ax1, ax2) = plt.subplots(1, 2, figsize=(12, 5))

# Initialize empty plots
line1, = ax1.plot([], [])
line2, = ax2.plot([], [])

ax1.set_xlim(0, 2*np.pi)
ax1.set_ylim(-1, 1)
ax2.set_xlim(0, 2*np.pi)
ax2.set_ylim(-1, 1)

# Animation update function
def update(frame):
    x = np.linspace(0, 2*np.pi, 100)
    y1 = np.sin(x + frame/10)
    y2 = np.cos(x + frame/10)

    fig.sca(ax1)
    line1.set_data(x, y1)
    plt.title(f'Sin Wave (Frame {frame}) - how2matplotlib.com')

    fig.sca(ax2)
    line2.set_data(x, y2)plt.title(f'Cos Wave (Frame {frame}) - how2matplotlib.com')

    return line1, line2

# Create the animation
anim = FuncAnimation(fig, update, frames=100, interval=50, blit=True)

plt.tight_layout()
plt.show()
This example demonstrates how to use Matplotlib.figure.Figure.sca() in conjunction with FuncAnimation to create a custom animation with multiple subplots.
Optimizing Performance with Matplotlib.figure.Figure.sca()
When working with large datasets or creating complex visualizations, it’s important to optimize performance. Here are some tips for using Matplotlib.figure.Figure.sca() efficiently:
- Minimize the number of times you call
sca()by grouping operations for each subplot. - Use
blittingwhen creating animations to improve performance. - Consider using
plt.ion()for interactive plotting when appropriate.
Let’s look at an example that incorporates these optimization techniques:
import matplotlib.pyplot as plt
import numpy as np

# Enable interactive mode
plt.ion()

# Create a figure with multiple subplots
fig, axes = plt.subplots(2, 2, figsize=(12, 10))
axes = axes.flatten()

# Generate data
x = np.linspace(0, 10, 1000)
y_funcs = [np.sin, np.cos, np.exp, np.log]

# Plot data on each subplot efficiently
for ax, func in zip(axes, y_funcs):
    fig.sca(ax)
    line, = plt.plot([], [])
    ax.set_xlim(0, 10)
    ax.set_ylim(func(x).min(), func(x).max())
    ax.set_title(f'{func.__name__}(x) - how2matplotlib.com')

# Update function for efficient animation
def update():
    for ax, func in zip(axes, y_funcs):
        fig.sca(ax)
        line = ax.get_lines()[0]
        line.set_data(x, func(x + np.random.rand()))
    fig.canvas.draw_idle()
    fig.canvas.flush_events()

# Animate the plots
for _ in range(100):
    update()
    plt.pause(0.1)

plt.ioff()
plt.show()
This example demonstrates how to use Matplotlib.figure.Figure.sca() efficiently with interactive mode and optimized updating of multiple subplots.
Troubleshooting Common Issues with Matplotlib.figure.Figure.sca()
When working with Matplotlib.figure.Figure.sca(), you may encounter some common issues. Here are some troubleshooting tips:
- Issue:
AttributeError: 'Figure' object has no attribute 'sca'Solution: Ensure you’re using a recent version of Matplotlib. If the issue persists, try usingplt.sca()instead offig.sca(). Issue: Plots not updating when using
sca()Solution: Make sure to callplt.draw()orfig.canvas.draw()after making changes to the plot.Issue: Unexpected behavior when switching between subplots Solution: Clear the current axes using
plt.cla()before plotting new data.
Let’s look at an example that addresses these common issues: