Comprehensive Guide to Using Matplotlib.figure.Figure.align_xlabels() in Python for Data Visualization
Matplotlib.figure.Figure.align_xlabels() in Python is a powerful method that allows you to align x-axis labels across multiple subplots within a figure. This function is particularly useful when working with complex visualizations that involve multiple subplots with varying scales or ranges. By using Matplotlib.figure.Figure.align_xlabels(), you can ensure that your x-axis labels are neatly aligned, creating a more professional and visually appealing presentation of your data.
In this comprehensive guide, we’ll explore the various aspects of Matplotlib.figure.Figure.align_xlabels() in Python, including its syntax, parameters, and practical applications. We’ll also provide numerous examples to illustrate how this method can be used effectively in different scenarios.
Understanding Matplotlib.figure.Figure.align_xlabels() in Python
Matplotlib.figure.Figure.align_xlabels() is a method that belongs to the Figure class in Matplotlib. Its primary purpose is to align the x-axis labels of multiple subplots within a figure. This alignment is particularly useful when you have subplots with different scales or ranges, as it helps maintain a consistent visual appearance across all subplots.
The basic syntax for using Matplotlib.figure.Figure.align_xlabels() in Python is as follows:
fig.align_xlabels(axs=None)
Here, fig is an instance of the Figure class, and axs is an optional parameter that specifies the axes to be aligned. If axs is not provided, the method will align all axes in the figure.
Let’s look at a simple example to demonstrate how Matplotlib.figure.Figure.align_xlabels() works:
import matplotlib.pyplot as plt
import numpy as np

fig, (ax1, ax2) = plt.subplots(2, 1, figsize=(8, 6))

x = np.linspace(0, 10, 100)
y1 = np.sin(x)
y2 = np.cos(x)

ax1.plot(x, y1, label='Sin(x)')
ax1.set_title('Sine Wave - how2matplotlib.com')
ax1.legend()

ax2.plot(x, y2, label='Cos(x)')
ax2.set_title('Cosine Wave - how2matplotlib.com')
ax2.legend()

fig.align_xlabels()

plt.tight_layout()
plt.show()
Output:
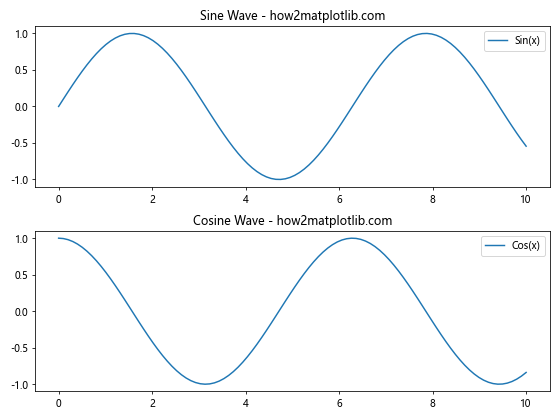
In this example, we create two subplots with sine and cosine waves. By calling fig.align_xlabels(), we ensure that the x-axis labels of both subplots are aligned vertically.
Benefits of Using Matplotlib.figure.Figure.align_xlabels() in Python
There are several advantages to using Matplotlib.figure.Figure.align_xlabels() in your Python data visualization projects:
- Improved readability: Aligned x-axis labels make it easier for viewers to compare data across multiple subplots.
- Professional appearance: Consistent alignment gives your visualizations a polished look.
- Flexibility: You can choose to align specific axes or all axes in a figure.
- Compatibility: Works well with various types of plots and subplots.
Advanced Usage of Matplotlib.figure.Figure.align_xlabels() in Python
While the basic usage of Matplotlib.figure.Figure.align_xlabels() is straightforward, there are several advanced techniques you can employ to enhance your visualizations further. Let’s explore some of these techniques:
Aligning Specific Axes
Sometimes, you may want to align only specific axes within a figure. Matplotlib.figure.Figure.align_xlabels() allows you to do this by passing a list or array of axes objects to the axs parameter. Here’s an example:
import matplotlib.pyplot as plt
import numpy as np

fig, ((ax1, ax2), (ax3, ax4)) = plt.subplots(2, 2, figsize=(10, 8))

x = np.linspace(0, 10, 100)
y1 = np.sin(x)
y2 = np.cos(x)
y3 = np.tan(x)
y4 = np.exp(x)

ax1.plot(x, y1, label='Sin(x)')
ax1.set_title('Sine Wave - how2matplotlib.com')
ax1.legend()

ax2.plot(x, y2, label='Cos(x)')
ax2.set_title('Cosine Wave - how2matplotlib.com')
ax2.legend()

ax3.plot(x, y3, label='Tan(x)')
ax3.set_title('Tangent Wave - how2matplotlib.com')
ax3.legend()

ax4.plot(x, y4, label='Exp(x)')
ax4.set_title('Exponential Function - how2matplotlib.com')
ax4.legend()

fig.align_xlabels([ax1, ax3])  # Align only ax1 and ax3

plt.tight_layout()
plt.show()
Output:
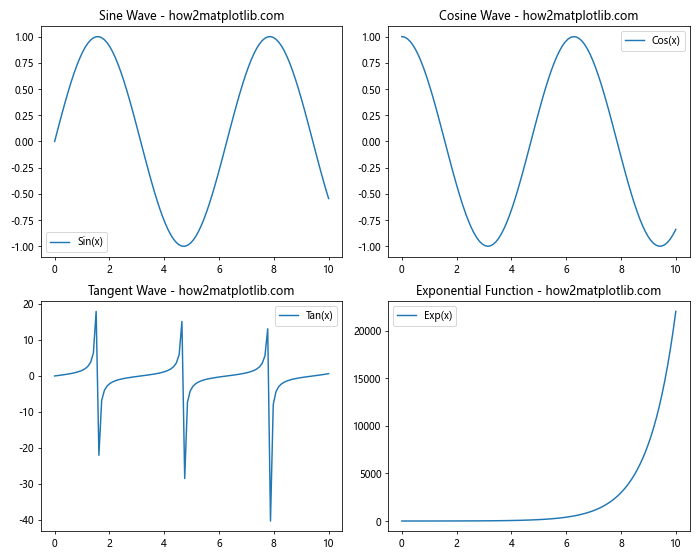
In this example, we create four subplots but only align the x-axis labels of ax1 and ax3 using Matplotlib.figure.Figure.align_xlabels().
Combining with Other Alignment Methods
Matplotlib.figure.Figure.align_xlabels() can be used in conjunction with other alignment methods to create perfectly aligned visualizations. For instance, you can combine it with align_ylabels() to align both x and y-axis labels:
import matplotlib.pyplot as plt
import numpy as np

fig, (ax1, ax2) = plt.subplots(1, 2, figsize=(12, 5))

x = np.linspace(0, 10, 100)
y1 = np.sin(x)
y2 = np.cos(x)

ax1.plot(x, y1, label='Sin(x)')
ax1.set_title('Sine Wave - how2matplotlib.com')
ax1.legend()

ax2.plot(x, y2, label='Cos(x)')
ax2.set_title('Cosine Wave - how2matplotlib.com')
ax2.legend()

fig.align_xlabels()
fig.align_ylabels()

plt.tight_layout()
plt.show()
Output:
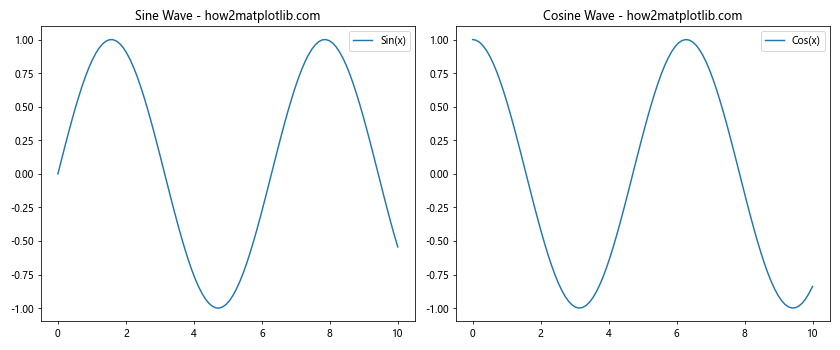
This example demonstrates how to use both Matplotlib.figure.Figure.align_xlabels() and align_ylabels() to create a perfectly aligned figure with two subplots.
Handling Different Subplot Layouts with Matplotlib.figure.Figure.align_xlabels() in Python
Matplotlib.figure.Figure.align_xlabels() is versatile enough to handle various subplot layouts. Let’s explore how to use this method with different arrangements of subplots:
Grid Layout
When working with a grid layout of subplots, Matplotlib.figure.Figure.align_xlabels() can align the x-axis labels across all rows:
import matplotlib.pyplot as plt
import numpy as np

fig, axs = plt.subplots(3, 3, figsize=(12, 12))

x = np.linspace(0, 10, 100)

for i in range(3):
    for j in range(3):
        axs[i, j].plot(x, np.sin(x + i + j))
        axs[i, j].set_title(f'Sin(x + {i} + {j}) - how2matplotlib.com')

fig.align_xlabels()

plt.tight_layout()
plt.show()
Output:
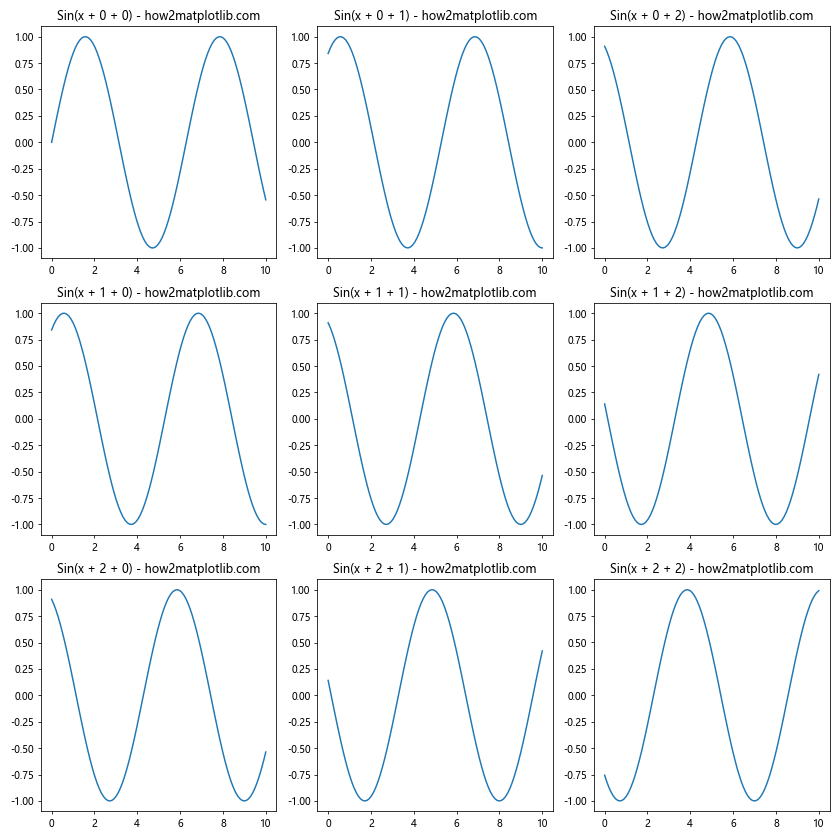
In this example, we create a 3×3 grid of subplots, each displaying a slightly different sine wave. Matplotlib.figure.Figure.align_xlabels() ensures that the x-axis labels are aligned across all rows.
Irregular Layouts
Matplotlib.figure.Figure.align_xlabels() can also handle irregular subplot layouts. Here’s an example with subplots of different sizes:
import matplotlib.pyplot as plt
import numpy as np

fig = plt.figure(figsize=(12, 8))

gs = fig.add_gridspec(3, 3)
ax1 = fig.add_subplot(gs[0, :])
ax2 = fig.add_subplot(gs[1, :-1])
ax3 = fig.add_subplot(gs[1:, -1])
ax4 = fig.add_subplot(gs[-1, 0])
ax5 = fig.add_subplot(gs[-1, -2])

x = np.linspace(0, 10, 100)

ax1.plot(x, np.sin(x))
ax1.set_title('Sine Wave - how2matplotlib.com')

ax2.plot(x, np.cos(x))
ax2.set_title('Cosine Wave - how2matplotlib.com')

ax3.plot(x, np.tan(x))
ax3.set_title('Tangent Wave - how2matplotlib.com')

ax4.plot(x, np.exp(x))
ax4.set_title('Exponential Function - how2matplotlib.com')

ax5.plot(x, np.log(x))
ax5.set_title('Logarithmic Function - how2matplotlib.com')

fig.align_xlabels()

plt.tight_layout()
plt.show()
Output:
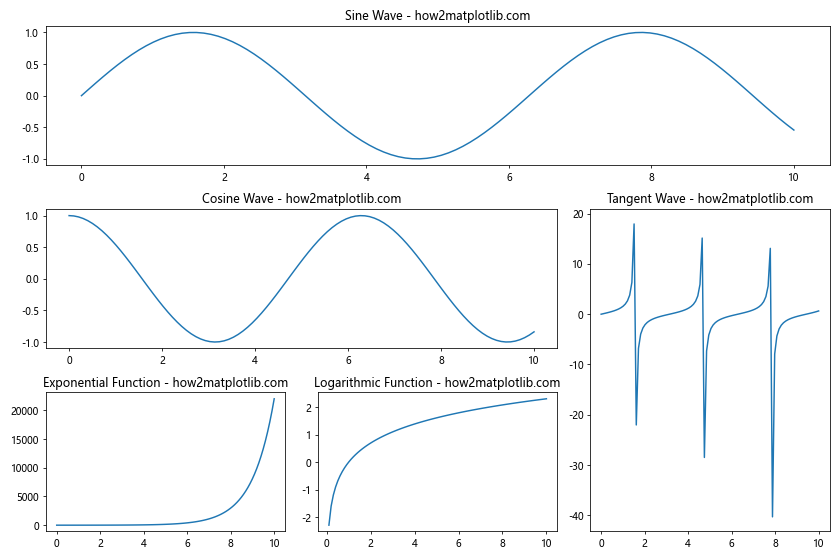
This example demonstrates how Matplotlib.figure.Figure.align_xlabels() can handle an irregular layout of subplots with varying sizes and positions.
Customizing X-axis Labels with Matplotlib.figure.Figure.align_xlabels() in Python
While Matplotlib.figure.Figure.align_xlabels() primarily focuses on alignment, you can combine it with other Matplotlib functions to customize the appearance of your x-axis labels. Here are some techniques:
Rotating X-axis Labels
Sometimes, you may need to rotate x-axis labels for better readability. You can do this before calling Matplotlib.figure.Figure.align_xlabels():
import matplotlib.pyplot as plt
import numpy as np

fig, (ax1, ax2) = plt.subplots(2, 1, figsize=(8, 10))

x = np.arange(0, 10, 0.5)
y1 = np.sin(x)
y2 = np.cos(x)

ax1.bar(x, y1)
ax1.set_title('Sine Wave Bar Plot - how2matplotlib.com')

ax2.bar(x, y2)
ax2.set_title('Cosine Wave Bar Plot - how2matplotlib.com')

for ax in (ax1, ax2):
    ax.set_xticklabels(ax.get_xticklabels(), rotation=45, ha='right')

fig.align_xlabels()

plt.tight_layout()
plt.show()
Output:
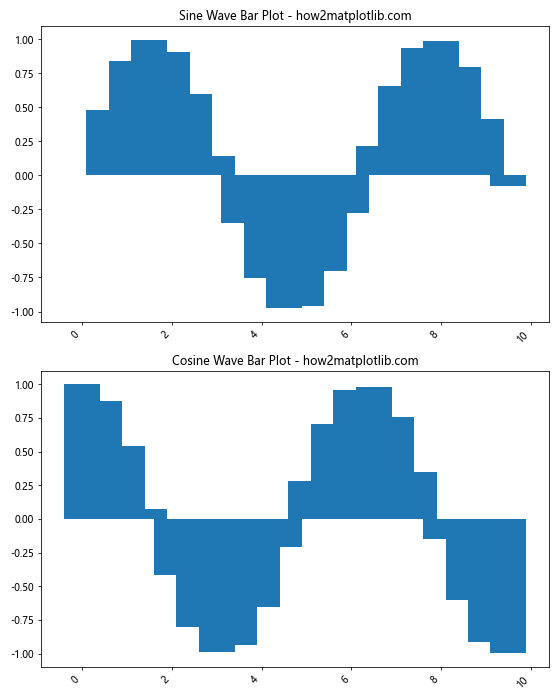
In this example, we rotate the x-axis labels by 45 degrees before applying Matplotlib.figure.Figure.align_xlabels().
Customizing Label Font and Style
You can also customize the font and style of your x-axis labels while using Matplotlib.figure.Figure.align_xlabels():
import matplotlib.pyplot as plt
import numpy as np

fig, (ax1, ax2) = plt.subplots(2, 1, figsize=(8, 10))

x = np.linspace(0, 10, 100)
y1 = np.sin(x)
y2 = np.cos(x)

ax1.plot(x, y1)
ax1.set_title('Sine Wave - how2matplotlib.com')

ax2.plot(x, y2)
ax2.set_title('Cosine Wave - how2matplotlib.com')

for ax in (ax1, ax2):
    ax.set_xticklabels(ax.get_xticklabels(), fontsize=12, fontweight='bold', color='navy')

fig.align_xlabels()

plt.tight_layout()
plt.show()
Output:
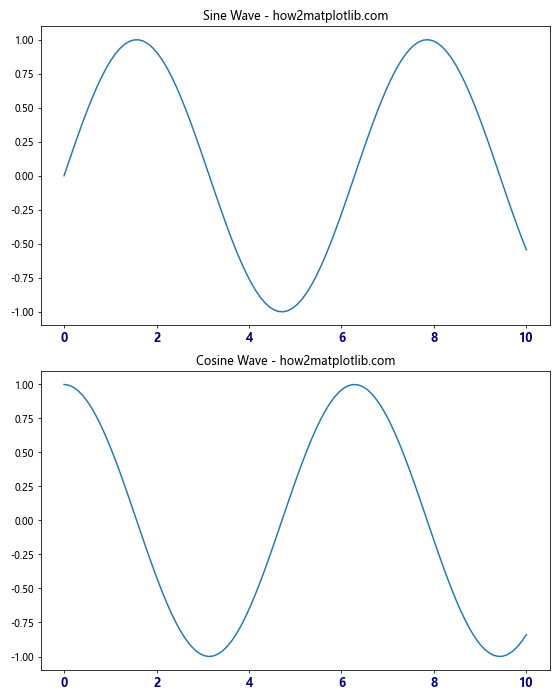
This example demonstrates how to customize the font size, weight, and color of x-axis labels while still using Matplotlib.figure.Figure.align_xlabels() for alignment.
Combining Matplotlib.figure.Figure.align_xlabels() with Seaborn
Matplotlib.figure.Figure.align_xlabels() can also be used in conjunction with Seaborn, a popular statistical data visualization library built on top of Matplotlib. Here’s an example:
import matplotlib.pyplot as plt
import seaborn as sns
import numpy as np

fig, (ax1, ax2) = plt.subplots(2, 1, figsize=(10, 12))

# Generate sample data
x = np.linspace(0, 10, 100)
y1 = np.sin(x) + np.random.normal(0, 0.1, 100)
y2 = np.cos(x) + np.random.normal(0, 0.1, 100)

# Create Seaborn plots
sns.regplot(x=x, y=y1, ax=ax1)
ax1.set_title('Sine Wave with Regression - how2matplotlib.com')

sns.regplot(x=x, y=y2, ax=ax2)
ax2.set_title('Cosine Wave with Regression - how2matplotlib.com')

# Align x-labels
fig.align_xlabels()

plt.tight_layout()
plt.show()
Output:
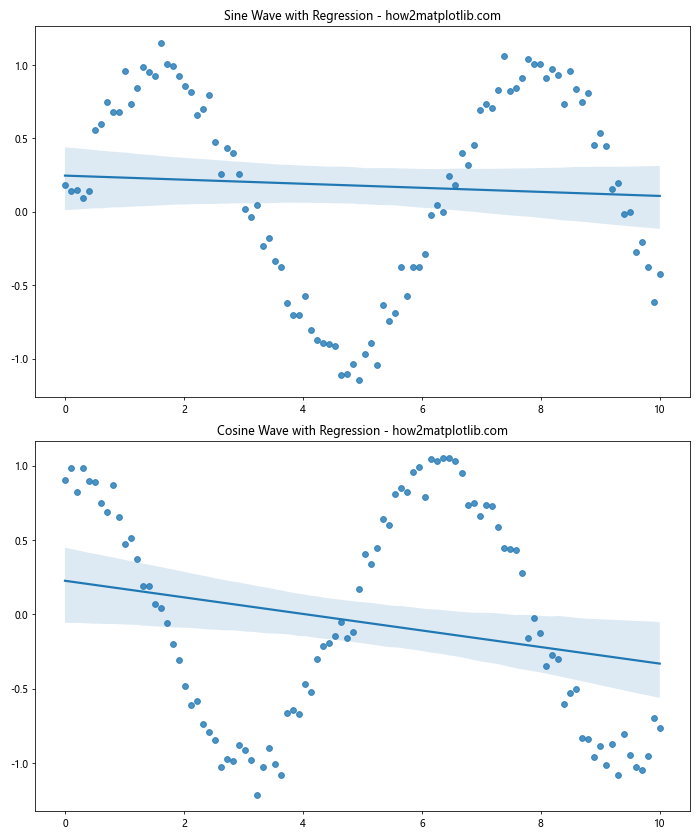
This example demonstrates how to use Matplotlib.figure.Figure.align_xlabels() with Seaborn regression plots.
Troubleshooting Common Issues with Matplotlib.figure.Figure.align_xlabels() in Python
While Matplotlib.figure.Figure.align_xlabels() is a powerful tool, you may encounter some issues when using it. Here are some common problems and their solutions:
Issue 1: Labels Not Aligning Properly
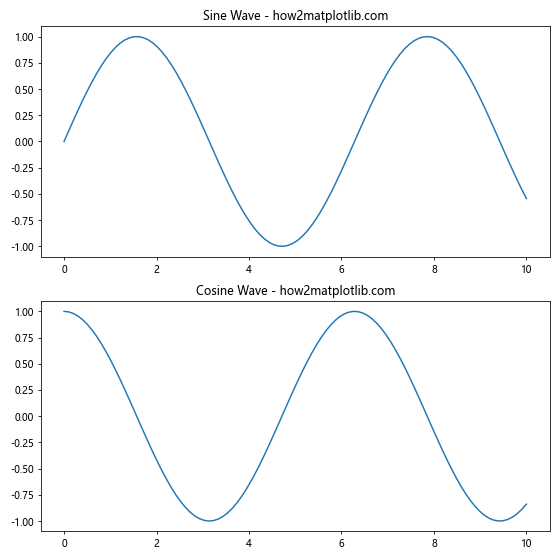
If you find that your x-axis labels are not aligning properly after using Matplotlib.figure.Figure.align_xlabels(), it may be due to inconsistent subplot sizes. To resolve this, you can use tight_layout() or adjust the figure size:
import matplotlib.pyplot as plt
import numpy as np

fig, (ax1, ax2) = plt.subplots(2, 1, figsize=(8, 8))

x = np.linspace(0, 10, 100)
y1 = np.sin(x)
y2 = np.cos(x)

ax1.plot(x, y1)
ax1.set_title('Sine Wave - how2matplotlib.com')

ax2.plot(x, y2)
ax2.set_title('Cosine Wave - how2matplotlib.com')

fig.align_xlabels()

plt.tight_layout()
plt.show()
Output:
Issue 2: Alignment Affecting Other Elements
Sometimes, using Matplotlib.figure.Figure.align_xlabels()may affect other elements in your plot. To mitigate this, you can adjust the subplot parameters:
import matplotlib.pyplot as plt
import numpy as np

fig, (ax1, ax2) = plt.subplots(2, 1, figsize=(8, 8))

x = np.linspace(0, 10, 100)
y1 = np.sin(x)
y2 = np.cos(x)

ax1.plot(x, y1)
ax1.set_title('Sine Wave - how2matplotlib.com')

ax2.plot(x, y2)
ax2.set_title('Cosine Wave - how2matplotlib.com')

fig.align_xlabels()

plt.subplots_adjust(hspace=0.4)
plt.show()
Output:
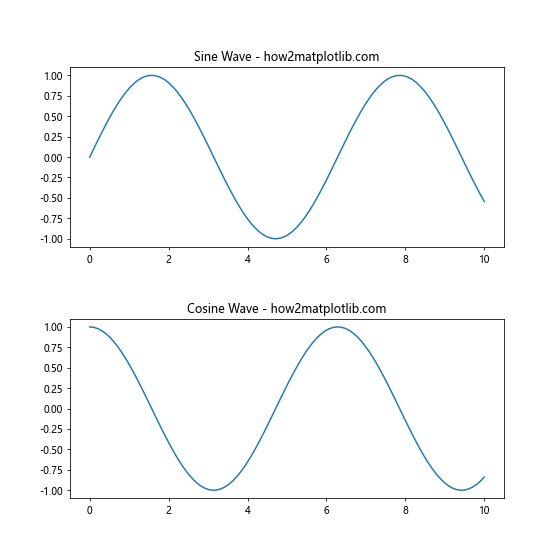
In this example, we use plt.subplots_adjust() to increase the vertical space between subplots, preventing any overlap caused by the alignment.
Best Practices for Using Matplotlib.figure.Figure.align_xlabels() in Python
To make the most of Matplotlib.figure.Figure.align_xlabels() in your Python data visualization projects, consider the following best practices:
- Always call Matplotlib.figure.Figure.align_xlabels() after creating all subplots and setting their content.
- Use
tight_layout()orsubplots_adjust()to fine-tune the layout after alignment. - Be consistent with x-axis scales across subplots for better alignment results.
- Consider the overall figure size and aspect ratio when working with multiple subplots.
- Combine Matplotlib.figure.Figure.align_xlabels() with other alignment methods like
align_ylabels()for comprehensive alignment.
Advanced Applications of Matplotlib.figure.Figure.align_xlabels() in Python
Let’s explore some advanced applications of Matplotlib.figure.Figure.align_xlabels() in Python:
Aligning Labels in Faceted Plots
When creating faceted plots with multiple subplots, Matplotlib.figure.Figure.align_xlabels() can be particularly useful:
import matplotlib.pyplot as plt
import numpy as np

fig, axs = plt.subplots(2, 2, figsize=(12, 10))

x = np.linspace(0, 10, 100)

for i, ax in enumerate(axs.flat):
    ax.plot(x, np.sin(x + i))
    ax.set_title(f'Sine Wave {i+1} - how2matplotlib.com')
    ax.set_xlabel('X-axis')
    ax.set_ylabel('Y-axis')

fig.align_xlabels()
fig.align_ylabels()

plt.tight_layout()
plt.show()
Output:
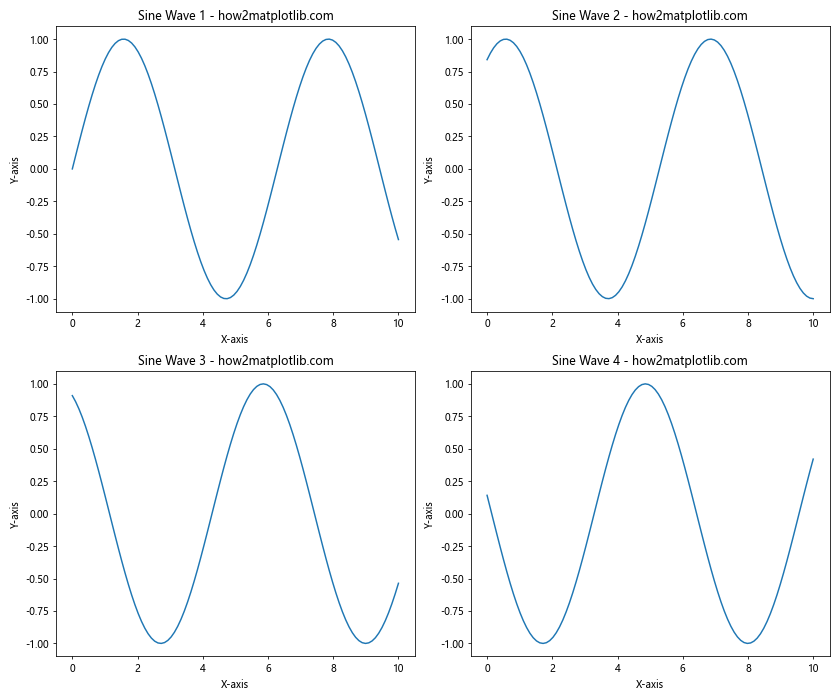
This example creates a 2×2 grid of subplots with slightly different sine waves and aligns both x and y-axis labels.
Combining with Shared Axes
Matplotlib.figure.Figure.align_xlabels() can be used effectively with shared axes:
import matplotlib.pyplot as plt
import numpy as np

fig, (ax1, ax2) = plt.subplots(2, 1, figsize=(8, 8), sharex=True)

x = np.linspace(0, 10, 100)
y1 = np.sin(x)
y2 = np.cos(x)

ax1.plot(x, y1)
ax1.set_title('Sine Wave - how2matplotlib.com')

ax2.plot(x, y2)
ax2.set_title('Cosine Wave - how2matplotlib.com')

fig.align_xlabels()

plt.tight_layout()
plt.show()
Output:
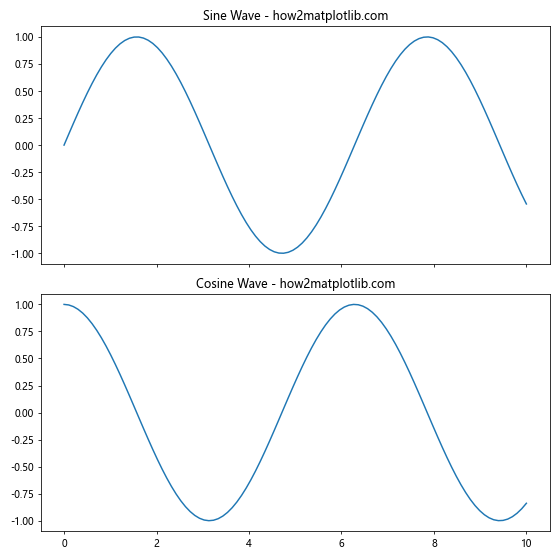
In this example, we use sharex=True to share the x-axis between subplots, and then apply Matplotlib.figure.Figure.align_xlabels() for perfect alignment.
Comparing Matplotlib.figure.Figure.align_xlabels() with Other Alignment Methods
While Matplotlib.figure.Figure.align_xlabels() is a powerful tool for aligning x-axis labels, it’s worth comparing it with other alignment methods in Matplotlib:
Manual Alignment
You can manually align labels by adjusting the position of individual subplots:
import matplotlib.pyplot as plt
import numpy as np

fig, (ax1, ax2) = plt.subplots(2, 1, figsize=(8, 8))

x = np.linspace(0, 10, 100)
y1 = np.sin(x)
y2 = np.cos(x)

ax1.plot(x, y1)
ax1.set_title('Sine Wave - how2matplotlib.com')

ax2.plot(x, y2)
ax2.set_title('Cosine Wave - how2matplotlib.com')

# Manual alignment
ax1.set_position([0.125, 0.53, 0.775, 0.34])
ax2.set_position([0.125, 0.125, 0.775, 0.34])

plt.show()
Output:
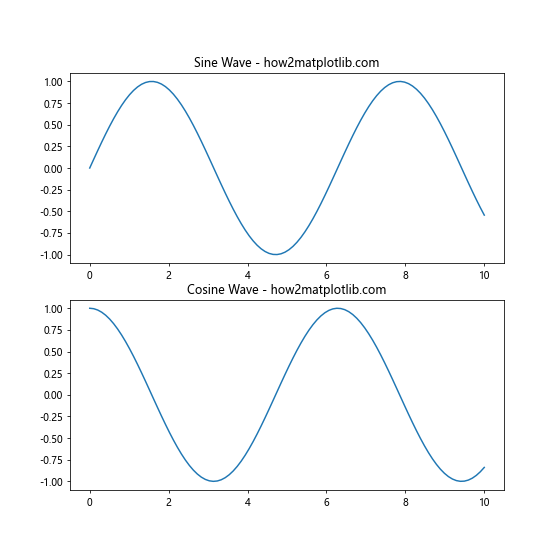
While this method offers precise control, it can be time-consuming for complex layouts.
Using GridSpec
GridSpec provides another way to align subplots:
import matplotlib.pyplot as plt
import numpy as np

fig = plt.figure(figsize=(8, 8))
gs = fig.add_gridspec(2, 1)

ax1 = fig.add_subplot(gs[0, 0])
ax2 = fig.add_subplot(gs[1, 0])

x = np.linspace(0, 10, 100)
y1 = np.sin(x)
y2 = np.cos(x)

ax1.plot(x, y1)
ax1.set_title('Sine Wave - how2matplotlib.com')

ax2.plot(x, y2)
ax2.set_title('Cosine Wave - how2matplotlib.com')

plt.tight_layout()
plt.show()
Output:
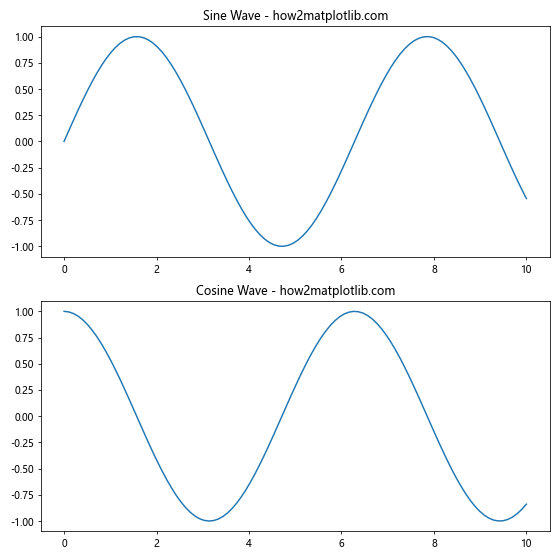
GridSpec offers flexibility in layout design but may require more setup than Matplotlib.figure.Figure.align_xlabels().
Conclusion: Mastering Matplotlib.figure.Figure.align_xlabels() in Python
Matplotlib.figure.Figure.align_xlabels() is a powerful tool in the Matplotlib library that allows for precise alignment of x-axis labels across multiple subplots. Throughout this comprehensive guide, we’ve explored various aspects of this method, including its basic usage, advanced applications, and best practices.
We’ve seen how Matplotlib.figure.Figure.align_xlabels() can be used to improve the readability and professional appearance of complex visualizations with multiple subplots. We’ve also demonstrated its flexibility in handling different subplot layouts, customizing label appearances, and working with date and time data.
By combining Matplotlib.figure.Figure.align_xlabels() with other Matplotlib functions and even other libraries like Seaborn, you can create highly polished and informative data visualizations. We’ve also addressed common issues you might encounter when using this method and provided solutions to overcome them.