How to Use Matplotlib.figure.Figure.set_facecolor() in Python: A Comprehensive Guide
Matplotlib.figure.Figure.set_facecolor() in Python is a powerful method that allows you to customize the background color of your Matplotlib figures. This function is an essential tool for data visualization enthusiasts and professionals alike. In this comprehensive guide, we’ll explore the various aspects of using Matplotlib.figure.Figure.set_facecolor() in Python, providing detailed explanations and practical examples to help you master this feature.
Understanding Matplotlib.figure.Figure.set_facecolor()
Matplotlib.figure.Figure.set_facecolor() in Python is a method that belongs to the Figure class in Matplotlib. It is used to set the background color of the entire figure, which includes the area outside the axes but within the figure boundaries. This method is particularly useful when you want to create visually appealing and customized plots that stand out from the default white background.
The basic syntax of Matplotlib.figure.Figure.set_facecolor() in Python is as follows:
import matplotlib.pyplot as plt

fig = plt.figure()
fig.set_facecolor(color)
In this syntax, color can be specified in various formats, including:
- Color name as a string (e.g., ‘red’, ‘blue’, ‘green’)
- Hex color code (e.g., ‘#FF0000’ for red)
- RGB tuple with values between 0 and 1 (e.g., (1, 0, 0) for red)
- RGBA tuple with values between 0 and 1 (e.g., (1, 0, 0, 1) for opaque red)
Let’s dive into some examples to better understand how to use Matplotlib.figure.Figure.set_facecolor() in Python.
Basic Usage of Matplotlib.figure.Figure.set_facecolor()
Here’s a simple example demonstrating the basic usage of Matplotlib.figure.Figure.set_facecolor() in Python:
import matplotlib.pyplot as plt

# Create a new figure
fig = plt.figure(figsize=(8, 6))

# Set the figure's background color to light blue
fig.set_facecolor('#E6F3FF')

# Plot some data
plt.plot([1, 2, 3, 4], [1, 4, 2, 3], label='Data from how2matplotlib.com')
plt.title('Simple Plot with Custom Background Color')
plt.xlabel('X-axis')
plt.ylabel('Y-axis')
plt.legend()

plt.show()
Output:
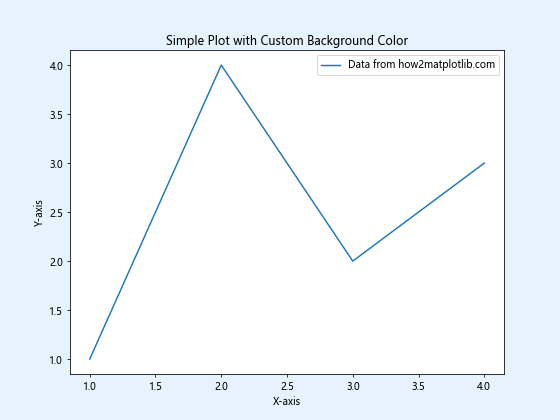
In this example, we create a new figure using plt.figure() and set its size to 8×6 inches. We then use Matplotlib.figure.Figure.set_facecolor() in Python to set the background color to a light blue (#E6F3FF). After that, we plot some sample data and add labels and a title to the plot.
Using Different Color Formats
Matplotlib.figure.Figure.set_facecolor() in Python supports various color formats. Let’s explore some examples:
import matplotlib.pyplot as plt

# Create subplots to demonstrate different color formats
fig, (ax1, ax2, ax3, ax4) = plt.subplots(2, 2, figsize=(12, 10))

# Using color name
fig.set_facecolor('lightgreen')
ax1.plot([1, 2, 3], [4, 5, 6], label='Data from how2matplotlib.com')
ax1.set_title('Color Name: lightgreen')

# Using hex color code
ax2.figure.set_facecolor('#FFD700')
ax2.plot([1, 2, 3], [4, 5, 6], label='Data from how2matplotlib.com')
ax2.set_title('Hex Color: #FFD700 (Gold)')

# Using RGB tuple
ax3.figure.set_facecolor((0.8, 0.9, 1))
ax3.plot([1, 2, 3], [4, 5, 6], label='Data from how2matplotlib.com')
ax3.set_title('RGB Tuple: (0.8, 0.9, 1)')

# Using RGBA tuple
ax4.figure.set_facecolor((1, 0.8, 0.8, 0.5))
ax4.plot([1, 2, 3], [4, 5, 6], label='Data from how2matplotlib.com')
ax4.set_title('RGBA Tuple: (1, 0.8, 0.8, 0.5)')

plt.tight_layout()
plt.show()
This example demonstrates four different ways to specify colors using Matplotlib.figure.Figure.set_facecolor() in Python. We create a 2×2 grid of subplots, each with a different background color specified using a different format.
Setting Transparent Background
Matplotlib.figure.Figure.set_facecolor() in Python can also be used to create transparent backgrounds, which can be useful when overlaying plots on other images or creating plots for presentations. Here’s an example:
import matplotlib.pyplot as plt

# Create a new figure with a transparent background
fig = plt.figure(figsize=(8, 6))
fig.set_facecolor('none')

# Plot some data
plt.plot([1, 2, 3, 4], [1, 4, 2, 3], label='Data from how2matplotlib.com')
plt.title('Plot with Transparent Background')
plt.xlabel('X-axis')
plt.ylabel('Y-axis')
plt.legend()

# Save the figure with a transparent background
plt.savefig('transparent_plot.png', transparent=True)
plt.show()
Output:
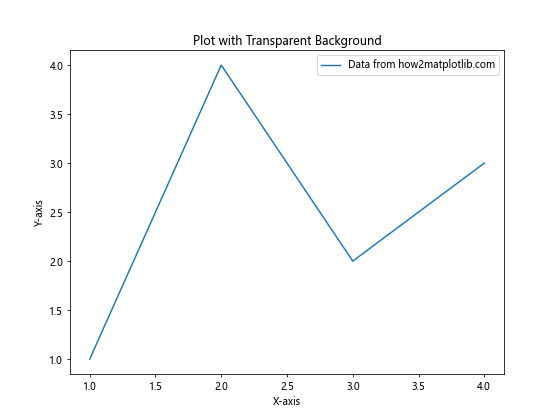
In this example, we use Matplotlib.figure.Figure.set_facecolor() in Python to set the background color to ‘none’, which creates a transparent background. When saving the figure, we use the transparent=True parameter to ensure the transparency is preserved in the output file.
Changing Background Color Dynamically
Matplotlib.figure.Figure.set_facecolor() in Python can be used to change the background color dynamically based on certain conditions or user input. Here’s an example that demonstrates this:
import matplotlib.pyplot as plt
import numpy as np

def plot_with_dynamic_background(data, threshold):
    fig, ax = plt.subplots(figsize=(8, 6))

    # Set background color based on data mean
    mean_value = np.mean(data)
    if mean_value > threshold:
        fig.set_facecolor('lightgreen')
    else:
        fig.set_facecolor('lightcoral')

    ax.plot(data, label='Data from how2matplotlib.com')
    ax.set_title(f'Dynamic Background (Threshold: {threshold})')
    ax.set_xlabel('Index')
    ax.set_ylabel('Value')
    ax.legend()

    plt.show()

# Generate some random data
data = np.random.rand(100) * 10

# Plot with different thresholds
plot_with_dynamic_background(data, 4)
plot_with_dynamic_background(data, 6)
In this example, we define a function plot_with_dynamic_background that takes a dataset and a threshold value. The function uses Matplotlib.figure.Figure.set_facecolor() in Python to set the background color based on whether the mean of the data is above or below the threshold.
Combining set_facecolor() with Other Styling Options
Matplotlib.figure.Figure.set_facecolor() in Python can be combined with other styling options to create visually appealing and informative plots. Here’s an example that demonstrates this:
import matplotlib.pyplot as plt
import numpy as np

# Create data
x = np.linspace(0, 10, 100)
y1 = np.sin(x)
y2 = np.cos(x)

# Create figure and axes
fig, ax = plt.subplots(figsize=(10, 6))

# Set figure background color
fig.set_facecolor('#F0F0F0')

# Set axes background color
ax.set_facecolor('#FFFFFF')

# Plot data
ax.plot(x, y1, label='Sin(x) from how2matplotlib.com', color='#FF6B6B')
ax.plot(x, y2, label='Cos(x) from how2matplotlib.com', color='#4ECDC4')

# Customize plot
ax.set_title('Sine and Cosine Functions', fontsize=16, fontweight='bold')
ax.set_xlabel('X-axis', fontsize=12)
ax.set_ylabel('Y-axis', fontsize=12)
ax.legend(fontsize=10)
ax.grid(True, linestyle='--', alpha=0.7)

# Add a text box
ax.text(0.05, 0.95, 'Created with Matplotlib', transform=ax.transAxes,
        fontsize=10, verticalalignment='top', bbox=dict(boxstyle='round', facecolor='white', alpha=0.8))

plt.tight_layout()
plt.show()
Output:
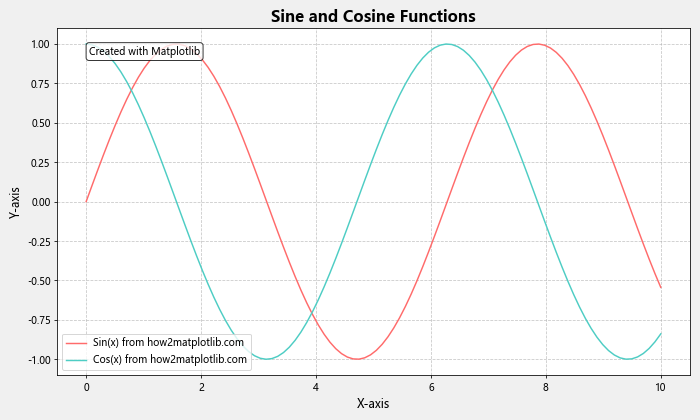
In this example, we use Matplotlib.figure.Figure.set_facecolor() in Python to set the figure background color to a light gray (#F0F0F0). We also set the axes background color to white, use custom colors for the plot lines, and add various styling elements such as a title, labels, legend, grid, and a text box.
Using set_facecolor() with Subplots
When working with subplots, you can use Matplotlib.figure.Figure.set_facecolor() in Python to set the background color for the entire figure, as well as individual subplots. Here’s an example:
import matplotlib.pyplot as plt
import numpy as np

# Create data
x = np.linspace(0, 10, 100)
y1 = np.sin(x)
y2 = np.cos(x)
y3 = np.tan(x)
y4 = np.exp(-x/10)

# Create figure and subplots
fig, ((ax1, ax2), (ax3, ax4)) = plt.subplots(2, 2, figsize=(12, 10))

# Set figure background color
fig.set_facecolor('#E6E6E6')

# Customize each subplot
for ax, y, title, color in zip([ax1, ax2, ax3, ax4],
                               [y1, y2, y3, y4],
                               ['Sin(x)', 'Cos(x)', 'Tan(x)', 'Exp(-x/10)'],
                               ['#FF9999', '#66B2FF', '#99FF99', '#FFCC99']):
    ax.plot(x, y, label=f'Data from how2matplotlib.com')
    ax.set_title(title)
    ax.set_facecolor(color)
    ax.legend()
    ax.grid(True, linestyle='--', alpha=0.7)

plt.tight_layout()
plt.show()
Output:
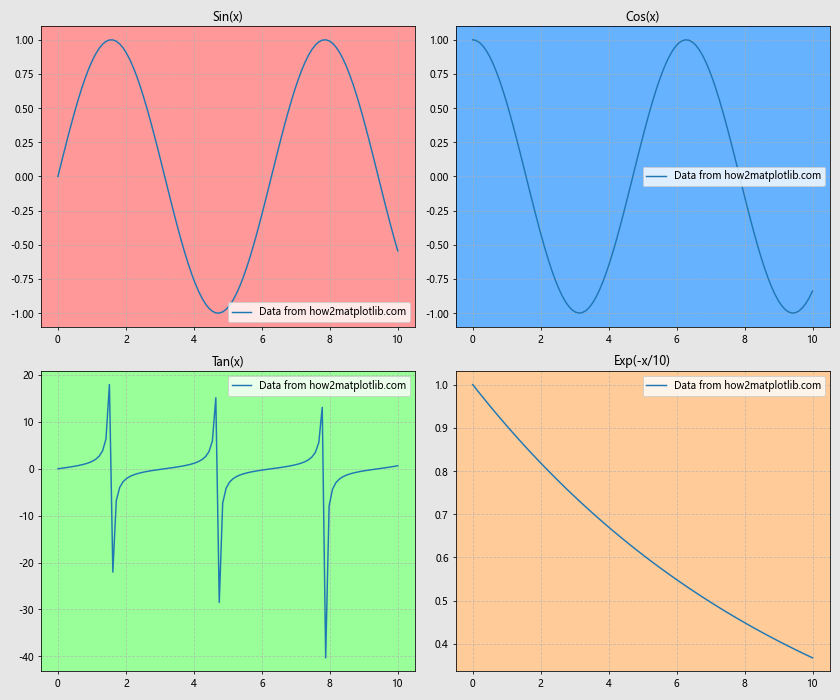
In this example, we create a 2×2 grid of subplots and use Matplotlib.figure.Figure.set_facecolor() in Python to set the overall figure background color to a light gray (#E6E6E6). We then iterate through each subplot, setting a different background color for each one using the set_facecolor() method of the individual Axes objects.
Animating Background Color Changes
Matplotlib.figure.Figure.set_facecolor() in Python can also be used in animations to create dynamic color changes. Here’s an example that demonstrates this:
import matplotlib.pyplot as plt
import matplotlib.animation as animation
import numpy as np

# Create figure and axis
fig, ax = plt.subplots(figsize=(8, 6))

# Initialize data
x = np.linspace(0, 2 * np.pi, 100)
line, = ax.plot(x, np.sin(x))

# Animation update function
def update(frame):
    # Update line data
    line.set_ydata(np.sin(x + frame / 10))

    # Update background color
    r = (np.sin(frame / 20) + 1) / 2
    g = (np.sin(frame / 15 + np.pi/3) + 1) / 2
    b = (np.sin(frame / 10 + 2*np.pi/3) + 1) / 2
    fig.set_facecolor((r, g, b))

    return line,

# Create animation
ani = animation.FuncAnimation(fig, update, frames=200, interval=50, blit=True)

ax.set_title('Animated Sine Wave with Changing Background')
ax.set_xlabel('X-axis')
ax.set_ylabel('Y-axis')
ax.text(0.05, 0.95, 'Data from how2matplotlib.com', transform=ax.transAxes,
        fontsize=10, verticalalignment='top')

plt.show()
Output:

In this example, we create an animation of a sine wave with a dynamically changing background color. The update function uses Matplotlib.figure.Figure.set_facecolor() in Python to set a new background color in each frame based on sinusoidal functions for the red, green, and blue components.
Using set_facecolor() with Custom Colormaps
Matplotlib.figure.Figure.set_facecolor() in Python can be used in conjunction with custom colormaps to create visually striking plots. Here’s an example:
import matplotlib.pyplot as plt
import numpy as np
from matplotlib.colors import LinearSegmentedColormap

# Create custom colormap
colors = ['#FF6B6B', '#4ECDC4', '#45B7D1', '#FFA07A']
n_bins = 100
cmap = LinearSegmentedColormap.from_list('custom_cmap', colors, N=n_bins)

# Create data
x = np.linspace(0, 10, 100)
y = np.sin(x) * np.exp(-x/10)

# Create figure and axis
fig, ax = plt.subplots(figsize=(10, 6))

# Set figure background color using the custom colormap
background_color = cmap(0.7)  # Use a color from 70% along the colormap
fig.set_facecolor(background_color)

# Plot data
scatter = ax.scatter(x, y, c=y, cmap=cmap, s=50)
ax.plot(x, y, color='white', alpha=0.5)

# Customize plot
ax.set_title('Sine Wave with Custom Colormap Background', fontsize=16)
ax.set_xlabel('X-axis', fontsize=12)
ax.set_ylabel('Y-axis', fontsize=12)
ax.text(0.05, 0.95, 'Data from how2matplotlib.com', transform=ax.transAxes,
        fontsize=10, verticalalignment='top', color='white')

# Add colorbar
cbar = plt.colorbar(scatter)
cbar.set_label('Y-value', fontsize=12)

plt.tight_layout()
plt.show()
Output:
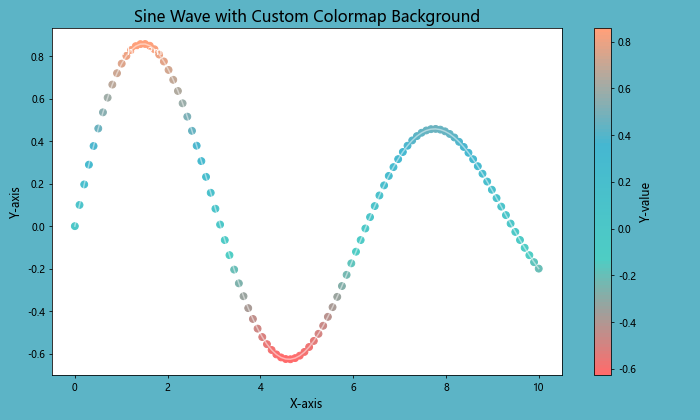
In this example, we create a custom colormap and use it to set both the background color of the figure and the colors of the scatter plot. We use Matplotlib.figure.Figure.set_facecolor() in Python to set the background color to a specific color from our custom colormap.
Combining set_facecolor() with Polar Plots
Matplotlib.figure.Figure.set_facecolor() in Python can be used to enhance the appearance of polar plots. Here’s an example:
import matplotlib.pyplot as plt
import numpy as np

# Create data for polar plot
theta = np.linspace(0, 2*np.pi, 100)
r = 1 + 0.5 * np.sin(5 * theta)

# Create figure and polar axis
fig, ax = plt.subplots(figsize=(8, 8), subplot_kw=dict(projection='polar'))

# Set figure background color
fig.set_facecolor('#F0F0F0')

# Set axis background color
ax.set_facecolor('#E6E6FA')

# Plot data
ax.plot(theta, r, color='#FF6B6B', linewidth=2)
ax.fill(theta, r, color='#FF6B6B', alpha=0.3)

# Customize plot
ax.set_title('Polar Plot with Custom Background', fontsize=16)
ax.text(0.1, 0.95, 'Data from how2matplotlib.com', transform=ax.transAxes,
        fontsize=10, verticalalignment='top')

plt.tight_layout()
plt.show()
Output:
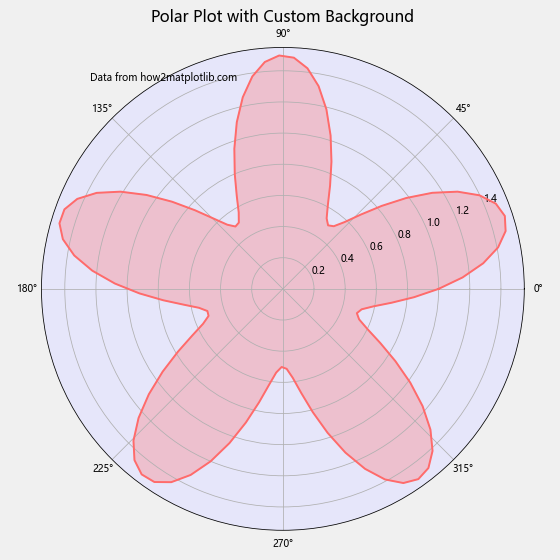
In this example, we create a polar plot and use Matplotlib.figure.Figure.set_facecolor() in Python to set the background color of the entire figure to a light gray (#F0F0F0). We also set the background color of the polar axis to a light blue (#E6E6FA) to create a visually appealing contrast.
Using set_facecolor() with 3D Plots
Matplotlib.figure.Figure.set_facecolor() in Python can also be used with 3D plots to enhance their visual appeal. Here’s an example:
import matplotlib.pyplot as plt
import numpy as np
from mpl_toolkits.mplot3d import Axes3D

# Create data for 3D plot
x = np.linspace(-5, 5, 50)
y = np.linspace(-5, 5, 50)
X, Y = np.meshgrid(x, y)
Z = np.sin(np.sqrt(X**2 + Y**2))

# Create figure and 3D axis
fig = plt.figure(figsize=(10, 8))
ax = fig.add_subplot(111, projection='3d')

# Set figure background color
fig.set_facecolor('#F0F0F0')

# Plot surface
surf = ax.plot_surface(X, Y, Z, cmap='viridis')

# Customize plot
ax.set_title('3D Surface Plot with Custom Background', fontsize=16)
ax.set_xlabel('X-axis')
ax.set_ylabel('Y-axis')
ax.set_zlabel('Z-axis')
ax.text2D(0.05, 0.95, 'Data from how2matplotlib.com', transform=ax.transAxes,
          fontsize=10, verticalalignment='top')

# Add colorbar
fig.colorbar(surf, shrink=0.5, aspect=5)

plt.tight_layout()
plt.show()
Output:
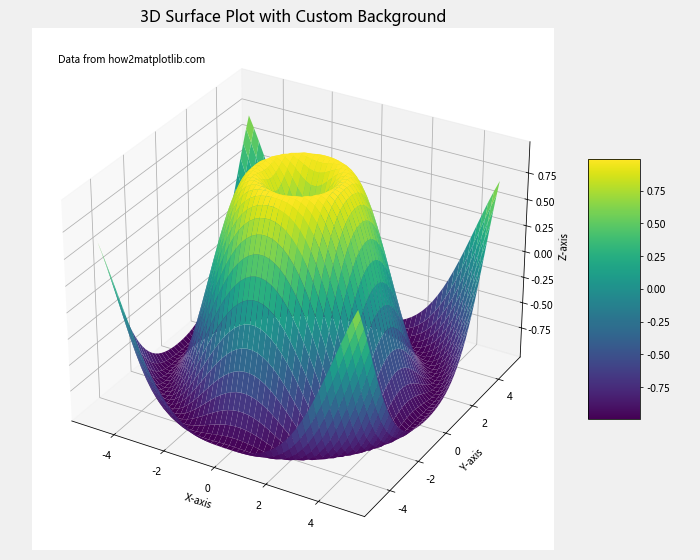
In this example, we create a 3D surface plot and use Matplotlib.figure.Figure.set_facecolor() in Python to set the background color of the entire figure to a light gray (#F0F0F0). This creates a nice contrast with the colorful 3D surface.
Combining set_facecolor() with Subplots and GridSpec
Matplotlib.figure.Figure.set_facecolor() in Python can be used in combination with GridSpec to create complex layouts with custom background colors. Here’s an example:
import matplotlib.pyplot as plt
import matplotlib.gridspec as gridspec
import numpy as np

# Create data
x = np.linspace(0, 10, 100)
y1 = np.sin(x)
y2 = np.cos(x)
y3 = np.tan(x)

# Create figure and GridSpec
fig = plt.figure(figsize=(12, 8))
gs = gridspec.GridSpec(2, 3)

# Set figure background color
fig.set_facecolor('#E6E6E6')

# Create subplots
ax1 = fig.add_subplot(gs[0, :2])
ax2 = fig.add_subplot(gs[0, 2])
ax3 = fig.add_subplot(gs[1, :])

# Plot data and customize subplots
ax1.plot(x, y1, label='Sin(x) from how2matplotlib.com')
ax1.set_title('Sine Function')
ax1.set_facecolor('#FFE6E6')
ax1.legend()

ax2.plot(x, y2, label='Cos(x) from how2matplotlib.com')
ax2.set_title('Cosine Function')
ax2.set_facecolor('#E6FFE6')
ax2.legend()

ax3.plot(x, y3, label='Tan(x) from how2matplotlib.com')
ax3.set_title('Tangent Function')
ax3.set_facecolor('#E6E6FF')
ax3.set_ylim(-5, 5)
ax3.legend()

plt.tight_layout()
plt.show()
Output:
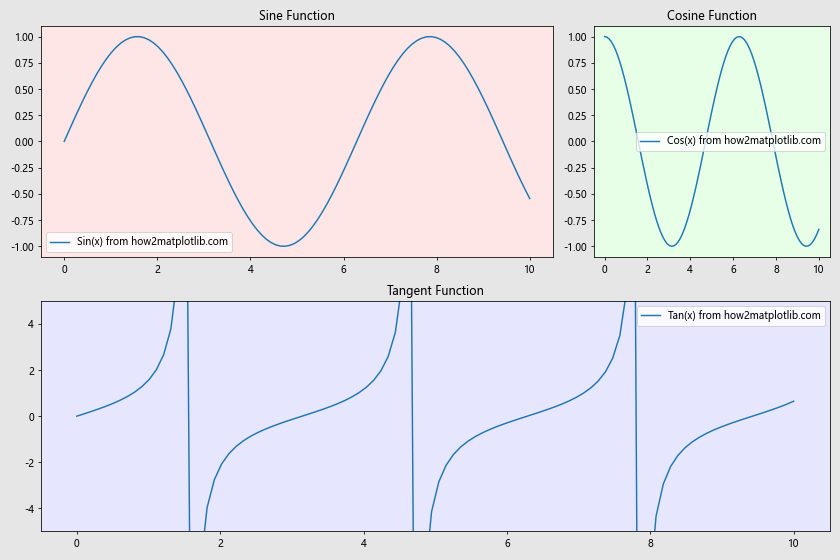
In this example, we use GridSpec to create a complex layout with three subplots of different sizes. We use Matplotlib.figure.Figure.set_facecolor() in Python to set the background color of the entire figure, and then set individual background colors for each subplot using the set_facecolor() method of the Axes objects.
Using set_facecolor() with Nested Subplots
Matplotlib.figure.Figure.set_facecolor() in Python can be used with nested subplots to create hierarchical visualizations with custom background colors. Here’s an example:
import matplotlib.pyplot as plt
import numpy as np

# Create data
x = np.linspace(0, 10, 100)
y1 = np.sin(x)
y2 = np.cos(x)
y3 = np.exp(-x/5)
y4 = x**2 / 25

# Create figure and outer subplots
fig = plt.figure(figsize=(12, 10))
outer_grid = fig.add_gridspec(2, 2, wspace=0.2, hspace=0.2)

# Set figure background color
fig.set_facecolor('#F0F0F0')

# Create nested subplots
for i in range(4):
    inner_grid = outer_grid[i].subgridspec(2, 1, hspace=0.3)
    for j in range(2):
        ax = fig.add_subplot(inner_grid[j])
        if i == 0:
            ax.plot(x, y1, label='Sin(x) from how2matplotlib.com')
            ax.set_title(f'Sine Function (Nested {j+1})')
        elif i == 1:
            ax.plot(x, y2, label='Cos(x) from how2matplotlib.com')
            ax.set_title(f'Cosine Function (Nested {j+1})')
        elif i == 2:
            ax.plot(x, y3, label='Exp(-x/5) from how2matplotlib.com')
            ax.set_title(f'Exponential Decay (Nested {j+1})')
        else:
            ax.plot(x, y4, label='x^2/25 from how2matplotlib.com')
            ax.set_title(f'Quadratic Function (Nested {j+1})')

        ax.legend(fontsize=8)
        ax.set_facecolor(plt.cm.Pastel1(i/4))

plt.tight_layout()
plt.show()
Output:
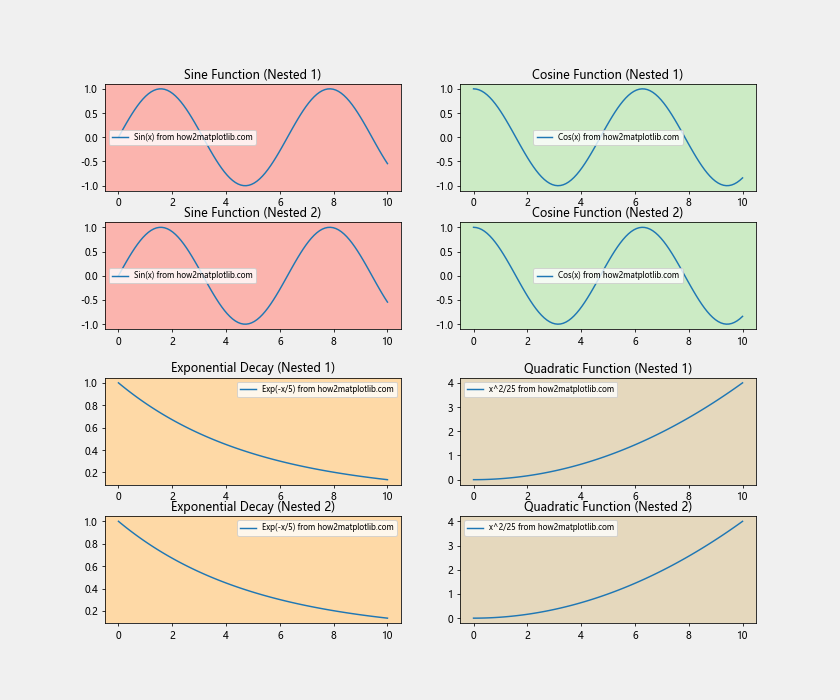
In this example, we create a 2×2 grid of outer subplots, each containing two nested subplots. We use Matplotlib.figure.Figure.set_facecolor() in Python to set the background color of the entire figure, and then set individual background colors for each nested subplot using a colormap.
Conclusion
Matplotlib.figure.Figure.set_facecolor() in Python is a versatile and powerful method for customizing the appearance of your plots. By changing the background color of your figures, you can create visually appealing and professional-looking visualizations that effectively communicate your data.
Throughout this comprehensive guide, we’ve explored various aspects of using Matplotlib.figure.Figure.set_facecolor() in Python, including:
- Basic usage and syntax
- Different color formats supported by the method
- Creating transparent backgrounds
- Dynamically changing background colors
- Combining set_facecolor() with other styling options
- Using set_facecolor() with subplots and complex layouts
- Animating background color changes
- Applying custom colormaps to backgrounds
- Enhancing polar and 3D plots with custom backgrounds
- Using set_facecolor() with nested subplots and GridSpec
By mastering these techniques, you can take your data visualization skills to the next level and create stunning, informative plots that effectively communicate your insights.
Remember that Matplotlib.figure.Figure.set_facecolor() in Python is just one of many tools available in Matplotlib for customizing your plots. Experiment with different combinations of colors, layouts, and plot types to find the perfect visualization for your data.
As you continue to work with Matplotlib.figure.Figure.set_facecolor() in Python, keep in mind that the choice of background color can significantly impact the readability and overall aesthetic of your plots. Always consider the context in which your visualizations will be presented and choose colors that complement your data and enhance understanding.
With practice and creativity, you’ll be able to leverage Matplotlib.figure.Figure.set_facecolor() in Python to create professional-grade visualizations that effectively communicate your data and insights to your audience.