How to Create Stunning Matplotlib Bar Charts: A Comprehensive Guide
Matplotlib bar charts are powerful tools for data visualization in Python. This comprehensive guide will walk you through everything you need to know about creating, customizing, and enhancing bar charts using Matplotlib. From basic bar charts to advanced techniques, we’ll cover it all, with plenty of examples to help you master the art of bar chart creation.
Matplotlib bar chart Recommended Articles
- matplotlib bar chart color
- matplotlib bar chart horizontal
- matplotlib bar chart labels overlap
- matplotlib bar chart legend
- matplotlib bar chart rotate x labels
- matplotlib bar chart with error bars
Introduction to Matplotlib Bar Charts
Matplotlib bar charts are an essential part of data visualization in Python. They provide an effective way to represent categorical data and compare values across different categories. Bar charts are particularly useful when you want to show the distribution of data or compare quantities between different groups.
Let’s start with a simple example of creating a basic bar chart using Matplotlib:
import matplotlib.pyplot as plt

categories = ['A', 'B', 'C', 'D']
values = [10, 20, 15, 25]

plt.figure(figsize=(8, 6))
plt.bar(categories, values)
plt.title('Basic Matplotlib Bar Chart - how2matplotlib.com')
plt.xlabel('Categories')
plt.ylabel('Values')
plt.show()
Output:
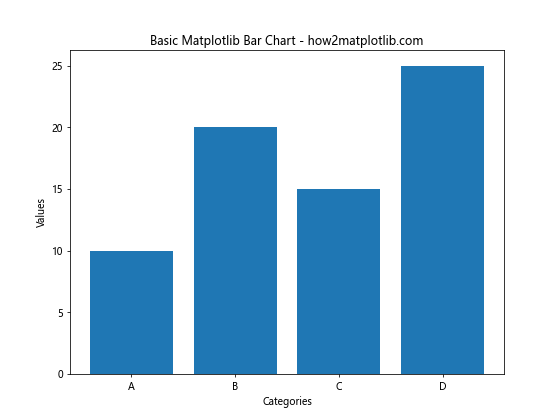
In this example, we create a basic bar chart with four categories and their corresponding values. The plt.bar() function is the core of creating bar charts in Matplotlib. We set the figure size, add labels, and display the chart.
Customizing Matplotlib Bar Charts
One of the strengths of Matplotlib bar charts is their flexibility in customization. You can adjust various aspects of the chart to make it more visually appealing and informative.
Changing Bar Colors
You can easily change the color of the bars in your Matplotlib bar chart:
import matplotlib.pyplot as plt

categories = ['A', 'B', 'C', 'D']
values = [10, 20, 15, 25]

plt.figure(figsize=(8, 6))
plt.bar(categories, values, color='skyblue')
plt.title('Matplotlib Bar Chart with Custom Color - how2matplotlib.com')
plt.xlabel('Categories')
plt.ylabel('Values')
plt.show()
Output:
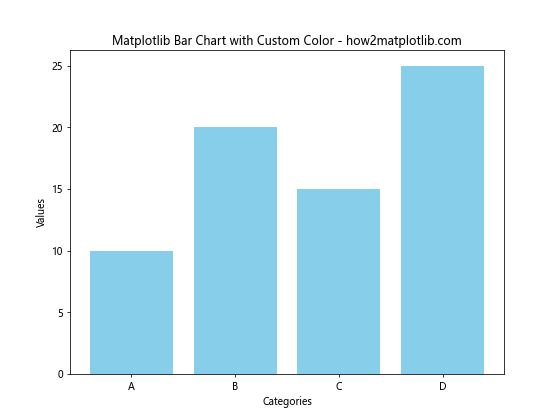
In this example, we set the color parameter to ‘skyblue’ to change the color of all bars.
Adding Error Bars
Error bars can be added to Matplotlib bar charts to show the uncertainty or variability in the data:
import matplotlib.pyplot as plt
import numpy as np

categories = ['A', 'B', 'C', 'D']
values = [10, 20, 15, 25]
errors = [1, 2, 1.5, 2.5]

plt.figure(figsize=(8, 6))
plt.bar(categories, values, yerr=errors, capsize=5)
plt.title('Matplotlib Bar Chart with Error Bars - how2matplotlib.com')
plt.xlabel('Categories')
plt.ylabel('Values')
plt.show()
Output:
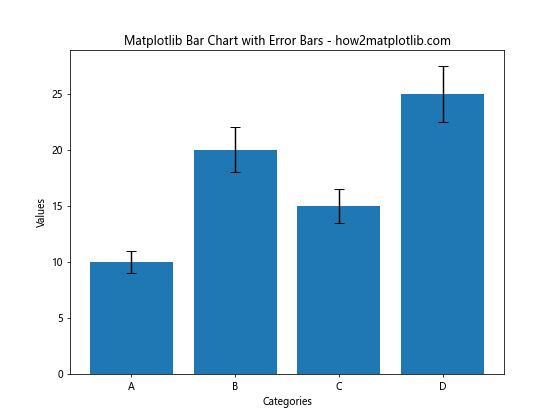
Here, we use the yerr parameter to specify the error values and capsize to set the width of the error bar caps.
Creating Grouped Bar Charts
Grouped bar charts are useful when you want to compare multiple sets of data across categories. Here’s how to create a grouped bar chart using Matplotlib:
import matplotlib.pyplot as plt
import numpy as np

categories = ['A', 'B', 'C', 'D']
values1 = [10, 20, 15, 25]
values2 = [12, 18, 22, 20]

x = np.arange(len(categories))
width = 0.35

fig, ax = plt.subplots(figsize=(10, 6))
rects1 = ax.bar(x - width/2, values1, width, label='Group 1')
rects2 = ax.bar(x + width/2, values2, width, label='Group 2')

ax.set_title('Grouped Matplotlib Bar Chart - how2matplotlib.com')
ax.set_xlabel('Categories')
ax.set_ylabel('Values')
ax.set_xticks(x)
ax.set_xticklabels(categories)
ax.legend()

plt.tight_layout()
plt.show()
Output:
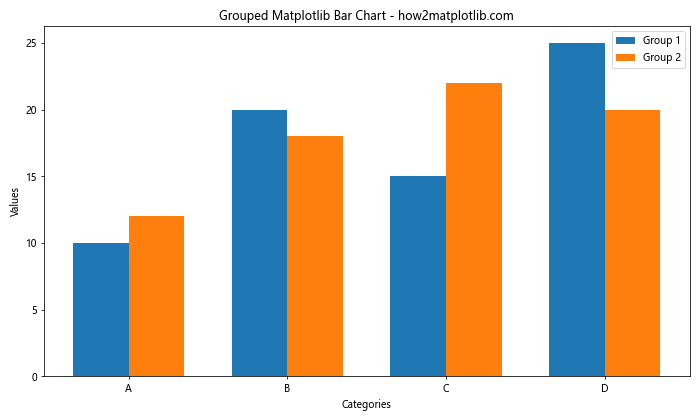
This example creates a grouped bar chart with two sets of data. We use numpy to calculate the positions of the bars and adjust their width to create the grouped effect.
Stacked Bar Charts
Stacked bar charts are another variation of Matplotlib bar charts that allow you to show the composition of each category:
import matplotlib.pyplot as plt

categories = ['A', 'B', 'C', 'D']
values1 = [10, 20, 15, 25]
values2 = [5, 10, 12, 8]
values3 = [8, 7, 6, 9]

plt.figure(figsize=(10, 6))
plt.bar(categories, values1, label='Group 1')
plt.bar(categories, values2, bottom=values1, label='Group 2')
plt.bar(categories, values3, bottom=[i+j for i,j in zip(values1, values2)], label='Group 3')

plt.title('Stacked Matplotlib Bar Chart - how2matplotlib.com')
plt.xlabel('Categories')
plt.ylabel('Values')
plt.legend()
plt.show()
Output:
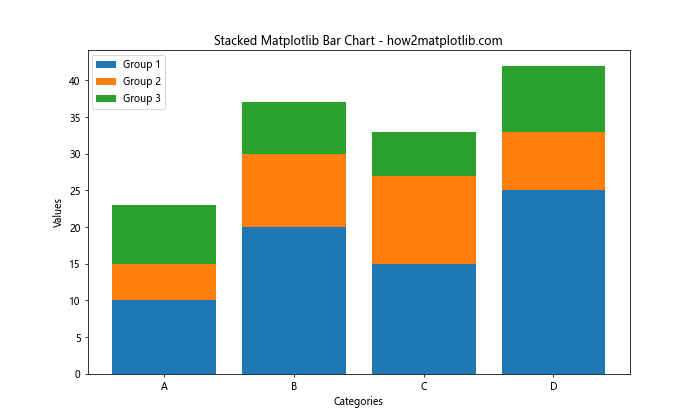
In this example, we create a stacked bar chart by using the bottom parameter to stack the bars on top of each other.
Horizontal Bar Charts
Matplotlib bar charts can also be oriented horizontally, which is particularly useful when dealing with long category names:
import matplotlib.pyplot as plt

categories = ['Category A', 'Category B', 'Category C', 'Category D with a Long Name']
values = [10, 20, 15, 25]

plt.figure(figsize=(10, 6))
plt.barh(categories, values)
plt.title('Horizontal Matplotlib Bar Chart - how2matplotlib.com')
plt.xlabel('Values')
plt.ylabel('Categories')
plt.show()
Output:
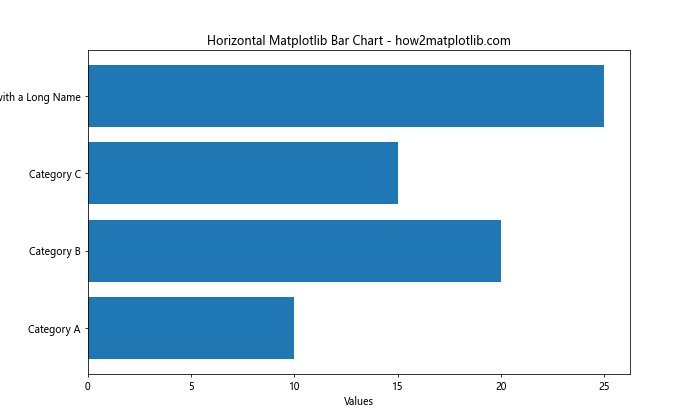
Here, we use plt.barh() instead of plt.bar() to create a horizontal bar chart.
Adding Data Labels to Matplotlib Bar Charts
Adding data labels to your Matplotlib bar charts can make them more informative:
import matplotlib.pyplot as plt

categories = ['A', 'B', 'C', 'D']
values = [10, 20, 15, 25]

fig, ax = plt.subplots(figsize=(8, 6))
bars = ax.bar(categories, values)

ax.set_title('Matplotlib Bar Chart with Data Labels - how2matplotlib.com')
ax.set_xlabel('Categories')
ax.set_ylabel('Values')

for bar in bars:
    height = bar.get_height()
    ax.text(bar.get_x() + bar.get_width()/2., height,
            f'{height}',
            ha='center', va='bottom')

plt.show()
Output:
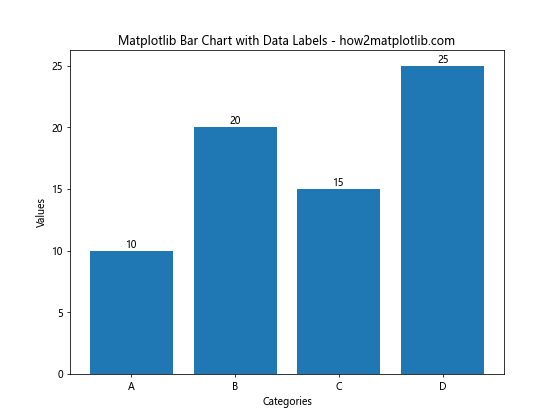
This example adds text labels above each bar to show the exact value.
Customizing Bar Width and Spacing
You can adjust the width of the bars and the spacing between them in Matplotlib bar charts:
import matplotlib.pyplot as plt

categories = ['A', 'B', 'C', 'D']
values = [10, 20, 15, 25]

plt.figure(figsize=(10, 6))
plt.bar(categories, values, width=0.5, align='center')
plt.title('Matplotlib Bar Chart with Custom Width - how2matplotlib.com')
plt.xlabel('Categories')
plt.ylabel('Values')
plt.show()
Output:
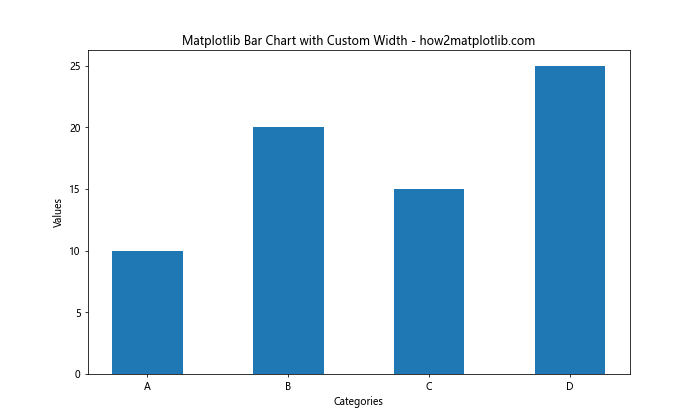
In this example, we set the width parameter to 0.5 to make the bars narrower, and use align='center' to center-align the bars.
Creating Multi-colored Bar Charts
You can assign different colors to individual bars in a Matplotlib bar chart:
import matplotlib.pyplot as plt

categories = ['A', 'B', 'C', 'D']
values = [10, 20, 15, 25]
colors = ['red', 'green', 'blue', 'orange']

plt.figure(figsize=(8, 6))
plt.bar(categories, values, color=colors)
plt.title('Multi-colored Matplotlib Bar Chart - how2matplotlib.com')
plt.xlabel('Categories')
plt.ylabel('Values')
plt.show()
Output:
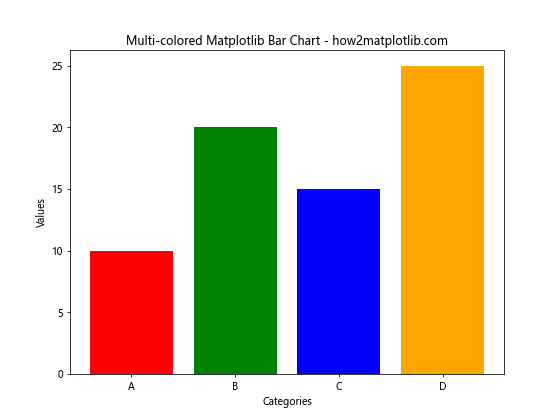
Here, we provide a list of colors to the color parameter to assign different colors to each bar.
Adding a Color Gradient to Bar Charts
You can create a color gradient effect in your Matplotlib bar charts:
import matplotlib.pyplot as plt
import numpy as np

categories = ['A', 'B', 'C', 'D', 'E']
values = [10, 20, 15, 25, 30]

plt.figure(figsize=(10, 6))
bars = plt.bar(categories, values)

# Create a color map
cm = plt.cm.get_cmap('viridis')
colors = cm(np.linspace(0, 1, len(categories)))

for bar, color in zip(bars, colors):
    bar.set_color(color)

plt.title('Matplotlib Bar Chart with Color Gradient - how2matplotlib.com')
plt.xlabel('Categories')
plt.ylabel('Values')
plt.show()
Output:
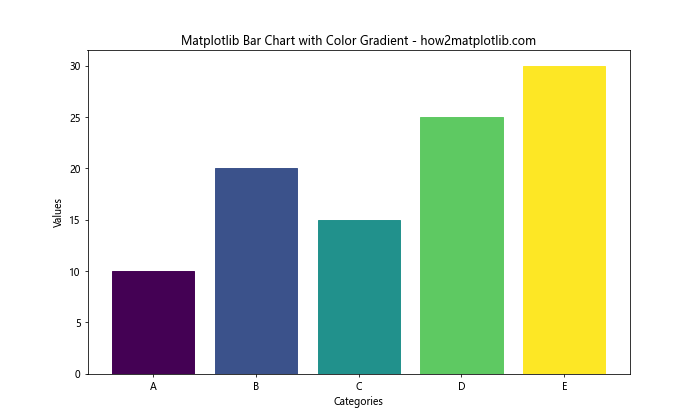
This example uses a color map to create a gradient effect across the bars.
Customizing Tick Labels and Rotation
You can customize the tick labels and rotate them for better readability:
import matplotlib.pyplot as plt

categories = ['Category A', 'Category B', 'Category C', 'Category D with a Long Name']
values = [10, 20, 15, 25]

plt.figure(figsize=(12, 6))
plt.bar(categories, values)
plt.title('Matplotlib Bar Chart with Rotated Labels - how2matplotlib.com')
plt.xlabel('Categories')
plt.ylabel('Values')
plt.xticks(rotation=45, ha='right')
plt.tight_layout()
plt.show()
Output:
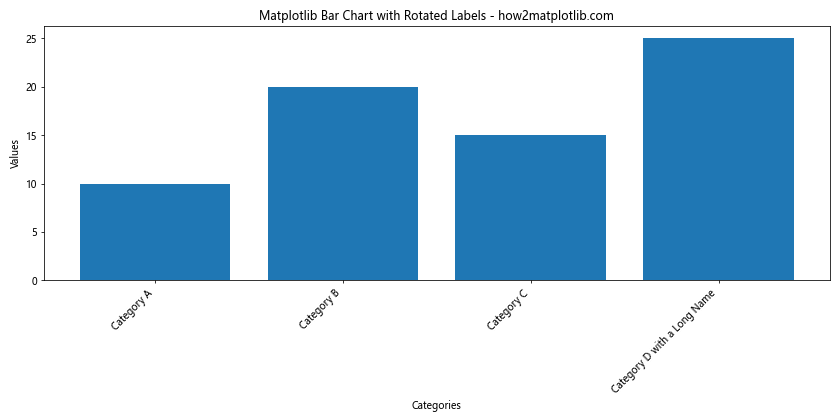
In this example, we rotate the x-axis labels by 45 degrees for better readability.
Adding a Secondary Y-axis
You can add a secondary y-axis to your Matplotlib bar charts to display related data:
import matplotlib.pyplot as plt

categories = ['A', 'B', 'C', 'D']
values1 = [10, 20, 15, 25]
values2 = [50, 100, 75, 125]

fig, ax1 = plt.subplots(figsize=(10, 6))

ax1.bar(categories, values1, color='b', alpha=0.7)
ax1.set_xlabel('Categories')
ax1.set_ylabel('Primary Values', color='b')
ax1.tick_params(axis='y', labelcolor='b')

ax2 = ax1.twinx()
ax2.plot(categories, values2, color='r', marker='o')
ax2.set_ylabel('Secondary Values', color='r')
ax2.tick_params(axis='y', labelcolor='r')

plt.title('Matplotlib Bar Chart with Secondary Y-axis - how2matplotlib.com')
plt.tight_layout()
plt.show()
Output:
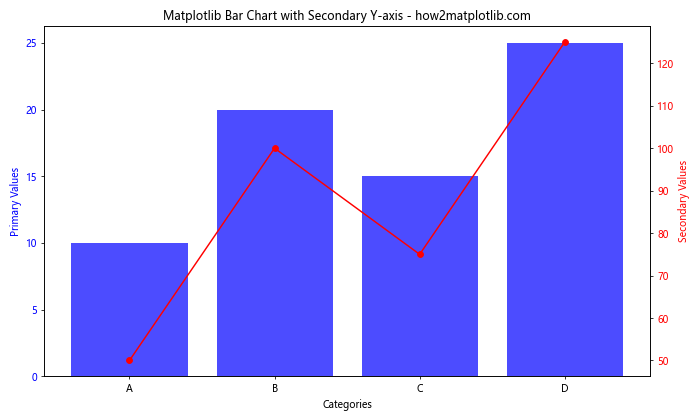
This example creates a bar chart with a primary y-axis and adds a secondary y-axis with a line plot.
Creating Animated Bar Charts
You can create animated bar charts using Matplotlib’s animation features:
import matplotlib.pyplot as plt
import matplotlib.animation as animation
import numpy as np

fig, ax = plt.subplots(figsize=(10, 6))

categories = ['A', 'B', 'C', 'D']
values = [10, 20, 15, 25]

bars = ax.bar(categories, values)

def update(frame):
    new_values = np.random.randint(10, 30, len(categories))
    for bar, value in zip(bars, new_values):
        bar.set_height(value)
    return bars

ani = animation.FuncAnimation(fig, update, frames=50, interval=200, blit=True)

plt.title('Animated Matplotlib Bar Chart - how2matplotlib.com')
plt.xlabel('Categories')
plt.ylabel('Values')
plt.show()
Output:
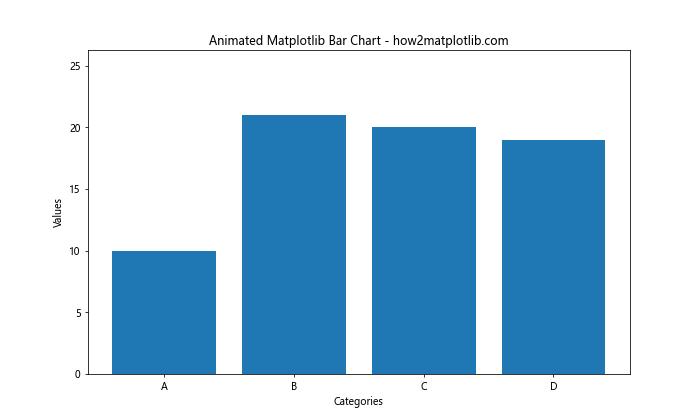
This example creates an animated bar chart where the bar heights change randomly over time.
Matplotlib bar charts Conclusion
Matplotlib bar charts are versatile and powerful tools for data visualization. In this comprehensive guide, we’ve explored various aspects of creating and customizing bar charts using Matplotlib. From basic bar charts to advanced techniques like grouped and stacked bar charts, 3D bar charts, and animated bar charts, you now have a solid foundation to create stunning visualizations for your data.
Remember that practice is key to mastering Matplotlib bar charts. Experiment with different options, combine techniques, and adapt these examples to your specific data and visualization needs. With Matplotlib’s flexibility and the knowledge you’ve gained from this guide, you’ll be able to create informative and visually appealing bar charts for any data visualization project.