How to Master Matplotlib Figure Size
Matplotlib figure size is a crucial aspect of data visualization that can significantly impact the clarity and effectiveness of your plots. In this comprehensive guide, we’ll explore everything you need to know about controlling and optimizing the size of your Matplotlib figures. From basic concepts to advanced techniques, we’ll cover a wide range of topics to help you become proficient in managing figure sizes in Matplotlib.
Matplotlib Figure Size Recommended Articles
- how to change matplotlib figure size
- matplotlib bar figure size
- matplotlib figure size subplots
- matplotlib figure size units
- matplotlib figure text size
Understanding Matplotlib Figure Size Basics
Matplotlib figure size refers to the dimensions of the overall plotting area in which your visualizations are created. By default, Matplotlib creates figures with a size of 6.4 inches wide by 4.8 inches tall. However, you can easily customize the figure size to suit your specific needs.
Let’s start with a basic example of how to set the figure size:
import matplotlib.pyplot as plt

# Set the figure size to 8 inches wide by 6 inches tall
plt.figure(figsize=(8, 6))

# Create a simple plot
plt.plot([1, 2, 3, 4], [1, 4, 2, 3])
plt.title("How2Matplotlib.com - Basic Figure Size Example")
plt.xlabel("X-axis")
plt.ylabel("Y-axis")

plt.show()
Output:
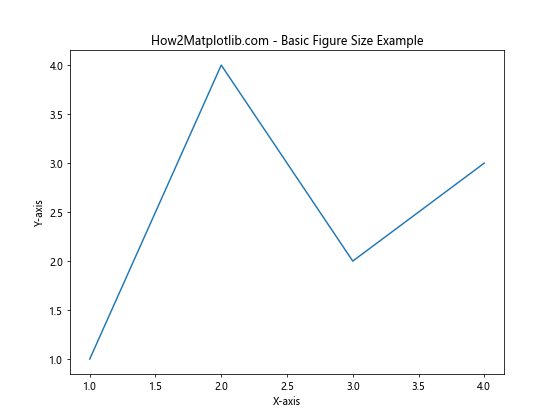
In this example, we use the figsize parameter of the plt.figure() function to set the figure size to 8 inches wide by 6 inches tall. The figsize parameter takes a tuple of two values: (width, height) in inches.
Adjusting Matplotlib Figure Size for Different Plot Types
Different types of plots may require different figure sizes for optimal visualization. Let’s explore how to adjust the figure size for various plot types:
Bar Plots
For bar plots, you might want to use a wider figure to accommodate multiple bars side by side:
import matplotlib.pyplot as plt
import numpy as np

# Set a wider figure size for bar plots
plt.figure(figsize=(12, 6))

categories = ['A', 'B', 'C', 'D', 'E']
values = np.random.randint(1, 100, 5)

plt.bar(categories, values)
plt.title("How2Matplotlib.com - Bar Plot with Custom Figure Size")
plt.xlabel("Categories")
plt.ylabel("Values")

plt.show()
Output:
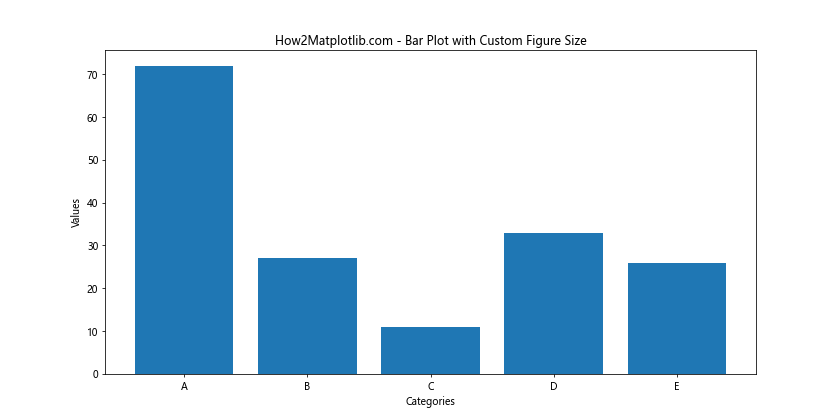
In this example, we set the figure size to 12 inches wide and 6 inches tall, providing more horizontal space for the bar plot.
Scatter Plots
For scatter plots, you might prefer a square figure to maintain equal scaling on both axes:
import matplotlib.pyplot as plt
import numpy as np

# Set a square figure size for scatter plots
plt.figure(figsize=(8, 8))

x = np.random.rand(50)
y = np.random.rand(50)

plt.scatter(x, y)
plt.title("How2Matplotlib.com - Scatter Plot with Square Figure Size")
plt.xlabel("X-axis")
plt.ylabel("Y-axis")

plt.show()
Output:
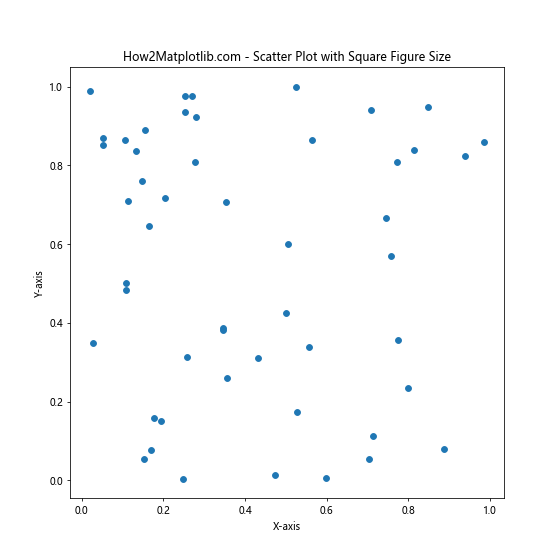
Here, we use a square figure size of 8×8 inches to ensure that the scatter plot maintains equal scaling on both axes.
Matplotlib Figure Size and DPI
When working with Matplotlib figure size, it’s important to understand the concept of DPI (Dots Per Inch). DPI affects the resolution of your plot and how it appears on different devices or when saved to a file.
Let’s see how to set both figure size and DPI:
import matplotlib.pyplot as plt
import numpy as np

# Set figure size and DPI
plt.figure(figsize=(10, 6), dpi=100)

x = np.linspace(0, 10, 100)
y = np.sin(x)

plt.plot(x, y)
plt.title("How2Matplotlib.com - Figure Size and DPI Example")
plt.xlabel("X-axis")
plt.ylabel("Y-axis")

plt.show()
Output:
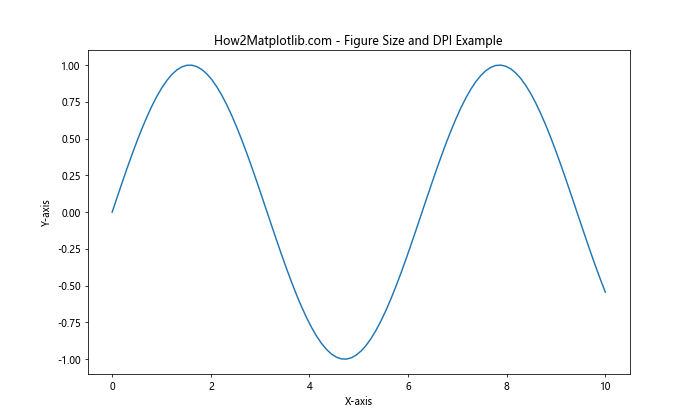
In this example, we set the figure size to 10×6 inches and the DPI to 100. This combination will result in a figure that is 1000×600 pixels in size.
Matplotlib Figure Size in Subplots
When creating multiple subplots, you can control the overall figure size as well as the size of individual subplots. Here’s an example:
import matplotlib.pyplot as plt
import numpy as np

# Set the overall figure size
fig, axs = plt.subplots(2, 2, figsize=(12, 10))

# Generate some sample data
x = np.linspace(0, 10, 100)
y1 = np.sin(x)
y2 = np.cos(x)
y3 = np.tan(x)
y4 = x**2

# Plot data in each subplot
axs[0, 0].plot(x, y1)
axs[0, 0].set_title("How2Matplotlib.com - Sine")

axs[0, 1].plot(x, y2)
axs[0, 1].set_title("How2Matplotlib.com - Cosine")

axs[1, 0].plot(x, y3)
axs[1, 0].set_title("How2Matplotlib.com - Tangent")

axs[1, 1].plot(x, y4)
axs[1, 1].set_title("How2Matplotlib.com - Square")

plt.tight_layout()
plt.show()
Output:
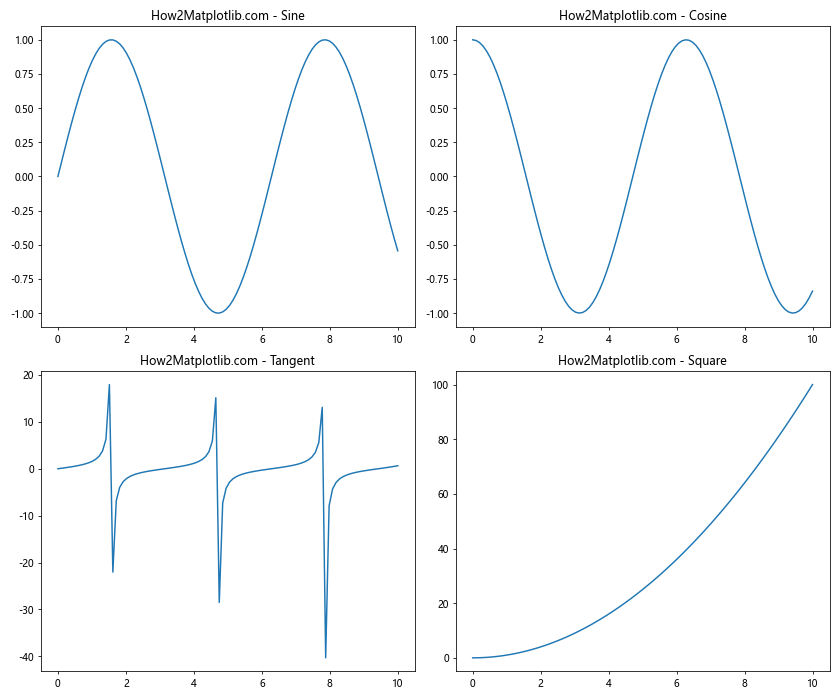
In this example, we create a 2×2 grid of subplots with an overall figure size of 12×10 inches. The tight_layout() function is used to automatically adjust the spacing between subplots.
Dynamically Adjusting Matplotlib Figure Size
Sometimes, you may need to adjust the figure size dynamically based on the data or other factors. Here’s an example of how to do this:
import matplotlib.pyplot as plt
import numpy as np

def create_plot(data):
    # Calculate the number of data points
    num_points = len(data)

    # Dynamically set the figure size based on the number of data points
    fig_width = max(6, num_points * 0.5)
    fig_height = 6

    plt.figure(figsize=(fig_width, fig_height))

    plt.plot(data)
    plt.title(f"How2Matplotlib.com - Dynamic Figure Size (Points: {num_points})")
    plt.xlabel("Index")
    plt.ylabel("Value")

    plt.show()

# Example usage
small_data = np.random.rand(10)
create_plot(small_data)

large_data = np.random.rand(50)
create_plot(large_data)
In this example, we define a function that dynamically adjusts the figure width based on the number of data points, while keeping a fixed height. This approach ensures that the plot remains readable regardless of the amount of data.
Matplotlib Figure Size and Aspect Ratio
The aspect ratio of a figure is the ratio of its width to its height. Controlling the aspect ratio can be important for certain types of plots. Let’s see how to maintain a specific aspect ratio:
import matplotlib.pyplot as plt
import numpy as np

# Set the desired aspect ratio (e.g., 16:9)
aspect_ratio = 16/9
fig_width = 10
fig_height = fig_width / aspect_ratio

plt.figure(figsize=(fig_width, fig_height))

x = np.linspace(0, 10, 100)
y = np.sin(x)

plt.plot(x, y)
plt.title("How2Matplotlib.com - Figure with 16:9 Aspect Ratio")
plt.xlabel("X-axis")
plt.ylabel("Y-axis")

plt.show()
Output:
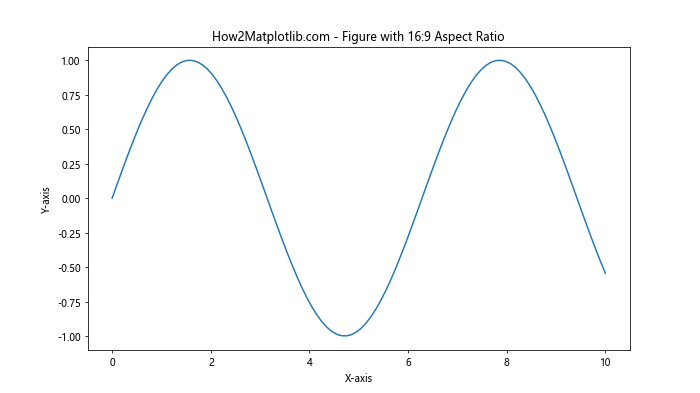
In this example, we set the figure width to 10 inches and calculate the height based on a 16:9 aspect ratio. This approach ensures that the figure maintains the desired proportions.
Saving Matplotlib Figures with Custom Sizes
When saving Matplotlib figures to files, you can specify the figure size and DPI. Here’s an example:
import matplotlib.pyplot as plt
import numpy as np

plt.figure(figsize=(8, 6), dpi=300)

x = np.linspace(0, 10, 100)
y = np.sin(x)

plt.plot(x, y)
plt.title("How2Matplotlib.com - High-Resolution Saved Figure")
plt.xlabel("X-axis")
plt.ylabel("Y-axis")

plt.savefig("high_res_plot.png", dpi=300, bbox_inches="tight")
plt.close()
In this example, we create a figure with a size of 8×6 inches and a DPI of 300. When saving the figure, we use the same DPI and add the bbox_inches="tight" parameter to ensure that the entire plot, including labels and titles, is saved without being cut off.
Matplotlib Figure Size in Different Units
While inches are the default unit for figure size in Matplotlib, you can also specify sizes in other units. Here’s an example using centimeters:
import matplotlib.pyplot as plt
import numpy as np

# Convert centimeters to inches
cm_to_inch = 1/2.54
width_cm, height_cm = 20, 15
width_inch, height_inch = width_cm * cm_to_inch, height_cm * cm_to_inch

plt.figure(figsize=(width_inch, height_inch))

x = np.linspace(0, 10, 100)
y = np.cos(x)

plt.plot(x, y)
plt.title("How2Matplotlib.com - Figure Size in Centimeters")
plt.xlabel("X-axis")
plt.ylabel("Y-axis")

plt.show()
Output:
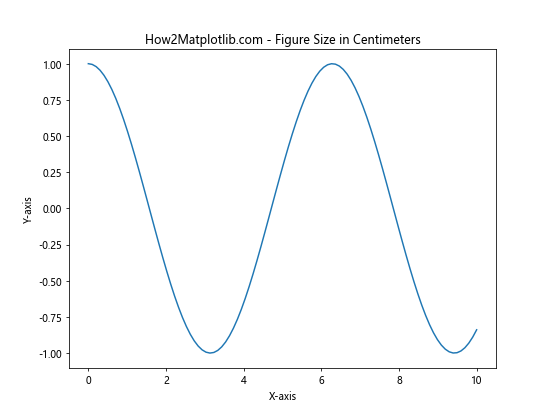
In this example, we specify the figure size in centimeters and convert it to inches for use with Matplotlib’s figsize parameter.
Adjusting Matplotlib Figure Size for Different Screen Resolutions
When creating visualizations for different screen resolutions, you may need to adjust the figure size accordingly. Here’s an example of how to create a responsive figure size:
import matplotlib.pyplot as plt
import numpy as np

def create_responsive_plot(data, screen_dpi):
    # Calculate the figure size based on screen DPI
    fig_width_inches = 1000 / screen_dpi
    fig_height_inches = 600 / screen_dpi

    plt.figure(figsize=(fig_width_inches, fig_height_inches), dpi=screen_dpi)

    plt.plot(data)
    plt.title(f"How2Matplotlib.com - Responsive Plot (Screen DPI: {screen_dpi})")
    plt.xlabel("Index")
    plt.ylabel("Value")

    plt.show()

# Example usage
data = np.random.rand(100)

# Simulate different screen resolutions
create_responsive_plot(data, screen_dpi=96)  # Standard desktop monitor
create_responsive_plot(data, screen_dpi=192)  # High-DPI display
In this example, we create a function that adjusts the figure size based on the screen DPI, ensuring that the plot appears at a consistent physical size across different screen resolutions.
Matplotlib Figure Size and Constrained Layout
Matplotlib’s constrained layout feature can help automatically adjust the layout of your plots, including figure size. Here’s an example:
import matplotlib.pyplot as plt
import numpy as np

plt.figure(figsize=(10, 6), constrained_layout=True)

x = np.linspace(0, 10, 100)
y1 = np.sin(x)
y2 = np.cos(x)

plt.plot(x, y1, label="Sine")
plt.plot(x, y2, label="Cosine")
plt.title("How2Matplotlib.com - Constrained Layout Example")
plt.xlabel("X-axis")
plt.ylabel("Y-axis")
plt.legend()

plt.show()
Output:
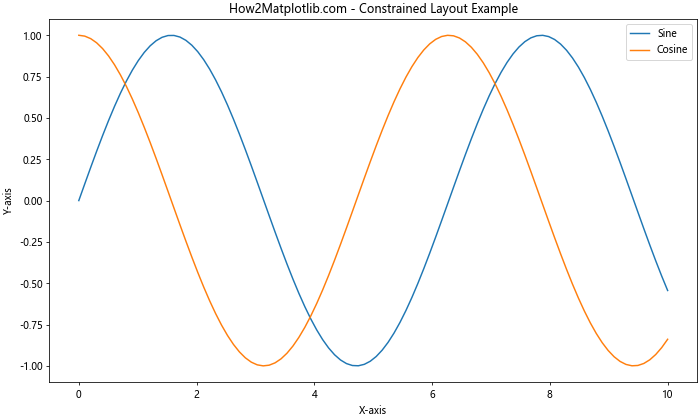
In this example, we use constrained_layout=True when creating the figure. This feature automatically adjusts the layout to prevent overlapping elements and ensure proper spacing.
Matplotlib Figure Size and Gridspec
For more complex layouts, you can use Matplotlib’s GridSpec to create custom grid arrangements and control figure size. Here’s an example:
import matplotlib.pyplot as plt
import matplotlib.gridspec as gridspec
import numpy as np

fig = plt.figure(figsize=(12, 8))
gs = gridspec.GridSpec(2, 3, figure=fig)

ax1 = fig.add_subplot(gs[0, :2])
ax2 = fig.add_subplot(gs[0, 2])
ax3 = fig.add_subplot(gs[1, :])

x = np.linspace(0, 10, 100)

ax1.plot(x, np.sin(x))
ax1.set_title("How2Matplotlib.com - Sine")

ax2.plot(x, np.cos(x))
ax2.set_title("How2Matplotlib.com - Cosine")

ax3.plot(x, np.tan(x))
ax3.set_title("How2Matplotlib.com - Tangent")

plt.tight_layout()
plt.show()
Output:
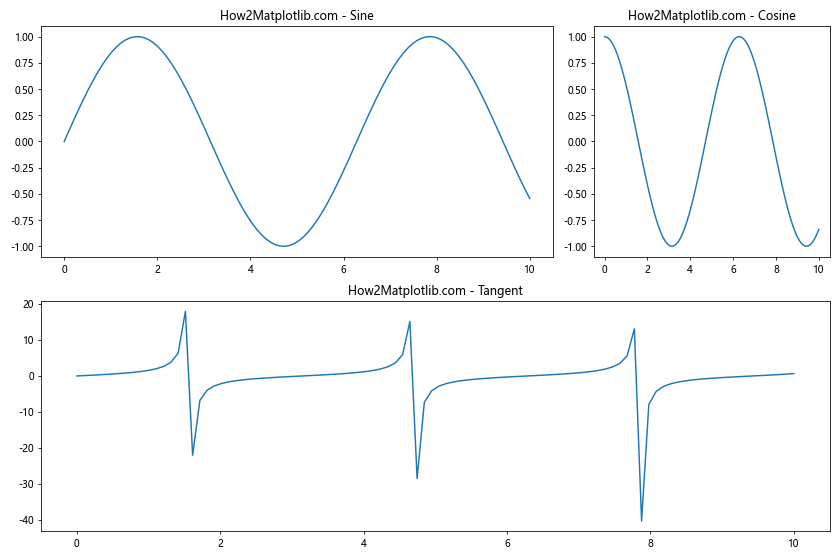
In this example, we use GridSpec to create a custom layout with three subplots of different sizes within a 12×8 inch figure.
Matplotlib Figure Size and Object-Oriented Interface
While we’ve primarily used the pyplot interface in our examples, you can also control figure size using Matplotlib’s object-oriented interface. Here’s an example:
import matplotlib.pyplot as plt
import numpy as np

fig, ax = plt.subplots(figsize=(10, 6))

x = np.linspace(0, 10, 100)
y = np.exp(-x/10) * np.sin(x)

ax.plot(x, y)
ax.set_title("How2Matplotlib.com - Object-Oriented Interface")
ax.set_xlabel("X-axis")
ax.set_ylabel("Y-axis")

plt.show()
Output:
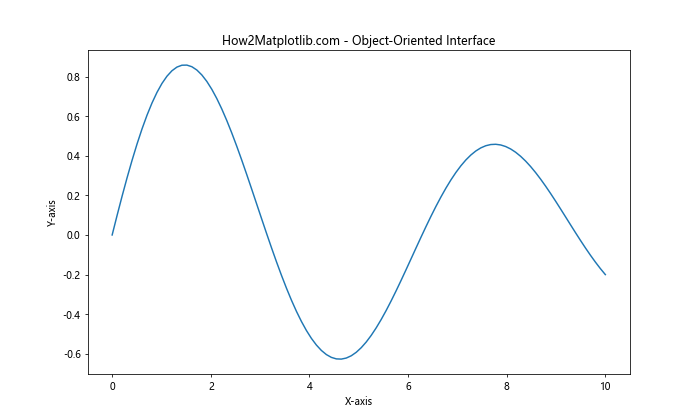
In this example, we use the subplots() function to create both the figure and axes objects, specifying the figure size in the process.
Matplotlib Figure Size and Seaborn Integration
If you’re using Seaborn with Matplotlib, you can still control the figure size. Here’s an example:
import matplotlib.pyplot as plt
import seaborn as sns
import numpy as np

plt.figure(figsize=(12, 6))

# Generate sample data
x = np.random.randn(100)
y = 2*x + np.random.randn(100)

sns.regplot(x=x, y=y)
plt.title("How2Matplotlib.com - Seaborn with Custom Figure Size")
plt.xlabel("X-axis")
plt.ylabel("Y-axis")

plt.show()
Output:
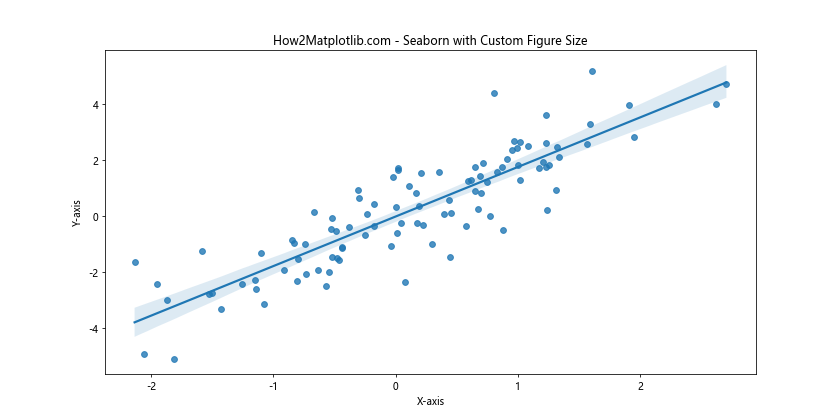
In this example, we set the figure size using Matplotlib’s figure() function before creating a Seaborn plot.
Conclusion
Mastering Matplotlib figure size is essential for creating effective and visually appealing data visualizations. Throughout this comprehensive guide, we’ve explored various aspects of controlling and optimizing figure sizes in Matplotlib. From basic concepts to advanced techniques, you now have a solid foundation for managing figure sizes in your data visualization projects.