How to Master Matplotlib Text: A Comprehensive Guide for Data Visualization
Matplotlib text is an essential component of data visualization in Python. This comprehensive guide will explore the various aspects of working with text in Matplotlib, providing you with the knowledge and skills to create informative and visually appealing plots. From basic text annotations to advanced text formatting and positioning, we’ll cover everything you need to know about Matplotlib text.
Matplotlib Text Recommended Articles
- matplotlib text bold
- matplotlib text box
- matplotlib text color
- matplotlib text rotate
- matplotlib text size
Introduction to Matplotlib Text
Matplotlib text is a crucial element in creating informative and visually appealing data visualizations. It allows you to add labels, titles, annotations, and other textual elements to your plots, enhancing their readability and interpretability. Whether you’re creating simple line plots or complex multi-panel figures, understanding how to work with Matplotlib text is essential for effective data communication.
Let’s start with a simple example of adding text to a Matplotlib plot:
import matplotlib.pyplot as plt

fig, ax = plt.subplots()
ax.set_title("Welcome to how2matplotlib.com")
ax.text(0.5, 0.5, "Matplotlib Text Example", ha='center', va='center')
plt.show()
Output:
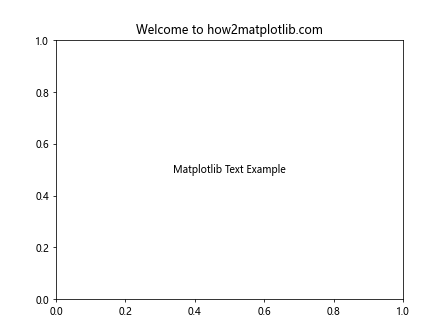
In this example, we create a figure and an axis, set a title using set_title(), and add text to the center of the plot using the text() method. The ha and va parameters control the horizontal and vertical alignment of the text.
Basic Text Elements in Matplotlib
Matplotlib provides several basic text elements that you can use to enhance your plots. These include titles, axis labels, and text annotations. Let’s explore each of these elements in more detail.
Plot Titles
Plot titles are an essential part of any visualization, providing context and summarizing the main message of the plot. In Matplotlib, you can add titles using the set_title() method or the title() function.
import matplotlib.pyplot as plt

fig, ax = plt.subplots()
ax.set_title("Matplotlib Text Tutorial - how2matplotlib.com", fontsize=16, fontweight='bold')
plt.plot([1, 2, 3, 4], [1, 4, 2, 3])
plt.show()
Output:
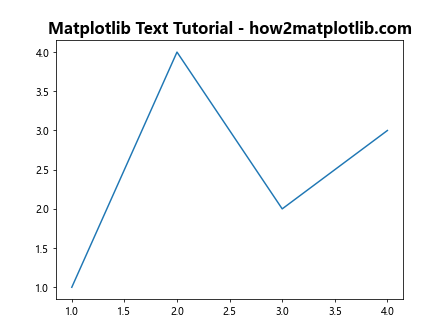
In this example, we set a title for the plot using set_title(), specifying the font size and weight for emphasis.
Axis Labels
Axis labels help viewers understand the units and meaning of the data being displayed. You can add axis labels using the set_xlabel() and set_ylabel() methods.
import matplotlib.pyplot as plt

fig, ax = plt.subplots()
ax.set_xlabel("X-axis Label - how2matplotlib.com")
ax.set_ylabel("Y-axis Label - how2matplotlib.com")
plt.plot([1, 2, 3, 4], [1, 4, 2, 3])
plt.show()
Output:
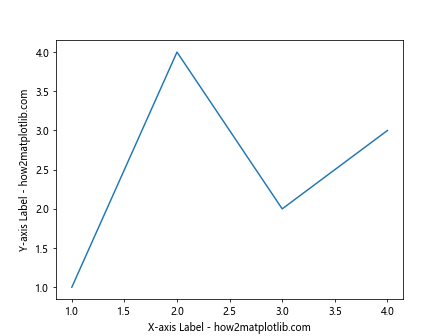
This example demonstrates how to add labels to both the x-axis and y-axis of a plot.
Text Annotations
Text annotations allow you to add explanatory text directly to your plots. You can use the text() method or the annotate() function for more advanced annotations.
import matplotlib.pyplot as plt

fig, ax = plt.subplots()
ax.plot([1, 2, 3, 4], [1, 4, 2, 3])
ax.text(2, 3, "Important Point - how2matplotlib.com", fontsize=12, color='red')
ax.annotate("Annotation - how2matplotlib.com", xy=(3, 2), xytext=(3.5, 2.5),
            arrowprops=dict(facecolor='black', shrink=0.05))
plt.show()
Output:
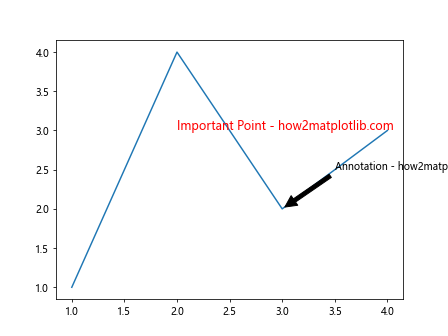
This example shows how to add a simple text annotation and a more advanced annotation with an arrow pointing to a specific point on the plot.
Formatting Matplotlib Text
Matplotlib offers a wide range of formatting options for text elements, allowing you to customize the appearance of your text to match your visualization needs. Let’s explore some of the key formatting options available for Matplotlib text.
Font Properties
You can control various font properties such as font family, size, weight, and style using the fontproperties parameter or individual property setters.
import matplotlib.pyplot as plt
from matplotlib.font_manager import FontProperties

fig, ax = plt.subplots()
font = FontProperties()
font.set_family('serif')
font.set_name('Times New Roman')
font.set_style('italic')
font.set_weight('bold')
font.set_size(14)

ax.text(0.5, 0.5, "Formatted Text - how2matplotlib.com", fontproperties=font, ha='center', va='center')
plt.show()
Output:
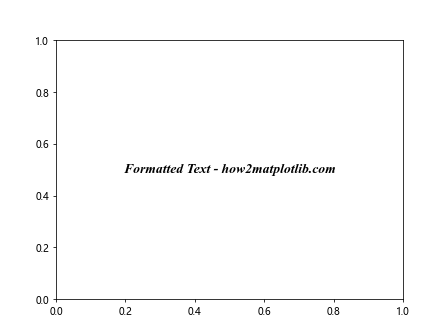
This example demonstrates how to create a FontProperties object and use it to set various font properties for a text element.
Text Color
You can easily change the color of your text using the color parameter or by setting the color property of the text object.
import matplotlib.pyplot as plt

fig, ax = plt.subplots()
ax.text(0.2, 0.8, "Red Text - how2matplotlib.com", color='red')
ax.text(0.2, 0.6, "Green Text - how2matplotlib.com", color='green')
ax.text(0.2, 0.4, "Blue Text - how2matplotlib.com", color='blue')
ax.text(0.2, 0.2, "RGB Text - how2matplotlib.com", color=(0.5, 0.1, 0.5))
plt.show()
Output:
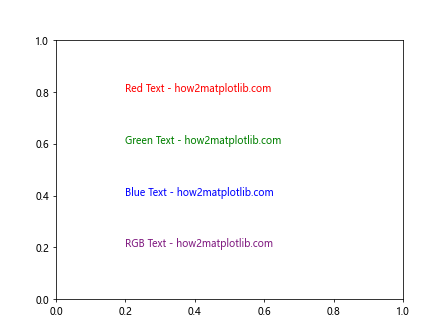
This example shows how to set text color using both color names and RGB values.
Text Alignment
Controlling text alignment is crucial for proper positioning of text elements in your plots. You can use the horizontalalignment (or ha) and verticalalignment (or va) parameters to control text alignment.
import matplotlib.pyplot as plt

fig, ax = plt.subplots()
ax.set_xlim(0, 1)
ax.set_ylim(0, 1)
ax.text(0.5, 0.8, "Center Aligned - how2matplotlib.com", ha='center', va='center')
ax.text(0.5, 0.5, "Left Aligned - how2matplotlib.com", ha='left', va='center')
ax.text(0.5, 0.2, "Right Aligned - how2matplotlib.com", ha='right', va='center')
plt.show()
Output:
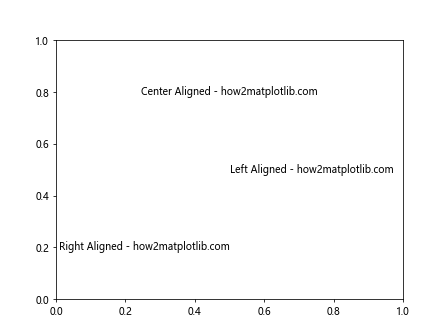
This example demonstrates different horizontal alignment options for text elements.
Advanced Text Positioning
Precise text positioning is often necessary for creating polished and professional-looking visualizations. Matplotlib provides several advanced techniques for positioning text elements.
Text Coordinates
Matplotlib allows you to specify text positions using different coordinate systems, including data coordinates, axes coordinates, and figure coordinates.
import matplotlib.pyplot as plt

fig, ax = plt.subplots()
ax.set_xlim(0, 10)
ax.set_ylim(0, 10)

# Data coordinates
ax.text(5, 5, "Data Coordinates - how2matplotlib.com", ha='center', va='center')

# Axes coordinates
ax.text(0.5, 0.7, "Axes Coordinates - how2matplotlib.com", ha='center', va='center', transform=ax.transAxes)

# Figure coordinates
fig.text(0.5, 0.95, "Figure Coordinates - how2matplotlib.com", ha='center', va='center')

plt.show()
Output:
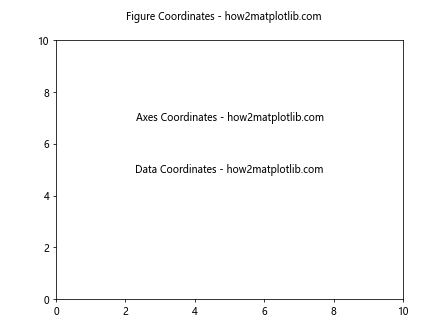
This example shows how to position text using different coordinate systems.
Text Boxes
Text boxes allow you to create framed text elements with customizable backgrounds and borders. You can use the bbox parameter to create text boxes.
import matplotlib.pyplot as plt

fig, ax = plt.subplots()
ax.text(0.5, 0.5, "Text Box - how2matplotlib.com", ha='center', va='center',
        bbox=dict(facecolor='lightblue', edgecolor='blue', alpha=0.7))
plt.show()
Output:
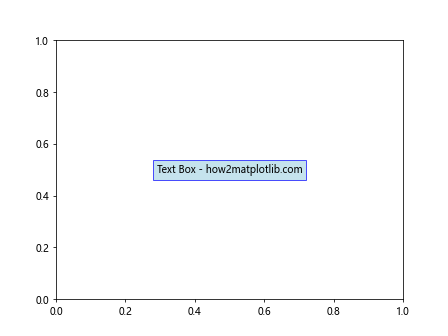
This example demonstrates how to create a simple text box with a light blue background and blue border.
Text Rotation
Rotating text can be useful for creating angled labels or fitting long text in tight spaces. You can use the rotation parameter to rotate text elements.
import matplotlib.pyplot as plt

fig, ax = plt.subplots()
ax.text(0.5, 0.8, "Rotated Text - how2matplotlib.com", ha='center', va='center', rotation=45)
ax.text(0.5, 0.5, "Vertical Text - how2matplotlib.com", ha='center', va='center', rotation='vertical')
plt.show()
Output:
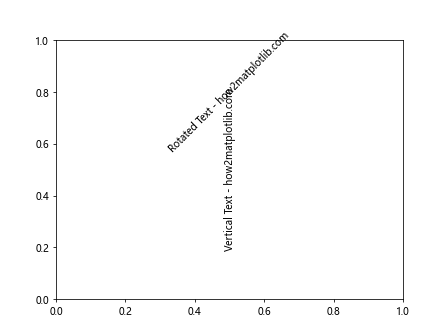
This example shows how to create rotated and vertical text elements.
Working with LaTeX in Matplotlib Text
Matplotlib supports LaTeX rendering for text elements, allowing you to include mathematical equations and symbols in your plots. To use LaTeX, you need to enclose your LaTeX code in dollar signs ($).
import matplotlib.pyplot as plt

fig, ax = plt.subplots()
ax.text(0.5, 0.7, r"$\alpha + \beta = \gamma$ - how2matplotlib.com", ha='center', va='center', fontsize=16)
ax.text(0.5, 0.3, r"$E = mc^2$ - how2matplotlib.com", ha='center', va='center', fontsize=16)
plt.show()
Output:
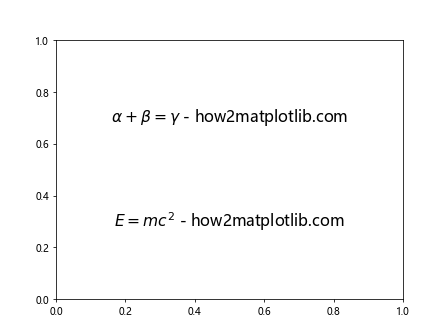
This example demonstrates how to include LaTeX equations in your Matplotlib text elements.
Text Effects and Styling
Matplotlib offers various text effects and styling options to make your text elements stand out and enhance the overall appearance of your plots.
Text with Shadows
Adding shadows to text can create a 3D effect and improve readability, especially when text overlaps with plot elements.
import matplotlib.pyplot as plt
from matplotlib.patheffects import withStroke

fig, ax = plt.subplots()
text = ax.text(0.5, 0.5, "Shadow Text - how2matplotlib.com", ha='center', va='center', fontsize=20)
text.set_path_effects([withStroke(linewidth=3, foreground='gray')])
plt.show()
Output:
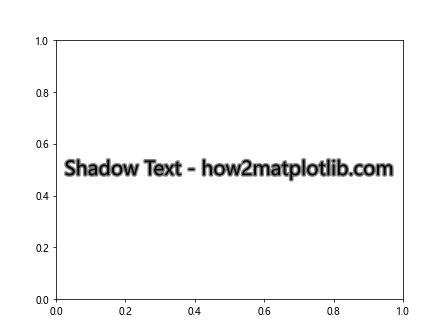
This example shows how to add a shadow effect to text using path effects.
Outlined Text
Outlined text can be useful for creating visually striking labels or titles.
import matplotlib.pyplot as plt
from matplotlib.patheffects import Stroke, Normal

fig, ax = plt.subplots()
text = ax.text(0.5, 0.5, "Outlined Text - how2matplotlib.com", ha='center', va='center', fontsize=20)
text.set_path_effects([Stroke(linewidth=3, foreground='black'), Normal()])
plt.show()
Output:
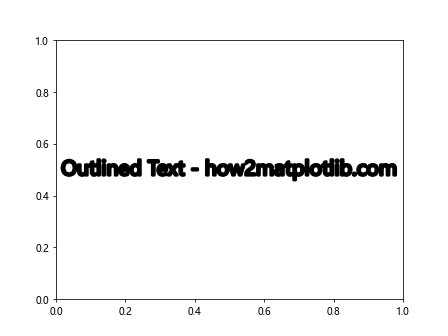
This example demonstrates how to create outlined text using path effects.
Text Annotations with Arrows
Annotations with arrows are useful for pointing out specific features or data points in your plots. Matplotlib provides the annotate() function for creating advanced annotations with arrows.
import matplotlib.pyplot as plt

fig, ax = plt.subplots()
ax.plot([1, 2, 3, 4], [1, 4, 2, 3])
ax.annotate("Peak - how2matplotlib.com", xy=(2, 4), xytext=(3, 4.5),
            arrowprops=dict(facecolor='black', shrink=0.05),
            fontsize=12, ha='center')
plt.show()
Output:
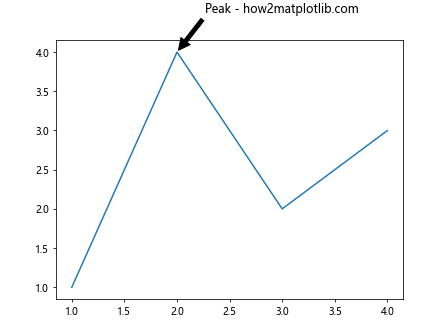
This example shows how to create an annotation with an arrow pointing to a specific point on the plot.
Multiline Text
Sometimes you need to display multiple lines of text in a single text element. Matplotlib allows you to create multiline text using newline characters or by passing a list of strings.
import matplotlib.pyplot as plt

fig, ax = plt.subplots()
ax.text(0.5, 0.5, "Line 1 - how2matplotlib.com\nLine 2 - how2matplotlib.com\nLine 3 - how2matplotlib.com",
        ha='center', va='center', fontsize=12)
plt.show()
Output:
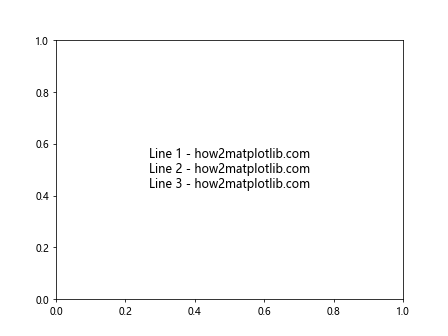
This example demonstrates how to create multiline text using newline characters.
Text Wrapping
For long text that doesn’t fit within the desired width, you can use text wrapping to automatically break the text into multiple lines.
import matplotlib.pyplot as plt
import textwrap

fig, ax = plt.subplots()
long_text = "This is a long text that needs to be wrapped - how2matplotlib.com"
wrapped_text = textwrap.fill(long_text, width=20)
ax.text(0.5, 0.5, wrapped_text, ha='center', va='center', fontsize=12)
plt.show()
Output:
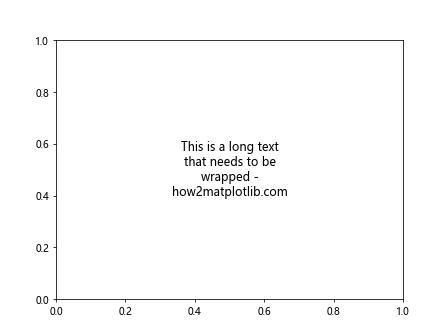
This example shows how to use the textwrap module to wrap long text.
Text in Subplots
When working with multiple subplots, you may need to add text elements to individual subplots or to the entire figure.
import matplotlib.pyplot as plt

fig, (ax1, ax2) = plt.subplots(1, 2, figsize=(10, 4))
fig.suptitle("Matplotlib Text in Subplots - how2matplotlib.com", fontsize=16)

ax1.set_title("Subplot 1")
ax1.text(0.5, 0.5, "Text in Subplot 1 - how2matplotlib.com", ha='center', va='center')

ax2.set_title("Subplot 2")
ax2.text(0.5, 0.5, "Text in Subplot 2 - how2matplotlib.com", ha='center', va='center')

plt.tight_layout()
plt.show()
Output:
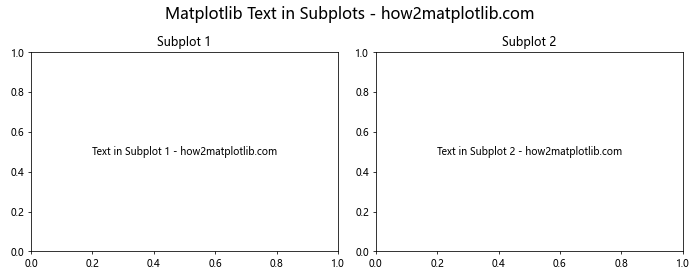
This example demonstrates how to add text to individual subplots and a main title to the entire figure.
Text with Custom Fonts
Matplotlib allows you to use custom fonts in your text elements, giving you more control over the visual style of your plots.
import matplotlib.pyplot as plt
from matplotlib.font_manager import FontProperties

fig, ax = plt.subplots()
custom_font = FontProperties(fname="path/to/your/custom/font.ttf")
ax.text(0.5, 0.5, "Custom Font Text - how2matplotlib.com", ha='center', va='center',
        fontproperties=custom_font, fontsize=16)
plt.show()
This example shows how to use a custom font in your text elements. Note that you’ll need to replace “path/to/your/custom/font.ttf” with the actual path to your custom font file.
Text with Markers
You can combine text elements with markers to create labeled points or legends directly on your plot.
import matplotlib.pyplot as plt

fig, ax = plt.subplots()
ax.plot([1, 2, 3, 4], [1, 4, 2, 3], 'ro')
for x, y in zip([1, 2, 3, 4], [1, 4, 2, 3]):
    ax.annotate(f"({x}, {y}) - how2matplotlib.com", (x, y), xytext=(5, 5), textcoords='offset points')
plt.show()
Output:
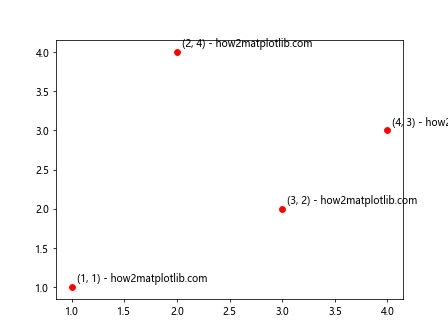
This example demonstrates how to add text labels to data points on a scatter plot.
Animated Text
For dynamic visualizations, you can create animated text using Matplotlib’s animation capabilities.
import matplotlib.pyplot as plt
import matplotlib.animation as animation

fig, ax = plt.subplots()
text = ax.text(0.5, 0.5, "", ha='center', va='center', fontsize=20)

def animate(frame):
    text.set_text(f"Frame {frame} - how2matplotlib.com")
    return text,

ani = animation.FuncAnimation(fig, animate, frames=range(60), interval=100, blit=True)
plt.show()
Output:
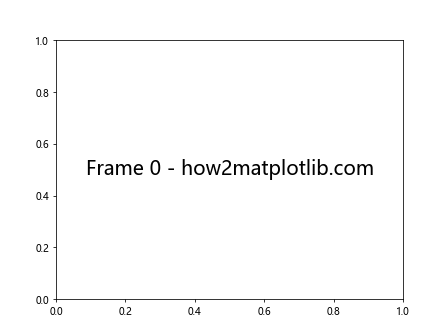
This example creates a simple animation where the text changes in each frame.
Text Clipping and Masking
Sometimes you may want to clip or mask text to fit within certain boundaries or create special effects.
import matplotlib.pyplot as plt
import matplotlib.patches as patches

fig, ax = plt.subplots()
circle = patches.Circle((0.5, 0.5), 0.4, transform=ax.transAxes, facecolor='lightblue', edgecolor='blue')
ax.add_patch(circle)
text = ax.text(0.5, 0.5, "Clipped Text - how2matplotlib.com", ha='center', va='center', fontsize=16)
text.set_clip_path(circle)
plt.show()
Output:
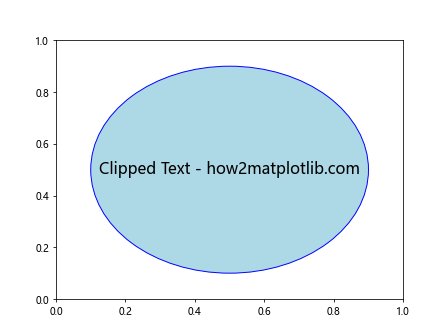
This example demonstrates how to clip text within a circular boundary.
Text with Gradients
While Matplotlib doesn’t directly support text gradients, you can create a gradient effect by overlaying multiple text elements with different colors and opacities.
import matplotlib.pyplot as plt
import numpy as np

fig, ax = plt.subplots()
x = 0.5
y = 0.5
text = "Gradient Text - how2matplotlib.com"
for i, color in enumerate(['red', 'green', 'blue']):
    ax.text(x, y, text, ha='center', va='center', fontsize=20, color=color, alpha=0.3 + i*0.2)
plt.show()
Output:
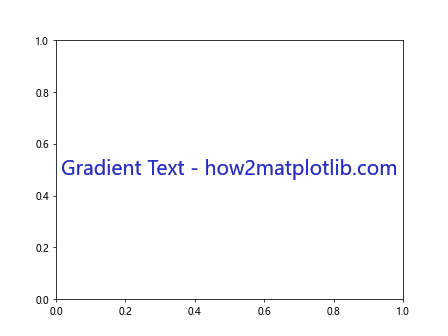
This example creates a simple gradient effect by overlaying text with different colors and opacities.
Matplotlib text Conclusion
Matplotlib text is a powerful tool for enhancing your data visualizations and making them more informative and visually appealing. In this comprehensive guide, we’ve explored various aspects of working with text in Matplotlib, from basic text elements to advanced formatting and positioning techniques.
We’ve covered topics such as:
- Basic text elements (titles, labels, annotations)
- Text formatting (font properties, color, alignment)
- Advanced text positioning
- LaTeX support
- Text effects and styling
- Annotations with arrows
- Multiline text and text wrapping
- Text in subplots
- Custom fonts
- Text with markers
- Animated text
- Text clipping and masking
- Text with gradient effects
By mastering these techniques, you’ll be able to create more effective and professional-looking visualizations using Matplotlib. Remember to experiment with different text properties and combinations to find the best way to convey your data and message.
As you continue to work with Matplotlib text, keep in mind that the key to creating great visualizations is finding the right balance between informative content and visual appeal. Use text elements judiciously to enhance your plots without overwhelming them.
Here are some final tips for working with Matplotlib text:
- Always consider the readability of your text. Choose appropriate font sizes and colors that contrast well with the background.
- Use consistent text styling throughout your visualization to maintain a professional appearance.
- Take advantage of LaTeX rendering for mathematical equations and symbols when needed.
- Experiment with different text positioning techniques to find the most effective layout for your data.
- Don’t be afraid to combine multiple text techniques to create unique and engaging visualizations.
With practice and experimentation, you’ll become proficient in using Matplotlib text to create stunning and informative data visualizations. Remember to refer back to this guide and the Matplotlib documentation as you continue to explore the possibilities of text in your plots.
By mastering Matplotlib text, you’ll be able to create visualizations that not only present data accurately but also tell compelling stories and effectively communicate your insights to your audience. Whether you’re creating simple plots or complex multi-panel figures, the techniques covered in this guide will help you make the most of Matplotlib’s text capabilities.
As you continue to develop your skills with Matplotlib text, consider exploring more advanced topics such as:
- Creating custom text effects using path effects
- Implementing interactive text elements in your plots
- Integrating text with other Matplotlib features like colorbars and legends
- Optimizing text rendering performance for large datasets
- Developing custom text artists for specialized visualization needs
Remember that effective use of text in data visualization is both an art and a science. While the technical aspects are important, don’t forget to consider the overall design and user experience of your plots. With practice and attention to detail, you’ll be able to create visualizations that are not only informative but also visually stunning and engaging for your audience.
In conclusion, Matplotlib text is a versatile and powerful tool that can significantly enhance your data visualizations. By mastering the techniques covered in this guide, you’ll be well-equipped to create professional-quality plots that effectively communicate your data and insights. Keep experimenting, learning, and refining your skills to become a true expert in Matplotlib text and data visualization.