How to Adjust Matplotlib Text Size: A Comprehensive Guide
Matplotlib text size is a crucial aspect of data visualization that can significantly impact the readability and overall appearance of your plots. In this comprehensive guide, we’ll explore various techniques to adjust matplotlib text size, ensuring your visualizations are clear, professional, and easy to understand. From setting font sizes for titles and labels to customizing text properties for annotations and legends, we’ll cover everything you need to know about controlling matplotlib text size in your plots.
Understanding Matplotlib Text Size Basics
Before diving into specific techniques, it’s essential to understand the basics of matplotlib text size. Matplotlib provides several ways to control text size, including:
- Using point sizes (e.g., 12, 14, 16)
- Using relative sizes (e.g., ‘small’, ‘medium’, ‘large’)
- Using scaling factors (e.g., 1.2, 1.5, 2.0)
Let’s start with a simple example to demonstrate how to set the matplotlib text size for a plot title:
import matplotlib.pyplot as plt

plt.figure(figsize=(8, 6))
plt.plot([1, 2, 3, 4], [1, 4, 2, 3])
plt.title("How2Matplotlib.com: Basic Title", fontsize=16)
plt.xlabel("X-axis")
plt.ylabel("Y-axis")
plt.show()
Output:
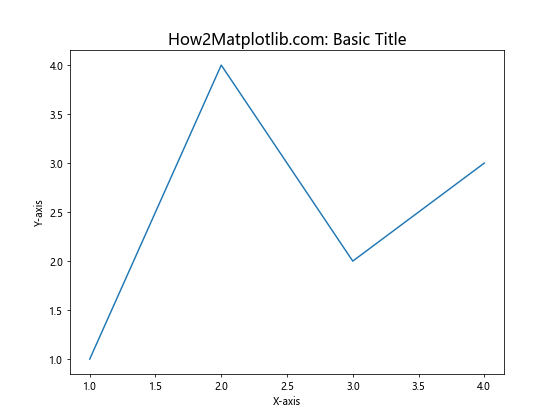
In this example, we set the matplotlib text size of the title to 16 points using the fontsize parameter. This is a common way to adjust text size in matplotlib, and we’ll explore more advanced techniques throughout this article.
Setting Matplotlib Text Size for Axes Labels
Adjusting the matplotlib text size for axes labels is crucial for creating clear and readable plots. You can set the font size for both x and y-axis labels using the xlabel() and ylabel() functions or by modifying the tick_params(). Here’s an example:
import matplotlib.pyplot as plt

plt.figure(figsize=(10, 6))
plt.plot([1, 2, 3, 4], [1, 4, 2, 3])
plt.title("How2Matplotlib.com: Customized Axes Labels", fontsize=18)
plt.xlabel("X-axis", fontsize=14)
plt.ylabel("Y-axis", fontsize=14)
plt.tick_params(axis='both', which='major', labelsize=12)
plt.show()
Output:
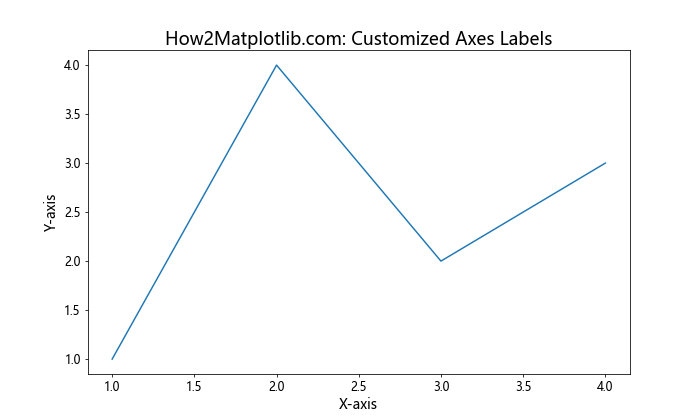
In this example, we set the matplotlib text size for the x and y-axis labels to 14 points and the tick labels to 12 points. This creates a hierarchy of text sizes, making the plot more visually appealing and easier to read.
Adjusting Matplotlib Text Size for Legends
Legends play a crucial role in helping viewers understand the different elements in your plot. Customizing the matplotlib text size for legends can greatly improve the overall appearance of your visualization. Here’s how you can adjust the legend text size:
import matplotlib.pyplot as plt

plt.figure(figsize=(10, 6))
plt.plot([1, 2, 3, 4], [1, 4, 2, 3], label="Line 1")
plt.plot([1, 2, 3, 4], [3, 2, 4, 1], label="Line 2")
plt.title("How2Matplotlib.com: Legend with Custom Text Size", fontsize=18)
plt.xlabel("X-axis", fontsize=14)
plt.ylabel("Y-axis", fontsize=14)
plt.legend(fontsize=12)
plt.show()
Output:
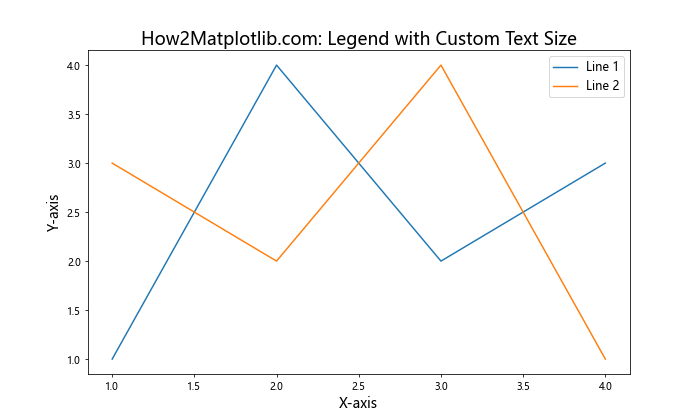
In this example, we set the matplotlib text size for the legend to 12 points using the fontsize parameter in the legend() function. This ensures that the legend text is easily readable without overpowering the main plot elements.
Controlling Matplotlib Text Size for Annotations
Annotations are often used to highlight specific points or regions in a plot. Adjusting the matplotlib text size for annotations can help draw attention to important information without cluttering the visualization. Here’s an example of how to customize annotation text size:
import matplotlib.pyplot as plt

plt.figure(figsize=(10, 6))
x = [1, 2, 3, 4]
y = [1, 4, 2, 3]
plt.plot(x, y)
plt.title("How2Matplotlib.com: Annotation with Custom Text Size", fontsize=18)
plt.xlabel("X-axis", fontsize=14)
plt.ylabel("Y-axis", fontsize=14)
plt.annotate("Important Point", xy=(2, 4), xytext=(3, 4.5),
             arrowprops=dict(facecolor='black', shrink=0.05),
             fontsize=12)
plt.show()
Output:
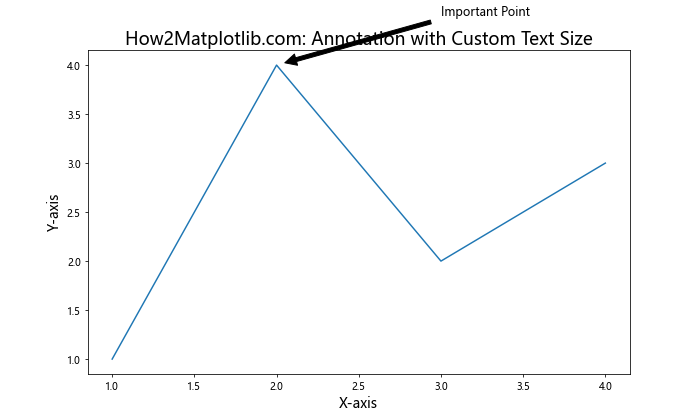
In this example, we set the matplotlib text size for the annotation to 12 points using the fontsize parameter in the annotate() function. This ensures that the annotation text is clearly visible and properly sized relative to other plot elements.
Using rcParams to Set Default Matplotlib Text Size
If you want to set a default matplotlib text size for all elements in your plots, you can use the rcParams dictionary. This approach is particularly useful when creating multiple plots with consistent text sizes. Here’s an example:
import matplotlib.pyplot as plt

plt.rcParams.update({'font.size': 14})

plt.figure(figsize=(10, 6))
plt.plot([1, 2, 3, 4], [1, 4, 2, 3])
plt.title("How2Matplotlib.com: Default Text Size with rcParams")
plt.xlabel("X-axis")
plt.ylabel("Y-axis")
plt.show()
Output:
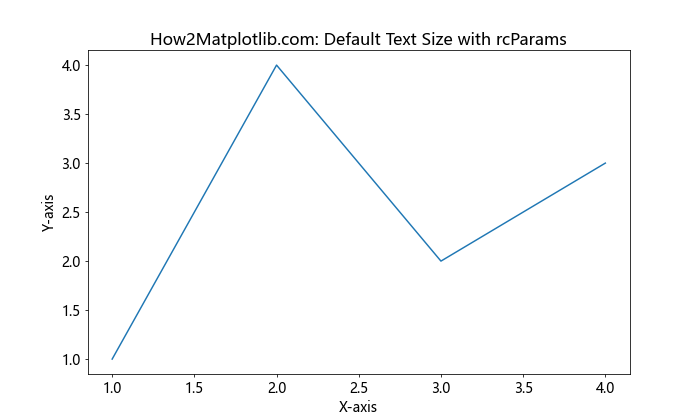
In this example, we use plt.rcParams.update() to set the default font size to 14 points for all text elements in the plot. This approach saves time and ensures consistency across multiple plots.
Scaling Matplotlib Text Size Relative to Figure Size
Sometimes, you may want to scale the matplotlib text size relative to the figure size. This can be particularly useful when creating plots that need to be resized for different display contexts. Here’s an example of how to achieve this:
import matplotlib.pyplot as plt

def scale_text_size(fig, base_size=12):
    fig_width, fig_height = fig.get_size_inches()
    scale_factor = (fig_width * fig_height) / (8 * 6)  # Assuming 8x6 is the base size
    return base_size * scale_factor

fig, ax = plt.subplots(figsize=(10, 6))
ax.plot([1, 2, 3, 4], [1, 4, 2, 3])

text_size = scale_text_size(fig)
ax.set_title("How2Matplotlib.com: Scaled Text Size", fontsize=text_size * 1.2)
ax.set_xlabel("X-axis", fontsize=text_size)
ax.set_ylabel("Y-axis", fontsize=text_size)
ax.tick_params(axis='both', which='major', labelsize=text_size * 0.8)

plt.show()
Output:
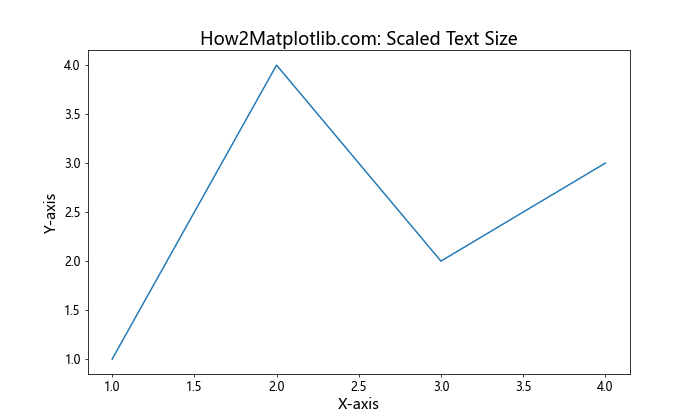
In this example, we define a scale_text_size() function that calculates a scaling factor based on the figure size. We then use this scaled size to set the matplotlib text size for various plot elements, ensuring that the text remains proportional to the figure size.
Adjusting Matplotlib Text Size for Subplots
When working with subplots, you may want to adjust the matplotlib text size for individual subplot titles and labels. Here’s an example of how to customize text sizes in a subplot layout:
import matplotlib.pyplot as plt

fig, (ax1, ax2) = plt.subplots(1, 2, figsize=(12, 5))

ax1.plot([1, 2, 3, 4], [1, 4, 2, 3])
ax1.set_title("How2Matplotlib.com: Subplot 1", fontsize=14)
ax1.set_xlabel("X-axis", fontsize=12)
ax1.set_ylabel("Y-axis", fontsize=12)

ax2.plot([1, 2, 3, 4], [3, 2, 4, 1])
ax2.set_title("How2Matplotlib.com: Subplot 2", fontsize=14)
ax2.set_xlabel("X-axis", fontsize=12)
ax2.set_ylabel("Y-axis", fontsize=12)

fig.suptitle("How2Matplotlib.com: Subplots with Custom Text Sizes", fontsize=16)
plt.tight_layout()
plt.show()
Output:
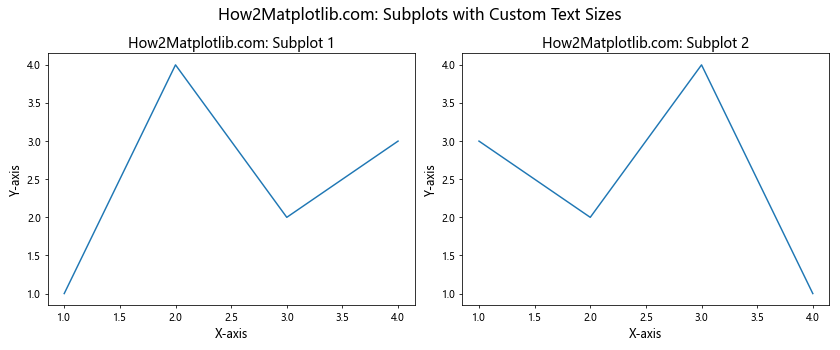
In this example, we set different matplotlib text sizes for the main title, subplot titles, and axis labels. This approach allows for a clear hierarchy of information in the subplot layout.
Using LaTeX Formatting with Custom Matplotlib Text Size
Matplotlib supports LaTeX formatting for text elements, which can be particularly useful for displaying mathematical equations or symbols. Here’s an example of how to use LaTeX formatting with custom text sizes:
import matplotlib.pyplot as plt

plt.figure(figsize=(10, 6))
plt.plot([1, 2, 3, 4], [1, 4, 2, 3])
plt.title(r"How2Matplotlib.com: $\mathcal{O}(n\log n)$ Complexity", fontsize=18)
plt.xlabel(r"$x$ values", fontsize=14)
plt.ylabel(r"$f(x) = x^2$", fontsize=14)
plt.text(2, 3, r"$\sum_{i=1}^n i = \frac{n(n+1)}{2}$", fontsize=16)
plt.show()
Output:
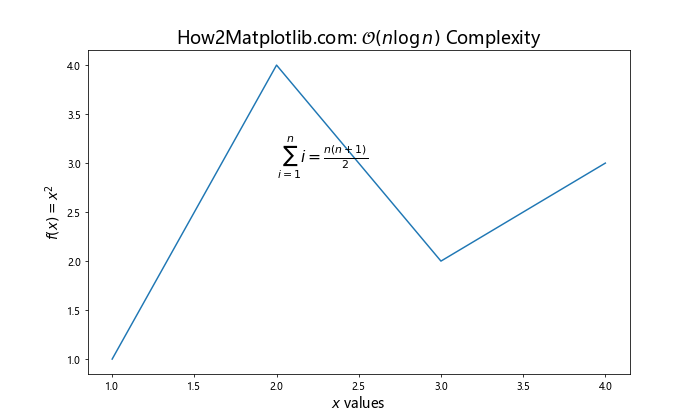
In this example, we use LaTeX formatting for the title, axis labels, and an additional text element. The fontsize parameter is used to set the matplotlib text size for each element, ensuring that the LaTeX-formatted text is properly sized and readable.
Adjusting Matplotlib Text Size for Colorbar Labels
When working with colormaps and colorbars, it’s important to ensure that the colorbar labels are easily readable. Here’s an example of how to adjust the matplotlib text size for colorbar labels:
import matplotlib.pyplot as plt
import numpy as np

plt.figure(figsize=(10, 6))
data = np.random.rand(10, 10)
im = plt.imshow(data, cmap='viridis')
cbar = plt.colorbar(im)
cbar.set_label("How2Matplotlib.com: Values", fontsize=14)
cbar.ax.tick_params(labelsize=12)
plt.title("How2Matplotlib.com: Colorbar with Custom Text Size", fontsize=18)
plt.show()
Output:
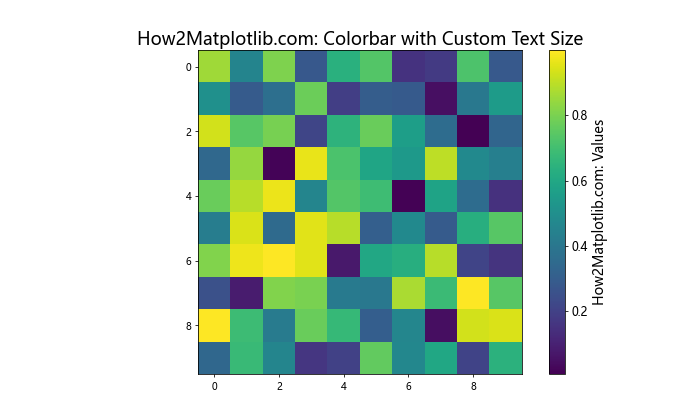
In this example, we set the matplotlib text size for the colorbar label to 14 points and the tick labels to 12 points. This ensures that the colorbar information is clearly visible and properly sized relative to the main plot.
Using Different Font Families with Custom Matplotlib Text Size
Matplotlib allows you to use different font families for your plot text. Combining custom font families with specific text sizes can help create unique and visually appealing plots. Here’s an example:
import matplotlib.pyplot as plt

plt.figure(figsize=(10, 6))
plt.plot([1, 2, 3, 4], [1, 4, 2, 3])
plt.title("How2Matplotlib.com: Custom Fonts and Sizes", fontsize=18, fontfamily='serif')
plt.xlabel("X-axis", fontsize=14, fontfamily='sans-serif')
plt.ylabel("Y-axis", fontsize=14, fontfamily='sans-serif')
plt.text(2, 3, "Important Note", fontsize=12, fontfamily='monospace')
plt.show()
Output:
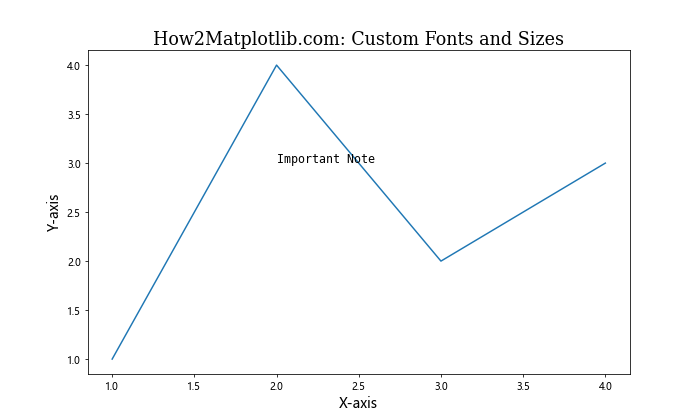
In this example, we use different font families (serif, sans-serif, and monospace) for various text elements, each with its own matplotlib text size. This combination of fonts and sizes can help create visual hierarchy and improve the overall aesthetics of your plot.
Adjusting Matplotlib Text Size for 3D Plots
When working with 3D plots in matplotlib, it’s important to adjust text sizes to ensure readability from different viewing angles. Here’s an example of how to customize text sizes in a 3D plot:
import matplotlib.pyplot as plt
import numpy as np

fig = plt.figure(figsize=(10, 8))
ax = fig.add_subplot(111, projection='3d')

x = np.arange(-5, 5, 0.25)
y = np.arange(-5, 5, 0.25)
X, Y = np.meshgrid(x, y)
Z = np.sin(np.sqrt(X**2 + Y**2))

surf = ax.plot_surface(X, Y, Z, cmap='viridis')

ax.set_title("How2Matplotlib.com: 3D Plot with Custom Text Sizes", fontsize=16)
ax.set_xlabel("X-axis", fontsize=12)
ax.set_ylabel("Y-axis", fontsize=12)
ax.set_zlabel("Z-axis", fontsize=12)

cbar = fig.colorbar(surf)
cbar.set_label("How2Matplotlib.com: Values", fontsize=12)
cbar.ax.tick_params(labelsize=10)

plt.show()
Output:
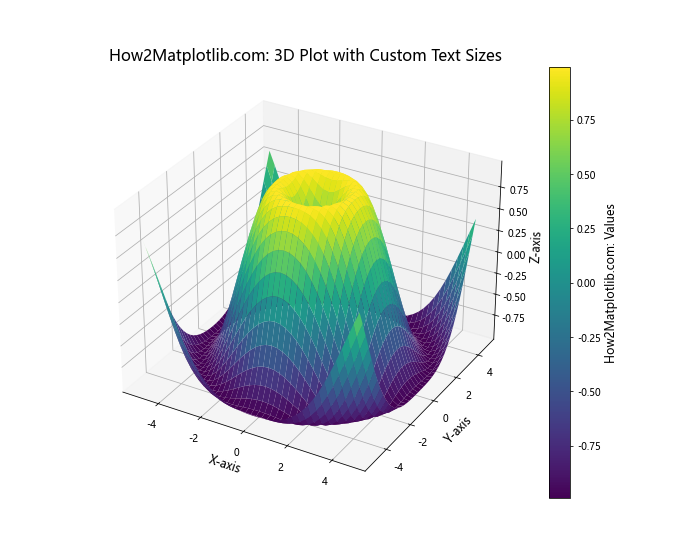
In this example, we adjust the matplotlib text size for the title, axis labels, and colorbar to ensure that all text elements are clearly visible in the 3D plot.
Creating a Custom Style with Predefined Matplotlib Text Sizes
If you frequently create plots with specific text size requirements, you can create a custom style that defines preset matplotlib text sizes for various elements. Here’s an example of how to create and use a custom style:
import matplotlib.pyplot as plt

custom_style = {
    'font.size': 12,
    'axes.titlesize': 18,
    'axes.labelsize': 14,
    'xtick.labelsize': 10,
    'ytick.labelsize': 10,
    'legend.fontsize': 12,
    'figure.titlesize': 20
}

plt.style.use('default')
plt.rcParams.update(custom_style)

plt.figure(figsize=(10, 6))
plt.plot([1, 2, 3, 4], [1, 4, 2, 3], label="Line 1")
plt.plot([1, 2, 3, 4], [3, 2, 4, 1], label="Line 2")
plt.title("How2Matplotlib.com: Custom Style with Predefined Text Sizes")
plt.xlabel("X-axis")
plt.ylabel("Y-axis")
plt.legend()
plt.show()
Output:
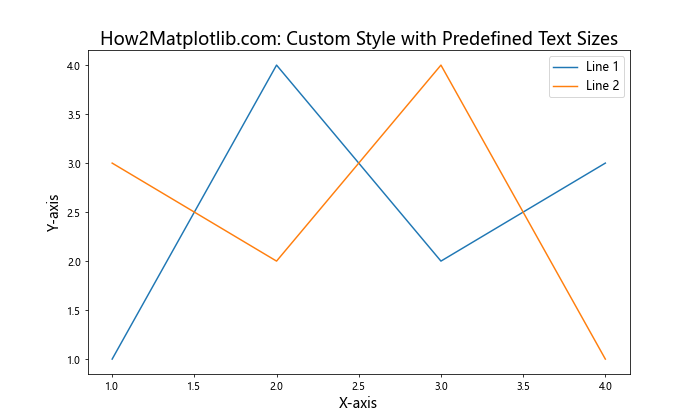
In this example, we define a custom style dictionary with preset matplotlib text sizes for various plot elements. By updating the rcParams with this custom style, we can easily apply consistent text sizes across multiple plots.
Adjusting Matplotlib Text Size for Polar Plots
Polar plots require special consideration when it comes to text size, as the radial and angular labels may need different sizing. Here’s an example of how to customize text sizes in a polar plot:
import matplotlib.pyplot as plt
import numpy as np

plt.figure(figsize=(8, 8))
ax = plt.subplot(111, projection='polar')

r = np.arange(0, 2, 0.01)
theta = 2 * np.pi * r

ax.plot(theta, r)
ax.set_title("How2Matplotlib.com: Polar Plot with Custom Text Sizes", fontsize=16)
ax.set_rticks([0.5, 1, 1.5])
ax.set_rlabel_position(22.5)
ax.tick_params(axis='both', which='major', labelsize=12)

plt.show()
Output:
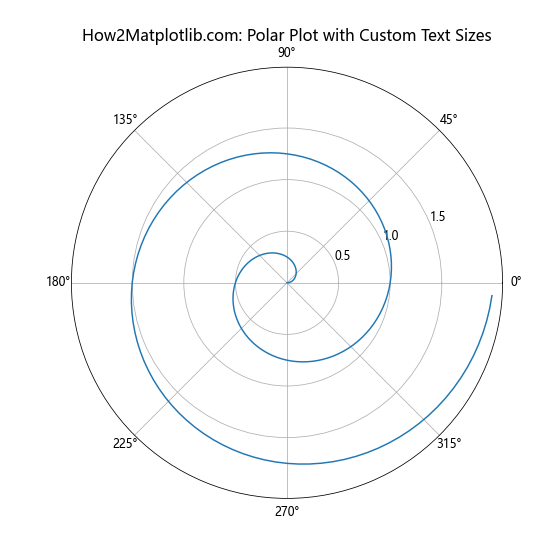
In this example, we adjust the matplotlib text size for the title and tick labels to ensure that all text elements are clearly visible in the polar plot.
Using Text Size to Create Visual Hierarchy
By carefully adjusting the matplotlib text size of different elements, you can create a visual hierarchy that guides the viewer’s attention. Here’s an example that demonstrates this concept:
import matplotlib.pyplot as plt

plt.figure(figsize=(12, 8))
plt.plot([1, 2, 3, 4], [1, 4, 2, 3], label="Data")
plt.title("How2Matplotlib.com: Visual Hierarchy with Text Sizes", fontsize=24)
plt.xlabel("X-axis", fontsize=16)
plt.ylabel("Y-axis", fontsize=16)
plt.text(2, 3.5, "Key Observation", fontsize=20, fontweight='bold')
plt.text(3, 2, "Secondary Note", fontsize=14)
plt.text(1.5, 1.5, "Additional Info", fontsize=10)
plt.legend(fontsize=12)
plt.tick_params(axis='both', which='major', labelsize=12)
plt.show()
Output:
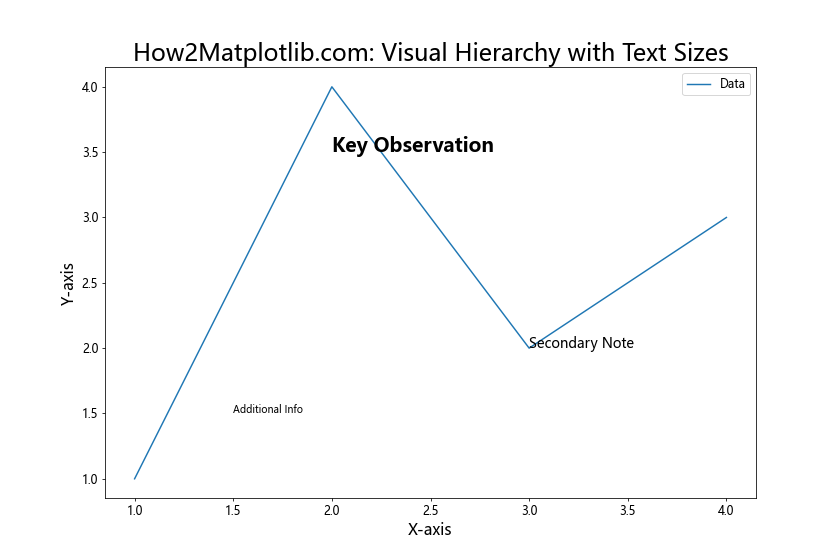
In this example, we use different matplotlib text sizes to create a clear visual hierarchy. The title has the largest font size, followed by the key observation, axis labels, legend, and finally, the smallest text for additional information. This approach helps guide the viewer’s eye through the most important elements of the plot.
Adjusting Matplotlib Text Size for Different Output Formats
When creating plots for different output formats (e.g., screen display, print, or web), you may need to adjust the matplotlib text size accordingly. Here’s an example of how to create two versions of the same plot with different text sizes:
import matplotlib.pyplot as plt

def create_plot(dpi, title_suffix):
    plt.figure(figsize=(8, 6), dpi=dpi)
    plt.plot([1, 2, 3, 4], [1, 4, 2, 3])
    plt.title(f"How2Matplotlib.com: {title_suffix}", fontsize=16)
    plt.xlabel("X-axis", fontsize=12)
    plt.ylabel("Y-axis", fontsize=12)
    plt.tick_params(axis='both', which='major', labelsize=10)
    plt.tight_layout()

# Version for screen display
create_plot(72, "Screen Version")
plt.show()

# Version for print (higher DPI)
create_plot(300, "Print Version")
plt.savefig("how2matplotlib_print_version.png", dpi=300)
In this example, we create two versions of the same plot: one for screen display with a lower DPI, and another for print with a higher DPI. The matplotlib text sizes remain the same, but the higher DPI version will appear sharper and more suitable for printing.
Using Relative Text Sizes with plt.setp()
The plt.setp() function allows you to set properties for multiple plot elements at once, including matplotlib text size. Here’s an example of how to use relative text sizes with plt.setp():
import matplotlib.pyplot as plt

fig, (ax1, ax2) = plt.subplots(1, 2, figsize=(12, 5))

ax1.plot([1, 2, 3, 4], [1, 4, 2, 3])
ax2.plot([1, 2, 3, 4], [3, 2, 4, 1])

plt.setp((ax1, ax2), xlabel="X-axis", ylabel="Y-axis")
plt.setp((ax1.title, ax2.title), text="How2Matplotlib.com: Subplot", fontsize='large')
plt.setp((ax1.xaxis.label, ax1.yaxis.label, ax2.xaxis.label, ax2.yaxis.label), fontsize='medium')
plt.setp((ax1.get_xticklabels(), ax1.get_yticklabels(), ax2.get_xticklabels(), ax2.get_yticklabels()), fontsize='small')

plt.tight_layout()
plt.show()
Output:
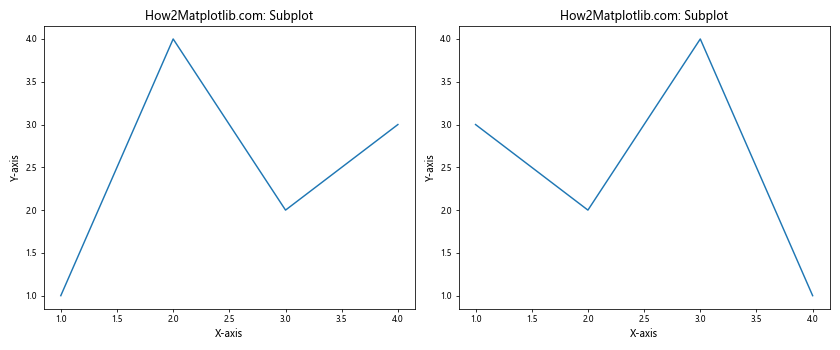
In this example, we use plt.setp() to set relative font sizes (‘large’, ‘medium’, ‘small’) for different text elements across multiple subplots. This approach allows for easy adjustment of text sizes while maintaining proper proportions.
Adjusting Matplotlib Text Size for Time Series Plots
When working with time series data, it’s important to ensure that date labels are readable. Here’s an example of how to adjust matplotlib text size for a time series plot:
import matplotlib.pyplot as plt
import pandas as pd

# Create sample time series data
dates = pd.date_range(start='2023-01-01', end='2023-12-31', freq='D')
values = range(len(dates))
df = pd.DataFrame({'Date': dates, 'Value': values})

plt.figure(figsize=(12, 6))
plt.plot(df['Date'], df['Value'])
plt.title("How2Matplotlib.com: Time Series Plot", fontsize=18)
plt.xlabel("Date", fontsize=14)
plt.ylabel("Value", fontsize=14)
plt.xticks(rotation=45, ha='right', fontsize=10)
plt.yticks(fontsize=10)
plt.tight_layout()
plt.show()
Output:
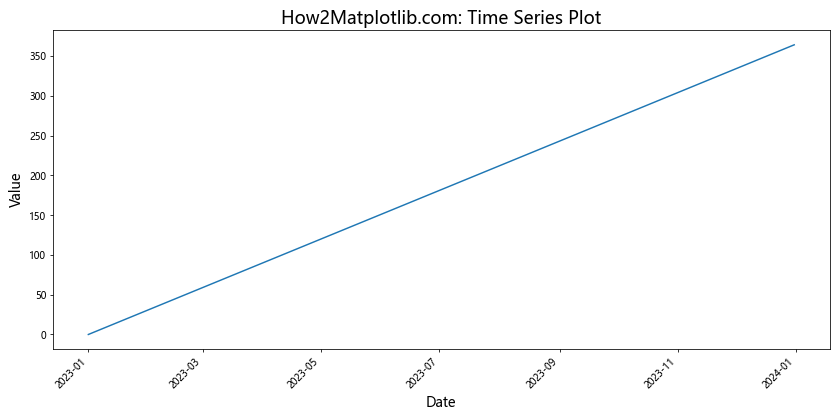
In this example, we adjust the matplotlib text size for the title, axis labels, and tick labels. We also rotate the x-axis labels to prevent overlapping and improve readability.
Matplotlib text size Conclusion
Mastering matplotlib text size is crucial for creating clear, professional, and visually appealing data visualizations. Throughout this comprehensive guide, we’ve explored various techniques to adjust text sizes for different plot elements, including titles, labels, legends, annotations, and more. We’ve also covered advanced topics such as using LaTeX formatting, creating custom styles, and adapting text sizes for different output formats.
By applying these techniques and experimenting with different matplotlib text sizes, you can significantly enhance the readability and overall quality of your plots. Remember to consider the context of your visualization, the intended audience, and the medium through which it will be presented when making decisions about text sizes.