How to Customize Matplotlib Annotate Font Size: A Comprehensive Guide
Matplotlib annotate font size is a crucial aspect of data visualization that can significantly impact the readability and overall appearance of your plots. In this comprehensive guide, we’ll explore various techniques to customize the font size of annotations in Matplotlib, providing you with the knowledge and tools to create visually appealing and informative plots. We’ll cover everything from basic font size adjustments to advanced techniques for dynamic font sizing, ensuring that your annotations are always clear and legible.
Understanding Matplotlib Annotate Font Size
Before we dive into the specifics of customizing font sizes, it’s essential to understand what Matplotlib annotate font size refers to and why it’s important. Matplotlib is a powerful plotting library for Python, and annotations are a key feature that allows you to add textual information to your plots. The font size of these annotations can greatly affect how your data is perceived and interpreted.
Matplotlib annotate font size determines the size of the text used in annotations. By default, Matplotlib uses a standard font size, but this may not always be suitable for every plot or dataset. Customizing the font size allows you to:
- Improve readability
- Emphasize important information
- Balance the visual hierarchy of your plot
- Adapt to different display sizes and resolutions
Let’s start with a basic example of how to set the font size for an annotation:
import matplotlib.pyplot as plt

fig, ax = plt.subplots()
ax.plot([0, 1, 2, 3, 4], [0, 2, 4, 6, 8])
ax.annotate('How2Matplotlib.com', xy=(2, 4), xytext=(3, 5),
            fontsize=12, arrowprops=dict(arrowstyle='->'))
plt.show()
Output:
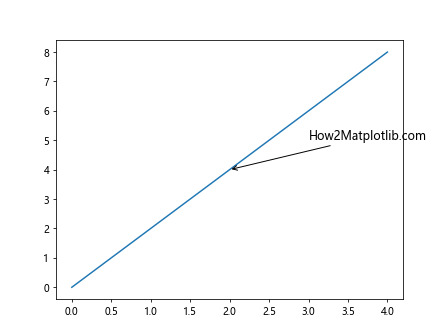
In this example, we’ve set the fontsize parameter to 12 for our annotation. This is a simple way to control the Matplotlib annotate font size, but there’s much more we can do to fine-tune our annotations.
Setting Matplotlib Annotate Font Size Globally
Sometimes, you may want to set a consistent font size for all annotations in your plot. Matplotlib allows you to do this by modifying the rcParams dictionary. Here’s how you can set a global font size for annotations:
import matplotlib.pyplot as plt
plt.rcParams['font.size'] = 14

fig, ax = plt.subplots()
ax.plot([0, 1, 2, 3, 4], [0, 2, 4, 6, 8])
ax.annotate('How2Matplotlib.com', xy=(2, 4), xytext=(3, 5),
            arrowprops=dict(arrowstyle='->'))
plt.show()
Output:
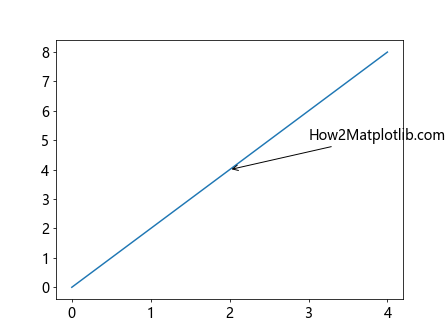
In this example, we’ve set the global font size to 14 points. This will affect all text elements in your plot, including annotations, unless overridden locally.
Adjusting Matplotlib Annotate Font Size Dynamically
In some cases, you might want to adjust the Matplotlib annotate font size dynamically based on certain conditions or data properties. Here’s an example of how to do this:
import matplotlib.pyplot as plt
import numpy as np

def dynamic_fontsize(value, min_size=8, max_size=24):
    return min(max(int(value * 2), min_size), max_size)

x = np.linspace(0, 10, 11)
y = x ** 2

fig, ax = plt.subplots()
ax.plot(x, y)

for i, (xi, yi) in enumerate(zip(x, y)):
    fontsize = dynamic_fontsize(yi)
    ax.annotate(f'How2Matplotlib.com ({yi:.1f})', xy=(xi, yi), xytext=(xi+0.5, yi+5),
                fontsize=fontsize, arrowprops=dict(arrowstyle='->'))

plt.show()
Output:
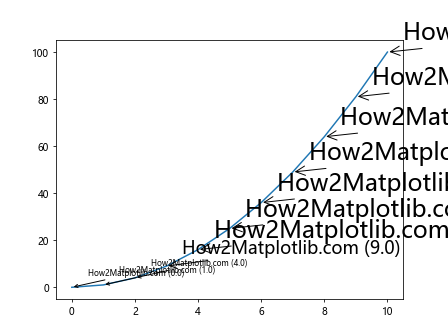
In this example, we’ve created a dynamic_fontsize function that calculates the font size based on the y-value of each point. This results in larger font sizes for points with higher y-values, creating a visual emphasis on these points.
Using Matplotlib Annotate Font Size with Different Font Styles
Font size can interact with different font styles to create various visual effects. Here’s an example of how to combine font size with different styles:
import matplotlib.pyplot as plt

fig, ax = plt.subplots()
ax.plot([0, 1, 2, 3, 4], [0, 2, 4, 6, 8])

ax.annotate('How2Matplotlib.com (Bold)', xy=(1, 2), xytext=(2, 3),
            fontsize=12, fontweight='bold', arrowprops=dict(arrowstyle='->'))
ax.annotate('How2Matplotlib.com (Italic)', xy=(2, 4), xytext=(3, 5),
            fontsize=12, fontstyle='italic', arrowprops=dict(arrowstyle='->'))
ax.annotate('How2Matplotlib.com (Both)', xy=(3, 6), xytext=(4, 7),
            fontsize=12, fontweight='bold', fontstyle='italic', arrowprops=dict(arrowstyle='->'))

plt.show()
Output:
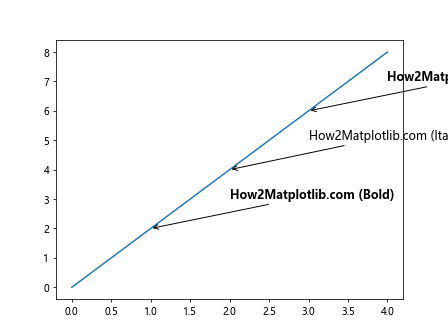
This example demonstrates how to combine different font styles with font sizes to create visually distinct annotations.
Matplotlib Annotate Font Size in Subplots
When working with subplots, you might want to adjust the Matplotlib annotate font size to fit the smaller plot areas. Here’s an example of how to do this:
import matplotlib.pyplot as plt

fig, (ax1, ax2) = plt.subplots(1, 2, figsize=(10, 5))

ax1.plot([0, 1, 2, 3, 4], [0, 2, 4, 6, 8])
ax1.annotate('How2Matplotlib.com (Subplot 1)', xy=(2, 4), xytext=(3, 5),
             fontsize=10, arrowprops=dict(arrowstyle='->'))

ax2.plot([0, 1, 2, 3, 4], [8, 6, 4, 2, 0])
ax2.annotate('How2Matplotlib.com (Subplot 2)', xy=(2, 4), xytext=(1, 3),
             fontsize=10, arrowprops=dict(arrowstyle='->'))

plt.tight_layout()
plt.show()
Output:
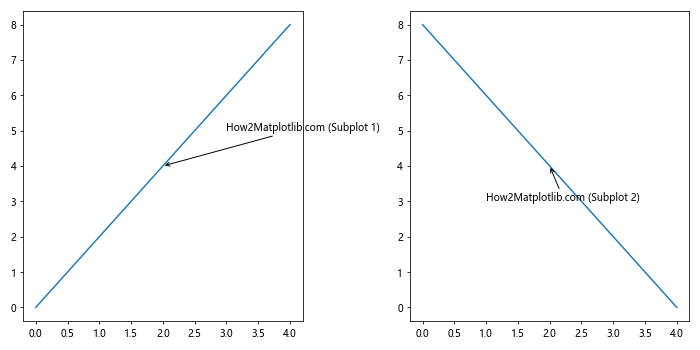
In this example, we’ve created two subplots and adjusted the Matplotlib annotate font size to 10 points to fit the smaller plot areas.
Scaling Matplotlib Annotate Font Size with Figure Size
When creating plots that may be displayed at different sizes, it can be useful to scale the Matplotlib annotate font size based on the figure size. Here’s an example of how to achieve this:
import matplotlib.pyplot as plt

def scale_fontsize(fig, base_size=12):
    fig_width = fig.get_figwidth()
    scale_factor = fig_width / 6.4  # 6.4 is the default figure width
    return base_size * scale_factor

fig, ax = plt.subplots(figsize=(10, 6))
ax.plot([0, 1, 2, 3, 4], [0, 2, 4, 6, 8])

fontsize = scale_fontsize(fig)
ax.annotate(f'How2Matplotlib.com (Scaled: {fontsize:.1f}pt)', xy=(2, 4), xytext=(3, 5),
            fontsize=fontsize, arrowprops=dict(arrowstyle='->'))

plt.show()
Output:
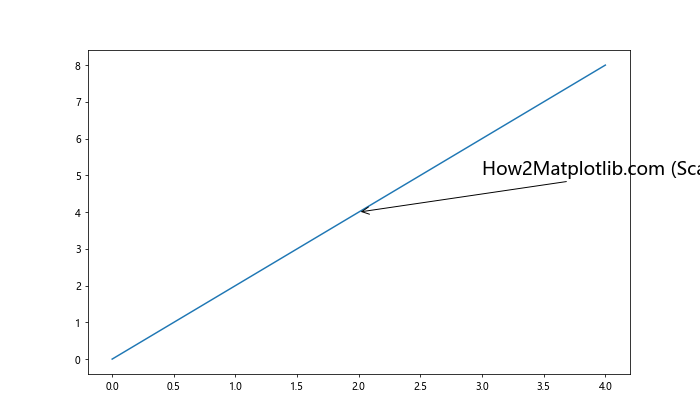
This example demonstrates how to scale the font size based on the figure width, ensuring that the annotation remains proportional to the overall plot size.
Adjusting Matplotlib Annotate Font Size for Colorbar Labels
When using colorbars in your plots, you might want to adjust the font size of the colorbar labels to match your annotations. Here’s how you can do this:
import matplotlib.pyplot as plt
import numpy as np

fig, ax = plt.subplots()
data = np.random.rand(10, 10)
im = ax.imshow(data)

cbar = fig.colorbar(im)
cbar.ax.tick_params(labelsize=10)

ax.annotate('How2Matplotlib.com', xy=(5, 5), xytext=(7, 7),
            fontsize=12, arrowprops=dict(arrowstyle='->'))

plt.show()
Output:
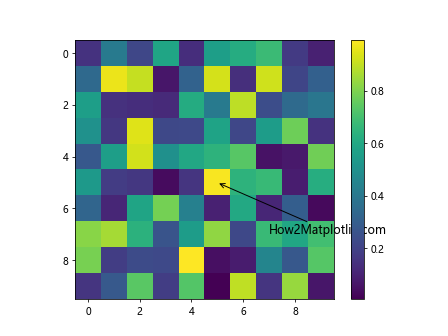
In this example, we’ve set the font size of the colorbar labels to 10 points and the annotation font size to 12 points, creating a balanced look between the annotation and the colorbar.
Creating a Legend with Matching Matplotlib Annotate Font Size
To maintain consistency in your plots, you might want to ensure that your legend font size matches your annotation font size. Here’s how you can achieve this:
import matplotlib.pyplot as plt

fig, ax = plt.subplots()
line1, = ax.plot([0, 1, 2, 3, 4], [0, 2, 4, 6, 8], label='Line 1')
line2, = ax.plot([0, 1, 2, 3, 4], [8, 6, 4, 2, 0], label='Line 2')

fontsize = 12
ax.annotate('How2Matplotlib.com', xy=(2, 4), xytext=(3, 5),
            fontsize=fontsize, arrowprops=dict(arrowstyle='->'))

ax.legend(fontsize=fontsize)

plt.show()
Output:
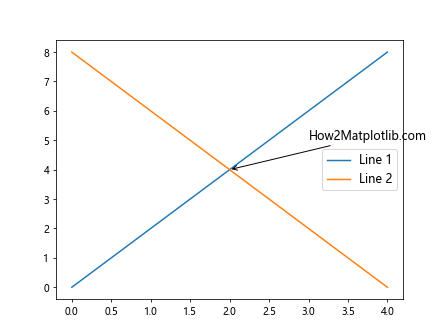
In this example, we’ve set the same font size (12 points) for both the annotation and the legend, creating a cohesive look across the plot.
Using Matplotlib Annotate Font Size with Different Coordinate Systems
Matplotlib allows you to use different coordinate systems for annotations. The font size can interact differently with these systems. Here’s an example:
import matplotlib.pyplot as plt

fig, ax = plt.subplots()
ax.plot([0, 1, 2, 3, 4], [0, 2, 4, 6, 8])

ax.annotate('How2Matplotlib.com (Data)', xy=(2, 4), xytext=(3, 5),
            fontsize=12, arrowprops=dict(arrowstyle='->'))

ax.annotate('How2Matplotlib.com (Axes)', xy=(0.5, 0.5), xytext=(0.7, 0.7),
            fontsize=12, xycoords='axes fraction', textcoords='axes fraction',
            arrowprops=dict(arrowstyle='->'))

ax.annotate('How2Matplotlib.com (Figure)', xy=(0.6, 0.6), xytext=(0.8, 0.8),
            fontsize=12, xycoords='figure fraction', textcoords='figure fraction',
            arrowprops=dict(arrowstyle='->'))

plt.show()
Output:
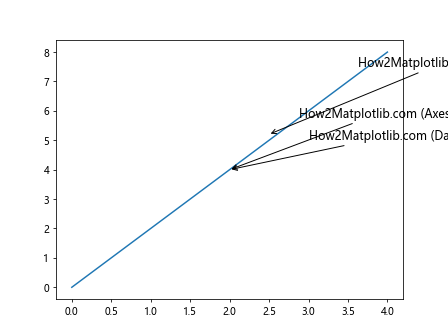
This example demonstrates how to use annotations with different coordinate systems (data coordinates, axes fraction, and figure fraction) while maintaining consistent font sizes.
Adjusting Matplotlib Annotate Font Size for Logarithmic Scales
When working with logarithmic scales, you might need to adjust your annotation positions and font sizes accordingly. Here’s an example:
import matplotlib.pyplot as plt
import numpy as np

fig, ax = plt.subplots()
x = np.logspace(0, 2, 20)
y = x**2
ax.loglog(x, y)

ax.annotate('How2Matplotlib.com', xy=(10, 100), xytext=(20, 200),
            fontsize=12, arrowprops=dict(arrowstyle='->'))

plt.show()
Output:
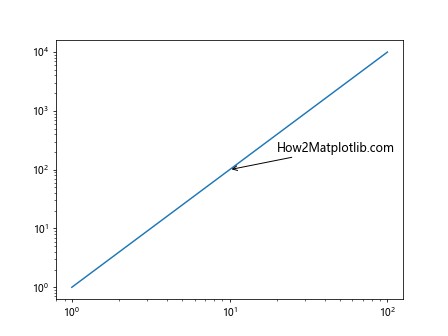
In this example, we’ve placed an annotation on a log-log plot, adjusting its position to be visible and readable within the logarithmic scale.
Using Matplotlib Annotate Font Size with Time Series Data
When working with time series data, you might need to adjust your annotation font size and position to accommodate date/time labels. Here’s an example:
import matplotlib.pyplot as plt
import pandas as pd

dates = pd.date_range(start='2023-01-01', end='2023-12-31', freq='D')
values = range(len(dates))

fig, ax = plt.subplots(figsize=(12, 6))
ax.plot(dates, values)

mid_point = dates[len(dates)//2]
ax.annotate('How2Matplotlib.com', xy=(mid_point, len(dates)//2), xytext=(mid_point + pd.Timedelta(days=30), len(dates)//2 + 30),
            fontsize=12, arrowprops=dict(arrowstyle='->'))

plt.gcf().autofmt_xdate()  # Rotate and align the tick labels
plt.show()
Output:
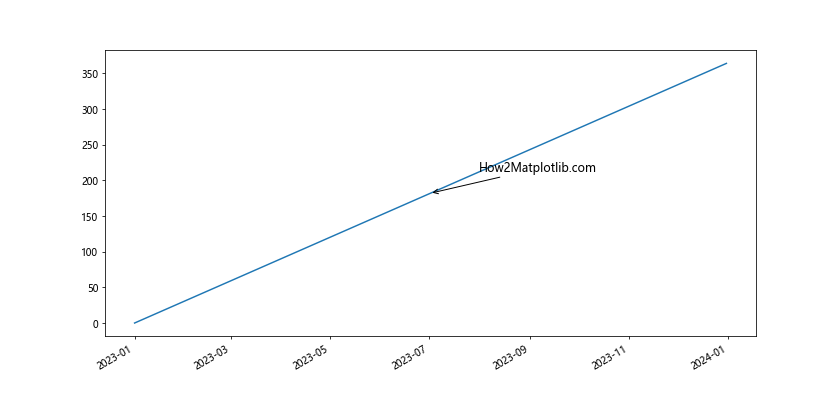
This example demonstrates how to place an annotation on a time series plot, adjusting the font size and position to work well with the date/time axis.
Matplotlib Annotate Font Size in 3D Plots
When working with 3D plots, you may need to adjust the Matplotlib annotate font size to ensure readability from different viewing angles. Here’s an example:
import matplotlib.pyplot as plt
import numpy as np

fig = plt.figure()
ax = fig.add_subplot(111, projection='3d')

x = np.linspace(-5, 5, 100)
y = np.linspace(-5, 5, 100)
X, Y = np.meshgrid(x, y)
Z = np.sin(np.sqrt(X**2 + Y**2))

surf = ax.plot_surface(X, Y, Z)

ax.text2D(0.05, 0.95, "How2Matplotlib.com", transform=ax.transAxes, fontsize=12)
ax.text(0, 0, 1, "Peak", fontsize=10)

plt.show()
Output:
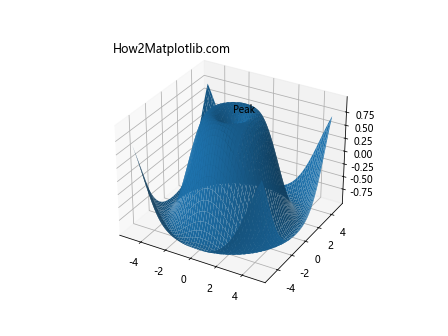
In this example, we’ve added both a 2D annotation (using text2D) and a 3D annotation (using text) to a 3D surface plot, adjusting the font sizes for clarity.
Animating Matplotlib Annotate Font Size
You can create dynamic visualizations by animating the font size of annotations. Here’s an example of how to do this:
import matplotlib.pyplot as plt
import matplotlib.animation as animation
import numpy as np

fig, ax = plt.subplots()
x = np.linspace(0, 2*np.pi, 100)
line, = ax.plot(x, np.sin(x))

annotation = ax.annotate('How2Matplotlib.com', xy=(np.pi, 0), xytext=(4, 0.5),
                         arrowprops=dict(arrowstyle='->'))

def animate(frame):
    fontsize = 10 + 5 * np.sin(frame / 10)
    annotation.set_fontsize(fontsize)
    return annotation,

ani = animation.FuncAnimation(fig, animate, frames=100, interval=50, blit=True)
plt.show()
Output:
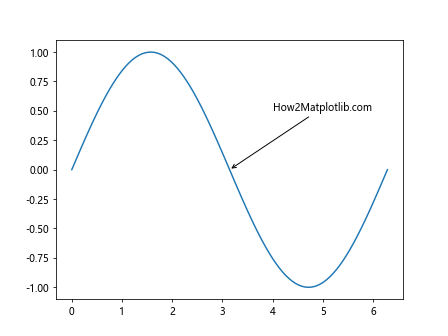
This example creates an animation where the font size of the annotation oscillates between 5 and 15 points, creating a pulsing effect.
Handling Matplotlib Annotate Font Size in Crowded Plots
When dealing with crowded plots, you may need to adjust the Matplotlib annotate font size to prevent overlapping. Here’s an example of how to handle this:
import matplotlib.pyplot as plt
import numpy as np

fig, ax = plt.subplots(figsize=(10, 6))
x = np.linspace(0, 10, 100)
y = np.sin(x)
ax.plot(x, y)

for i in range(10):
    xi = i
    yi = np.sin(xi)
    fontsize = max(6, min(12, 12 - i))  # Decrease font size for later points
    ax.annotate(f'How2Matplotlib.com ({i})', xy=(xi, yi), xytext=(xi+0.1, yi+0.1),
                fontsize=fontsize, arrowprops=dict(arrowstyle='->'))

plt.show()
Output:
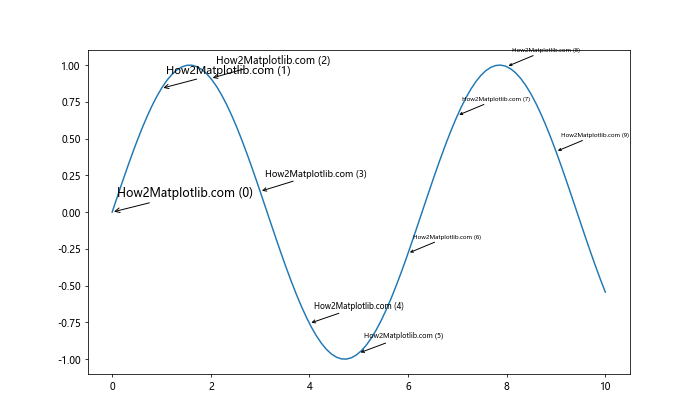
In this example, we’ve decreased the font size for annotations of later points to prevent overlapping in crowded areas of the plot.
Matplotlib annotate font size Conclusion
Mastering Matplotlib annotate font size is crucial for creating clear, informative, and visually appealing plots. Throughout this comprehensive guide, we’ve explored various techniques for customizing annotation font sizes in Matplotlib, from basic adjustments to advanced dynamic sizing and animations.
We’ve covered topics such as:
- Setting font sizes globally and locally
- Using different units for font sizes
- Dynamically adjusting font sizes based on data
- Customizing font sizes for different parts of annotations
- Combining font sizes with different styles
- Handling font sizes in subplots and with different coordinate systems
- Scaling font sizes with figure sizes
- Using font sizes with LaTeX rendering and custom fonts
- Adjusting font sizes for special plot types like 3D plots and animations
By applying these techniques, you can ensure that your annotations are always readable and effectively convey the information you want to highlight in your visualizations. Remember that the key to effective data visualization is balance – your annotations should complement your data, not overpower it.