How to Master Matplotlib Annotate Rotate: A Comprehensive Guide
Matplotlib annotate rotate is a powerful feature in the Matplotlib library that allows you to add rotated annotations to your plots. This article will provide an in-depth exploration of matplotlib annotate rotate, covering various aspects and use cases. We’ll dive into the intricacies of using matplotlib annotate rotate to enhance your data visualizations and make them more informative and visually appealing.
Understanding the Basics of Matplotlib Annotate Rotate
Matplotlib annotate rotate is a combination of two key concepts in Matplotlib: annotations and rotation. Annotations are used to add text or other visual elements to your plots, while rotation allows you to change the orientation of these elements. When combined, matplotlib annotate rotate enables you to create rotated text annotations that can be positioned anywhere on your plot.
Let’s start with a simple example to demonstrate the basic usage of matplotlib annotate rotate:
import matplotlib.pyplot as plt

fig, ax = plt.subplots()
ax.plot([0, 1], [0, 1])
ax.annotate('how2matplotlib.com', xy=(0.5, 0.5), xytext=(0.7, 0.7),
            arrowprops=dict(arrowstyle='->'),
            rotation=45)
plt.show()
Output:
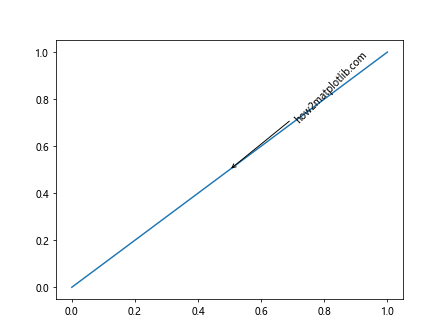
In this example, we create a simple line plot and add a rotated annotation using matplotlib annotate rotate. The annotation text “how2matplotlib.com” is rotated 45 degrees and positioned at (0.7, 0.7) with an arrow pointing to (0.5, 0.5) on the plot.
Advanced Techniques for Matplotlib Annotate Rotate
Now that we’ve covered the basics, let’s explore some more advanced techniques for using matplotlib annotate rotate effectively.
Adjusting Rotation Angle
The rotation angle in matplotlib annotate rotate can be adjusted to any value between 0 and 360 degrees. This flexibility allows you to create annotations that fit perfectly with your plot’s layout.
import matplotlib.pyplot as plt

fig, ax = plt.subplots()
ax.plot([0, 1], [0, 1])
for angle in [0, 30, 60, 90]:
    ax.annotate(f'how2matplotlib.com {angle}°', xy=(0.5, 0.5), xytext=(0.7, 0.7),
                arrowprops=dict(arrowstyle='->'),
                rotation=angle)
plt.show()
Output:
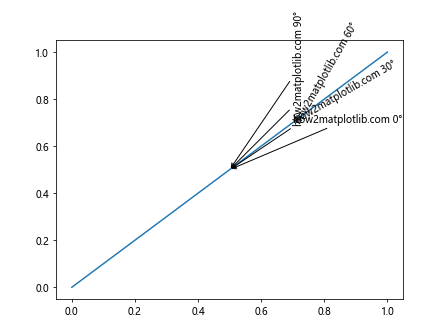
This example demonstrates how to create multiple annotations with different rotation angles using matplotlib annotate rotate.
Aligning Rotated Text
When using matplotlib annotate rotate, you may need to adjust the alignment of the rotated text to ensure it’s positioned correctly relative to the annotation point.
import matplotlib.pyplot as plt

fig, ax = plt.subplots()
ax.plot([0, 1], [0, 1])
ax.annotate('how2matplotlib.com', xy=(0.5, 0.5), xytext=(0.7, 0.7),
            arrowprops=dict(arrowstyle='->'),
            rotation=45,
            ha='right', va='bottom')
plt.show()
Output:
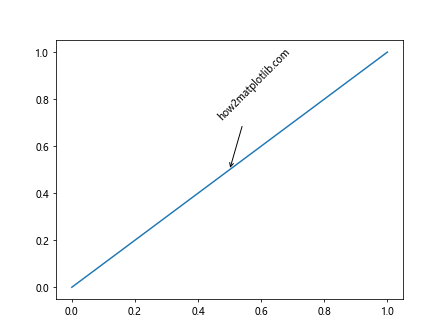
In this example, we use the ha (horizontal alignment) and va (vertical alignment) parameters to adjust the alignment of the rotated text in matplotlib annotate rotate.
Customizing Appearance with Matplotlib Annotate Rotate
Matplotlib annotate rotate offers various options for customizing the appearance of your rotated annotations. Let’s explore some of these customization techniques.
Changing Font Properties
You can modify the font properties of your rotated annotations using matplotlib annotate rotate to make them stand out or match your plot’s style.
import matplotlib.pyplot as plt

fig, ax = plt.subplots()
ax.plot([0, 1], [0, 1])
ax.annotate('how2matplotlib.com', xy=(0.5, 0.5), xytext=(0.7, 0.7),
            arrowprops=dict(arrowstyle='->'),
            rotation=45,
            fontsize=16,
            fontweight='bold',
            fontstyle='italic')
plt.show()
Output:
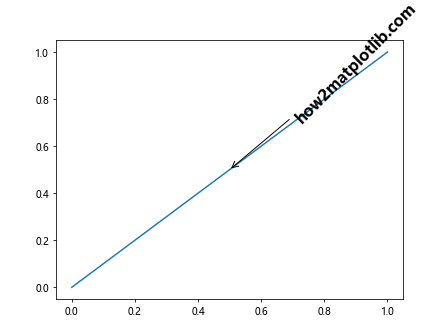
This example demonstrates how to change the font size, weight, and style of the rotated annotation using matplotlib annotate rotate.
Adding Background and Border
To make your rotated annotations more visible, you can add a background and border using matplotlib annotate rotate.
import matplotlib.pyplot as plt

fig, ax = plt.subplots()
ax.plot([0, 1], [0, 1])
ax.annotate('how2matplotlib.com', xy=(0.5, 0.5), xytext=(0.7, 0.7),
            arrowprops=dict(arrowstyle='->'),
            rotation=45,
            bbox=dict(boxstyle='round,pad=0.5', fc='yellow', ec='black', alpha=0.7))
plt.show()
Output:
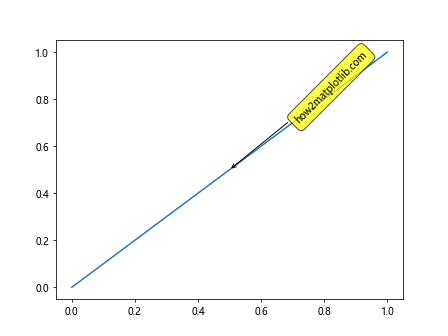
In this example, we use the bbox parameter to add a yellow background with a black border to the rotated annotation in matplotlib annotate rotate.
Applying Matplotlib Annotate Rotate to Different Plot Types
Matplotlib annotate rotate can be used with various types of plots to enhance their information content. Let’s explore how to apply matplotlib annotate rotate to different plot types.
Bar Plots
Rotated annotations can be particularly useful in bar plots to label bars or provide additional information.
import matplotlib.pyplot as plt
import numpy as np

fig, ax = plt.subplots()
x = np.arange(5)
y = np.random.rand(5)
ax.bar(x, y)
for i, v in enumerate(y):
    ax.annotate(f'how2matplotlib.com\n{v:.2f}', xy=(i, v), xytext=(0, 3),
                textcoords='offset points',
                ha='center', va='bottom',
                rotation=45)
plt.show()
Output:
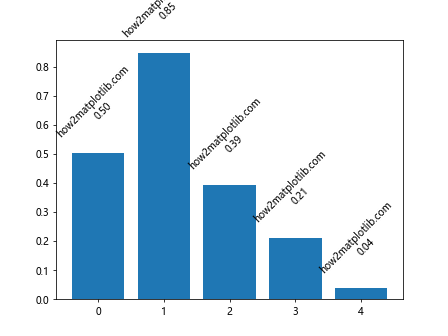
This example shows how to use matplotlib annotate rotate to add rotated value labels to a bar plot.
Scatter Plots
Rotated annotations can be used to label specific points or regions in scatter plots.
import matplotlib.pyplot as plt
import numpy as np

fig, ax = plt.subplots()
x = np.random.rand(20)
y = np.random.rand(20)
ax.scatter(x, y)
for i in range(5):
    ax.annotate(f'how2matplotlib.com\nPoint {i+1}', xy=(x[i], y[i]), xytext=(5, 5),
                textcoords='offset points',
                ha='left', va='bottom',
                rotation=30)
plt.show()
Output:
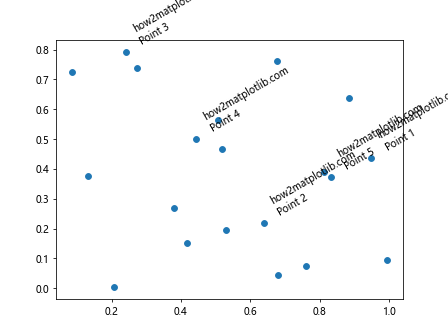
This example demonstrates how to use matplotlib annotate rotate to add rotated labels to specific points in a scatter plot.
Advanced Applications of Matplotlib Annotate Rotate
Let’s explore some more advanced applications of matplotlib annotate rotate to create more complex and informative visualizations.
Circular Annotations
You can use matplotlib annotate rotate to create circular annotations around a central point.
import matplotlib.pyplot as plt
import numpy as np

fig, ax = plt.subplots()
ax.set_xlim(-1.5, 1.5)
ax.set_ylim(-1.5, 1.5)
ax.add_artist(plt.Circle((0, 0), 1, fill=False))

for angle in range(0, 360, 45):
    x = np.cos(np.radians(angle))
    y = np.sin(np.radians(angle))
    ax.annotate(f'how2matplotlib.com\n{angle}°', xy=(x, y), xytext=(1.2*x, 1.2*y),
                arrowprops=dict(arrowstyle='->'),
                rotation=angle-90)
plt.show()
Output:
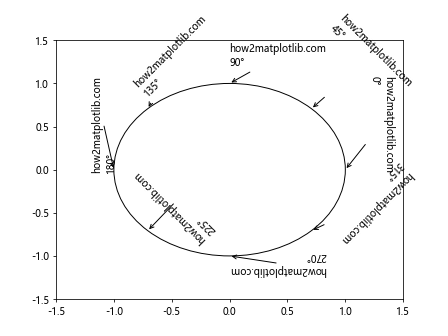
This example shows how to create circular annotations using matplotlib annotate rotate, with the text rotated to align with the circle’s tangent.
Annotating Time Series Data
Matplotlib annotate rotate can be particularly useful for annotating time series data, especially when dealing with long x-axis labels.
import matplotlib.pyplot as plt
import numpy as np
import pandas as pd

dates = pd.date_range(start='2023-01-01', end='2023-12-31', freq='M')
values = np.random.randn(len(dates)).cumsum()

fig, ax = plt.subplots(figsize=(12, 6))
ax.plot(dates, values)

for i, (date, value) in enumerate(zip(dates, values)):
    if i % 3 == 0:
        ax.annotate(f'how2matplotlib.com\n{date.strftime("%Y-%m-%d")}', xy=(date, value),
                    xytext=(0, 10), textcoords='offset points',
                    ha='center', va='bottom',
                    rotation=45)

plt.tight_layout()
plt.show()
Output:
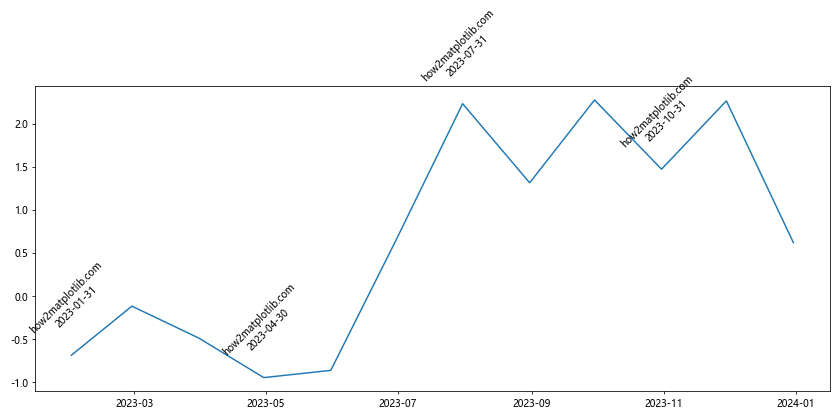
This example demonstrates how to use matplotlib annotate rotate to add rotated date labels to a time series plot.
Handling Overlapping Annotations with Matplotlib Annotate Rotate
When working with dense data or multiple annotations, overlapping can become an issue. Let’s explore some techniques to handle overlapping annotations using matplotlib annotate rotate.
Adjusting Annotation Positions
One way to handle overlapping annotations is to adjust their positions based on the data.
import matplotlib.pyplot as plt
import numpy as np

fig, ax = plt.subplots()
x = np.linspace(0, 10, 100)
y = np.sin(x)
ax.plot(x, y)

for i in range(0, len(x), 10):
    offset = 20 if y[i] >= 0 else -20
    ax.annotate(f'how2matplotlib.com\n{x[i]:.2f}, {y[i]:.2f}', xy=(x[i], y[i]),
                xytext=(0, offset), textcoords='offset points',
                ha='center', va='center',
                rotation=45 if y[i] >= 0 else -45,
                arrowprops=dict(arrowstyle='->'))

plt.show()
Output:
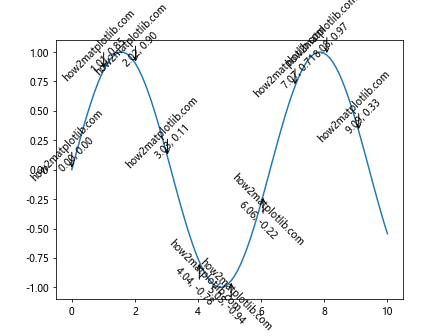
This example shows how to adjust the position and rotation of annotations based on the y-value of the data points to avoid overlapping.
Using Annotation Boxes
Another technique to handle overlapping annotations is to use annotation boxes with different styles.
import matplotlib.pyplot as plt
import numpy as np
from matplotlib.patches import BoxStyle

fig, ax = plt.subplots()
x = np.linspace(0, 10, 100)
y = np.sin(x)
ax.plot(x, y)

box_styles = [BoxStyle.Round(), BoxStyle.Square(), BoxStyle.Circle()]

for i, style in zip(range(0, len(x), 30), box_styles):
    ax.annotate(f'how2matplotlib.com\n{x[i]:.2f}, {y[i]:.2f}', xy=(x[i], y[i]),
                xytext=(20, 20), textcoords='offset points',
                ha='left', va='bottom',
                rotation=30,
                bbox=dict(boxstyle=style, fc='white', ec='black', alpha=0.8),
                arrowprops=dict(arrowstyle='->'))

plt.show()
Output:
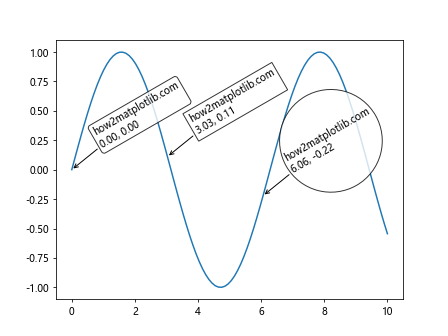
This example demonstrates how to use different annotation box styles with matplotlib annotate rotate to make overlapping annotations more distinguishable.
Combining Matplotlib Annotate Rotate with Other Matplotlib Features
Matplotlib annotate rotate can be combined with other Matplotlib features to create even more informative and visually appealing plots.
Using Matplotlib Annotate Rotate with Subplots
You can use matplotlib annotate rotate across multiple subplots to create complex, annotated visualizations.
import matplotlib.pyplot as plt
import numpy as np

fig, (ax1, ax2) = plt.subplots(1, 2, figsize=(12, 6))

# Subplot 1: Bar plot
x1 = np.arange(5)
y1 = np.random.rand(5)
ax1.bar(x1, y1)
for i, v in enumerate(y1):
    ax1.annotate(f'how2matplotlib.com\n{v:.2f}', xy=(i, v), xytext=(0, 3),
                 textcoords='offset points',
                 ha='center', va='bottom',
                 rotation=45)

# Subplot 2: Scatter plot
x2 = np.random.rand(20)
y2 = np.random.rand(20)
ax2.scatter(x2, y2)
for i in range(5):
    ax2.annotate(f'how2matplotlib.com\nPoint {i+1}', xy=(x2[i], y2[i]), xytext=(5, 5),
                 textcoords='offset points',
                 ha='left', va='bottom',
                 rotation=30)

plt.tight_layout()
plt.show()
Output:
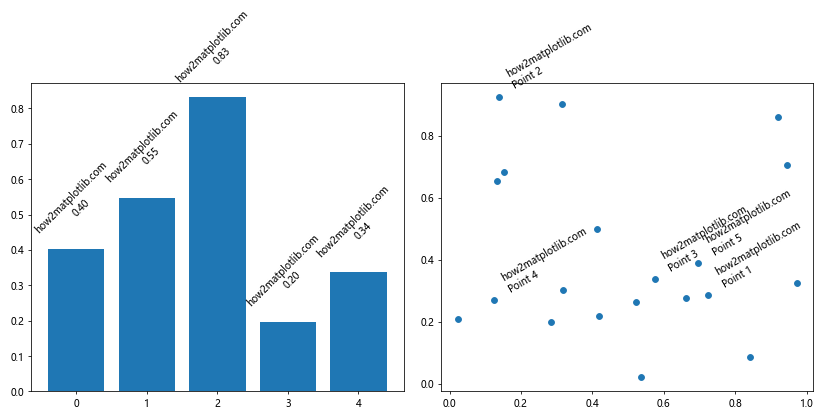
This example shows how to use matplotlib annotate rotate in multiple subplots, combining a bar plot and a scatter plot with rotated annotations.
Combining with Matplotlib Text
You can combine matplotlib annotate rotate with Matplotlib’s text function to create more complex text layouts.
import matplotlib.pyplot as plt
import numpy as np

fig, ax = plt.subplots()
x = np.linspace(0, 10, 100)
y = np.sin(x)
ax.plot(x, y)

ax.annotate('how2matplotlib.com\nSine Wave', xy=(5, 0), xytext=(5, 1),
            arrowprops=dict(arrowstyle='->'),
            ha='center', va='center',
            rotation=0)

ax.text(2, -0.5, 'how2matplotlib.com\nRotated Text',
        rotation=45,
        ha='center', va='center',
        bbox=dict(boxstyle='round,pad=0.5', fc='yellow', ec='black', alpha=0.7))

plt.show()
Output:
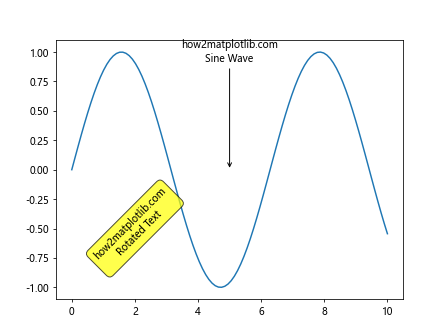
This example demonstrates how to combine matplotlib annotate rotate with the text function to create a plot with both rotated annotations and rotated text.
Best Practices for Using Matplotlib Annotate Rotate
To make the most of matplotlib annotate rotate, it’s important to follow some best practices. Here are some tips to keep in mind:
- Use rotation sparingly: While rotated text can be eye-catching, overusing it can make your plot difficult to read. Use matplotlib annotate rotate judiciously to highlight important information.
Consider readability: When using matplotlib annotate rotate, make sure the rotated text is still easily readable. Avoid extreme angles that make the text hard to decipher.
Align with data: When possible, align rotated annotations with the data they’re describing. For example, in a bar plot, you might rotate bar labels to follow the angle of the bars.
Use consistent angles: If you’re using multiple rotated annotations, try to use consistent angles throughout your plot for a more cohesive look.
Adjust font size: Rotated text can sometimes appear smaller than horizontal text. Consider increasing the font size of rotated annotations to maintain readability.
Test different angles: Experiment with different rotation angles to find the best balance between aesthetics and readability for your specific plot.
Let’s see an example that incorporates these best practices: