Mastering Matplotlib.figure.Figure.set_dpi() in Python
Matplotlib.figure.Figure.set_dpi() in Python is a powerful method that allows you to control the resolution of your plots. This function is an essential tool for data visualization enthusiasts and professionals alike. In this comprehensive guide, we’ll explore the ins and outs of Matplotlib.figure.Figure.set_dpi(), providing you with the knowledge and skills to enhance your data visualization projects.
Understanding Matplotlib.figure.Figure.set_dpi()
Matplotlib.figure.Figure.set_dpi() is a method that belongs to the Figure class in Matplotlib. DPI stands for “dots per inch,” which is a measure of image resolution. By using Matplotlib.figure.Figure.set_dpi(), you can adjust the resolution of your plots, affecting their clarity and size.
Let’s start with a basic example to demonstrate how to use Matplotlib.figure.Figure.set_dpi():
import matplotlib.pyplot as plt

# Create a new figure
fig = plt.figure(figsize=(6, 4))

# Set the DPI to 300
fig.set_dpi(300)

# Plot some data
plt.plot([1, 2, 3, 4], [1, 4, 2, 3], label='Data from how2matplotlib.com')
plt.title('Example Plot with set_dpi()')
plt.xlabel('X-axis')
plt.ylabel('Y-axis')
plt.legend()

# Display the plot
plt.show()
Output:
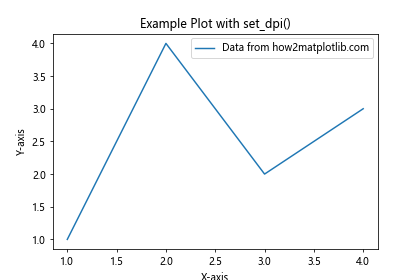
In this example, we create a new figure using plt.figure() and then use fig.set_dpi(300) to set the resolution to 300 DPI. This will result in a higher-quality image compared to the default DPI setting.
The Importance of DPI in Data Visualization
Understanding the concept of DPI is crucial when working with Matplotlib.figure.Figure.set_dpi(). DPI affects how your plots appear on different devices and in various contexts, such as print or digital display.
Here’s an example that demonstrates the difference between low and high DPI settings:
import matplotlib.pyplot as plt

# Create two subplots
fig, (ax1, ax2) = plt.subplots(1, 2, figsize=(12, 5))

# Set different DPI for each subplot
fig.set_dpi(72)  # Low DPI
ax1.plot([1, 2, 3, 4], [1, 4, 2, 3], label='Low DPI (72)')
ax1.set_title('Low DPI Example')
ax1.legend()

fig.set_dpi(300)  # High DPI
ax2.plot([1, 2, 3, 4], [1, 4, 2, 3], label='High DPI (300)')
ax2.set_title('High DPI Example')
ax2.legend()

plt.suptitle('DPI Comparison - how2matplotlib.com')
plt.tight_layout()
plt.show()
Output:
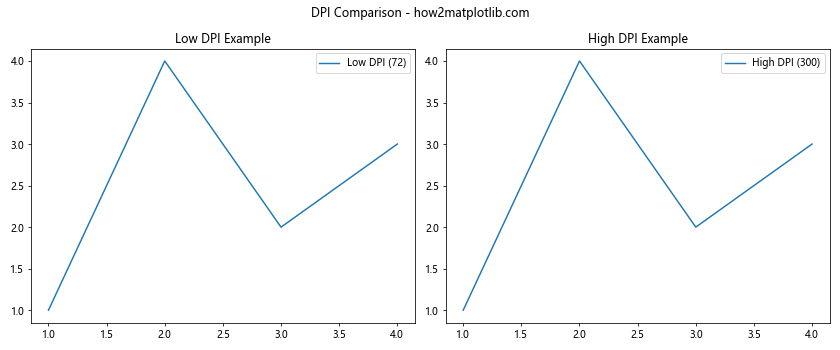
In this example, we create two subplots with different DPI settings. The first subplot uses a low DPI of 72, while the second uses a high DPI of 300. You’ll notice that the high DPI plot appears sharper and more detailed.
Adjusting DPI for Different Output Formats
When using Matplotlib.figure.Figure.set_dpi(), it’s important to consider the intended output format of your plots. Different formats may require different DPI settings for optimal results.
Here’s an example that demonstrates how to adjust DPI for different output formats:
import matplotlib.pyplot as plt

# Create a figure
fig, ax = plt.subplots(figsize=(6, 4))

# Plot some data
ax.plot([1, 2, 3, 4], [1, 4, 2, 3], label='Data from how2matplotlib.com')
ax.set_title('DPI Adjustment for Different Formats')
ax.legend()

# Save the plot in different formats with appropriate DPI
fig.set_dpi(72)
plt.savefig('low_dpi_plot.png')

fig.set_dpi(300)
plt.savefig('high_dpi_plot.png')

fig.set_dpi(600)
plt.savefig('print_quality_plot.tiff')

plt.show()
Output:
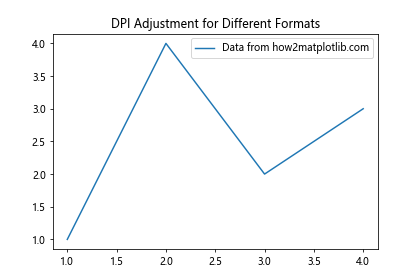
In this example, we save the same plot in different formats with varying DPI settings. The low DPI (72) is suitable for web display, the high DPI (300) is good for general-purpose use, and the very high DPI (600) is appropriate for print-quality output.
Optimizing Performance with Matplotlib.figure.Figure.set_dpi()
While higher DPI settings can produce better-quality images, they can also impact performance, especially when working with large datasets or complex visualizations. It’s important to find the right balance between image quality and performance.
Here’s an example that demonstrates how to optimize performance by adjusting DPI based on the complexity of the plot:
import matplotlib.pyplot as plt
import numpy as np

def create_plot(num_points, dpi):
    fig, ax = plt.subplots(figsize=(6, 4))
    fig.set_dpi(dpi)

    x = np.linspace(0, 10, num_points)
    y = np.sin(x)

    ax.plot(x, y, label=f'Data from how2matplotlib.com ({num_points} points)')
    ax.set_title(f'Plot with {num_points} points at {dpi} DPI')
    ax.legend()

    plt.show()

# Low complexity plot
create_plot(100, 300)

# Medium complexity plot
create_plot(1000, 150)

# High complexity plot
create_plot(10000, 72)
In this example, we create three plots with varying levels of complexity (number of data points). For the low complexity plot, we use a high DPI of 300. As the complexity increases, we reduce the DPI to maintain good performance while still producing acceptable image quality.
Combining Matplotlib.figure.Figure.set_dpi() with Other Figure Properties
Matplotlib.figure.Figure.set_dpi() can be used in conjunction with other figure properties to achieve the desired visual output. Let’s explore how to combine DPI settings with figure size and layout adjustments.
import matplotlib.pyplot as plt

# Create a figure with custom size and DPI
fig = plt.figure(figsize=(8, 6))
fig.set_dpi(150)

# Create subplots
ax1 = fig.add_subplot(2, 2, 1)
ax2 = fig.add_subplot(2, 2, 2)
ax3 = fig.add_subplot(2, 2, (3, 4))

# Plot data in each subplot
ax1.plot([1, 2, 3], [4, 5, 6], label='Data 1')
ax2.scatter([1, 2, 3], [4, 5, 6], label='Data 2')
ax3.bar([1, 2, 3], [4, 5, 6], label='Data 3')

# Set titles and labels
ax1.set_title('Line Plot')
ax2.set_title('Scatter Plot')
ax3.set_title('Bar Plot')

for ax in [ax1, ax2, ax3]:
    ax.set_xlabel('X-axis')
    ax.set_ylabel('Y-axis')
    ax.legend()

# Adjust layout and add a main title
plt.tight_layout()
fig.suptitle('Combined Plot Example - how2matplotlib.com', fontsize=16)

plt.show()
Output:
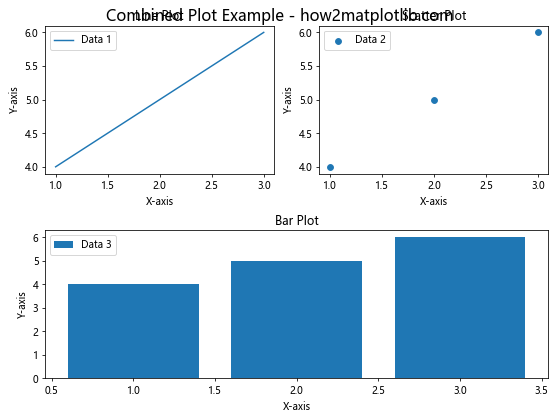
In this example, we create a figure with a custom size using figsize=(8, 6) and set the DPI to 150 using Matplotlib.figure.Figure.set_dpi(). We then create multiple subplots with different types of plots and adjust the layout using plt.tight_layout().
Handling High-Resolution Displays with Matplotlib.figure.Figure.set_dpi()
With the increasing prevalence of high-resolution displays, it’s important to consider how your plots will appear on these devices. Matplotlib.figure.Figure.set_dpi() can help you create plots that look crisp and clear on high-DPI screens.
Here’s an example that demonstrates how to create a plot optimized for high-resolution displays:
import matplotlib.pyplot as plt
import numpy as np

# Create a figure with high DPI
fig, ax = plt.subplots(figsize=(6, 4))
fig.set_dpi(220)  # Retina display-friendly DPI

# Generate some data
x = np.linspace(0, 10, 1000)
y1 = np.sin(x)
y2 = np.cos(x)

# Plot the data
ax.plot(x, y1, label='sin(x)')
ax.plot(x, y2, label='cos(x)')

# Customize the plot
ax.set_title('High-Resolution Plot Example - how2matplotlib.com')
ax.set_xlabel('X-axis')
ax.set_ylabel('Y-axis')
ax.legend()

# Add a grid for better readability
ax.grid(True, linestyle='--', alpha=0.7)

# Adjust layout and display the plot
plt.tight_layout()
plt.show()
Output:
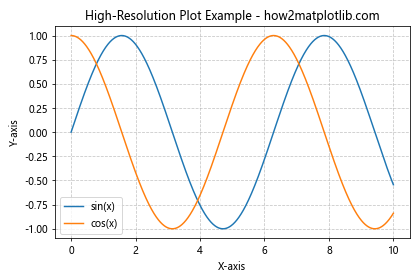
In this example, we set the DPI to 220, which is suitable for many high-resolution displays. We also use a larger number of data points (1000) to ensure smooth curves, and add a grid to improve readability on high-DPI screens.
Exporting High-Quality Images with Matplotlib.figure.Figure.set_dpi()
When you need to create publication-quality figures or high-resolution images for presentations, Matplotlib.figure.Figure.set_dpi() becomes crucial. Let’s explore how to export high-quality images using different file formats.
import matplotlib.pyplot as plt
import numpy as np

def create_high_quality_plot():
    fig, ax = plt.subplots(figsize=(8, 6))
    fig.set_dpi(300)  # High DPI for quality output

    x = np.linspace(0, 10, 500)
    y = np.sin(x) * np.exp(-0.1 * x)

    ax.plot(x, y, label='Damped Sine Wave')
    ax.set_title('High-Quality Plot Example - how2matplotlib.com')
    ax.set_xlabel('Time')
    ax.set_ylabel('Amplitude')
    ax.legend()
    ax.grid(True, linestyle=':', alpha=0.7)

    return fig

# Create the high-quality plot
high_quality_fig = create_high_quality_plot()

# Save in different formats
high_quality_fig.savefig('high_quality_plot.png', dpi=300, bbox_inches='tight')
high_quality_fig.savefig('high_quality_plot.pdf', dpi=300, bbox_inches='tight')
high_quality_fig.savefig('high_quality_plot.svg', dpi=300, bbox_inches='tight')

plt.show()
Output:
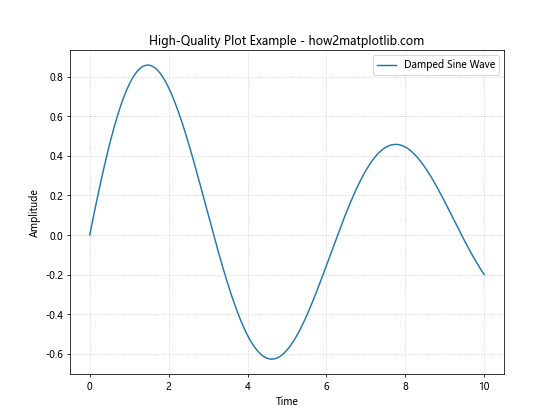
In this example, we create a high-quality plot using a DPI of 300 and save it in three different formats: PNG, PDF, and SVG. The bbox_inches='tight' parameter ensures that the entire plot, including labels and titles, is saved without any unnecessary white space.
Troubleshooting Common Issues with Matplotlib.figure.Figure.set_dpi()
When working with Matplotlib.figure.Figure.set_dpi(), you may encounter some common issues. Let’s address a few of these and provide solutions.
- Blurry or pixelated images:
import matplotlib.pyplot as plt

# Problem: Low DPI resulting in a blurry image
fig, ax = plt.subplots(figsize=(6, 4))
fig.set_dpi(50)  # Low DPI

ax.plot([1, 2, 3, 4], [1, 4, 2, 3])
ax.set_title('Blurry Plot (Low DPI) - how2matplotlib.com')

plt.show()

# Solution: Increase DPI for a sharper image
fig, ax = plt.subplots(figsize=(6, 4))
fig.set_dpi(150)  # Higher DPI

ax.plot([1, 2, 3, 4], [1, 4, 2, 3])
ax.set_title('Sharp Plot (High DPI) - how2matplotlib.com')

plt.show()
- Inconsistent font sizes:
import matplotlib.pyplot as plt

# Problem: Inconsistent font sizes with different DPI
fig, (ax1, ax2) = plt.subplots(1, 2, figsize=(12, 4))
fig.set_dpi(72)

ax1.plot([1, 2, 3, 4], [1, 4, 2, 3])
ax1.set_title('Low DPI (72) - how2matplotlib.com')

fig.set_dpi(300)
ax2.plot([1, 2, 3, 4], [1, 4, 2, 3])
ax2.set_title('High DPI (300) - how2matplotlib.com')

plt.show()

# Solution: Use relative font sizes
fig, (ax1, ax2) = plt.subplots(1, 2, figsize=(12, 4))
fig.set_dpi(72)

ax1.plot([1, 2, 3, 4], [1, 4, 2, 3])
ax1.set_title('Low DPI (72) - how2matplotlib.com', fontsize=10)

fig.set_dpi(300)
ax2.plot([1, 2, 3, 4], [1, 4, 2, 3])
ax2.set_title('High DPI (300) - how2matplotlib.com', fontsize=10)

plt.show()
- Memory issues with very high DPI:
import matplotlib.pyplot as plt
import numpy as np

# Problem: High DPI causing memory issues
try:
    fig, ax = plt.subplots(figsize=(10, 8))
    fig.set_dpi(10000)  # Extremely high DPI

    x = np.linspace(0, 10, 1000000)
    y = np.sin(x)
    ax.plot(x, y)
    ax.set_title('Memory Issue Example - how2matplotlib.com')

    plt.show()
except MemoryError:
    print("MemoryError: DPI too high for available system memory")

# Solution: Use a reasonable DPI and downsample data if necessary
fig, ax = plt.subplots(figsize=(10, 8))
fig.set_dpi(300)  # Reasonable high DPI

x = np.linspace(0, 10, 10000)  # Reduced number of points
y = np.sin(x)
ax.plot(x, y)
ax.set_title('Optimized Plot - how2matplotlib.com')

plt.show()
Advanced Techniques with Matplotlib.figure.Figure.set_dpi()
Now that we’ve covered the basics and troubleshooting, let’s explore some advanced techniques using Matplotlib.figure.Figure.set_dpi().
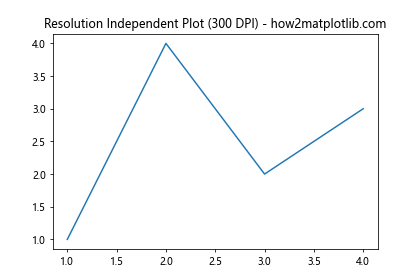
- Creating resolution-independent plots:
import matplotlib.pyplot as plt
from matplotlib.backends.backend_agg import FigureCanvasAgg

def create_resolution_independent_plot(dpi):
    fig = plt.figure(figsize=(6, 4), dpi=dpi)
    ax = fig.add_subplot(111)

    ax.plot([1, 2, 3, 4], [1, 4, 2, 3])
    ax.set_title(f'Resolution Independent Plot ({dpi} DPI) - how2matplotlib.com')

    canvas = FigureCanvasAgg(fig)
    canvas.draw()

    return fig

# Create plots at different resolutions
low_res_fig = create_resolution_independent_plot(72)
high_res_fig = create_resolution_independent_plot(300)

low_res_fig.savefig('low_res_plot.png')
high_res_fig.savefig('high_res_plot.png')

plt.show()
Output:
- Adjusting DPI for different output devices:
import matplotlib.pyplot as plt

def create_device_specific_plot(device):
    if device == 'screen':
        dpi = 96
    elif device == 'print':
        dpi = 300
    elif device == 'retina':
        dpi = 220
    else:
        dpi = 100  # Default

    fig, ax = plt.subplots(figsize=(6, 4))
    fig.set_dpi(dpi)

    ax.plot([1, 2, 3, 4], [1, 4, 2, 3])
    ax.set_title(f'{device.capitalize()} Optimized Plot ({dpi} DPI) - how2matplotlib.com')

    plt.show()

# Create plots optimized for different devices
create_device_specific_plot('screen')
create_device_specific_plot('print')
create_device_specific_plot('retina')
- Creating high-resolution animations:
import matplotlib.pyplot as plt
import matplotlib.animation as animation
import numpy as np

def create_high_res_animation():
    fig, ax = plt.subplots(figsize=(6, 4))
    fig.set_dpi(200)  # High DPI for smooth animation

    x = np.linspace(0, 2 * np.pi, 100)
    line, = ax.plot(x, np.sin(x))

    def animate(i):
        line.set_ydata(np.sin(x + i / 10))
        return line,

    ani = animation.FuncAnimation(fig, animate, frames=100, interval=50, blit=True)
    ax.set_title('High-Resolution Animation - how2matplotlib.com')

    plt.show()

create_high_res_animation()
Best Practices for Using Matplotlib.figure.Figure.set_dpi()
To make the most of Matplotlib.figure.Figure.set_dpi(), consider the following best practices:
- Choose the right DPI for your purpose:
- 72-96 DPI for screen display
- 150-300 DPI for print
- 200-300 DPI for high-resolution displays
- Balance quality and performance:
- Higher DPI increases file size and rendering time
- Use lower DPI for interactive plots and higher DPI for static images
- Consider the output format:
- Vector formats (SVG, PDF) are resolution-independent
- Raster formats (PNG, JPEG) benefit from higher DPI
- Use consistent DPI across your project:
- Set a default DPI in your plotting function or configuration
- Adjust other parameters along with DPI:
- Increase figure size for complex plots
- Adjust font sizes and line widths for readability
Here’s an example that demonstrates these best practices:
import matplotlib.pyplot as plt
import numpy as np

def create_plot(plot_type, output_format, is_interactive=False):
    if is_interactive:
        dpi = 96
    elif output_format in ['svg', 'pdf']:
        dpi = 150
    else:
        dpi = 300

    fig, ax = plt.subplots(figsize=(8, 6))
    fig.set_dpi(dpi)

    x = np.linspace(0, 10, 1000)
    y = np.sin(x) * np.exp(-0.1 * x)

    if plot_type == 'line':
        ax.plot(x, y, linewidth=2)
    elif plot_type == 'scatter':
        ax.scatter(x[::10], y[::10], s=20, alpha=0.5)

    ax.set_title(f'{plot_type.capitalize()} Plot - how2matplotlib.com', fontsize=14)
    ax.set_xlabel('X-axis', fontsize=12)
    ax.set_ylabel('Y-axis', fontsize=12)
    ax.tick_params(axis='both', which='major', labelsize=10)

    plt.tight_layout()

    if not is_interactive:
        plt.savefig(f'{plot_type}_plot.{output_format}', dpi=dpi, bbox_inches='tight')
    else:
        plt.show()

# Create different types of plots with appropriate settings
create_plot('line', 'png')
create_plot('scatter', 'svg')
create_plot('line', 'pdf')
create_plot('scatter', 'png', is_interactive=True)
Conclusion
Matplotlib.figure.Figure.set_dpi() is a powerful tool for controlling the resolution and quality of your plots in Python. By mastering this function, you can create high-quality visualizations suitable for various purposes, from screen display to print publication.
Throughout this guide, we’ve explored the fundamentals of Matplotlib.figure.Figure.set_dpi(), its importance in data visualization, and how to use it effectively in different scenarios. We’ve covered topics such as adjusting DPI for different output formats, optimizing performance, handling high-resolution displays, and troubleshooting common issues.
Remember that while higher DPI generally results in better image quality, it’s essential to balance quality with performance and consider the intended use of your plots. By following the best practices and techniques outlined in this guide, you’ll be well-equipped to create stunning and effective visualizations using Matplotlib.figure.Figure.set_dpi() in Python.