How to Create Stunning Matplotlib Pie Charts: A Comprehensive Guide
Matplotlib pie charts are powerful tools for visualizing data in a circular format. This comprehensive guide will explore the various aspects of creating and customizing pie charts using Matplotlib, a popular data visualization library in Python. We’ll cover everything from basic pie charts to advanced customization techniques, providing you with the knowledge to create stunning visualizations for your data.
Matplotlib pie charts Recommended Articles
- matplotlib pie chart from dataframe
- matplotlib pie chart labels overlap
- matplotlib pie chart legend
- matplotlib pie chart with percentage
Introduction to Matplotlib Pie Charts
Matplotlib pie charts are an excellent way to represent data as proportional segments of a circular graph. They are particularly useful for displaying the composition of a whole or comparing parts to the entire dataset. Pie charts in Matplotlib offer a wide range of customization options, allowing you to create visually appealing and informative visualizations.
Let’s start with a basic example of creating a matplotlib pie chart:
import matplotlib.pyplot as plt

# Data for the pie chart
sizes = [30, 20, 25, 15, 10]
labels = ['A', 'B', 'C', 'D', 'E']

# Create the pie chart
plt.pie(sizes, labels=labels, autopct='%1.1f%%')
plt.title('Basic Matplotlib Pie Chart - how2matplotlib.com')
plt.axis('equal')  # Equal aspect ratio ensures that pie is drawn as a circle
plt.show()
Output:
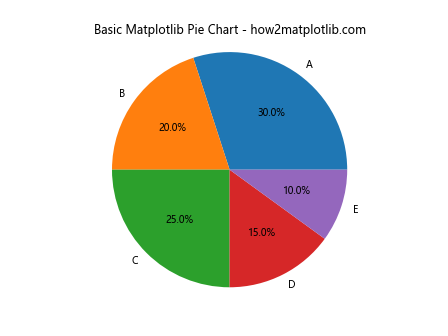
In this example, we create a simple matplotlib pie chart with five segments. The sizes list represents the values for each segment, while the labels list provides the corresponding labels. The autopct parameter adds percentage labels to each slice.
Customizing Colors in Matplotlib Pie Charts
One of the most effective ways to enhance your matplotlib pie charts is by customizing the colors. Matplotlib offers various color options and palettes to make your charts visually appealing and easy to interpret.
Here’s an example of a matplotlib pie chart with custom colors:
import matplotlib.pyplot as plt

sizes = [25, 20, 30, 15, 10]
labels = ['Category A', 'Category B', 'Category C', 'Category D', 'Category E']
colors = ['#ff9999', '#66b3ff', '#99ff99', '#ffcc99', '#ff99cc']

plt.pie(sizes, labels=labels, colors=colors, autopct='%1.1f%%')
plt.title('Matplotlib Pie Chart with Custom Colors - how2matplotlib.com')
plt.axis('equal')
plt.show()
Output:
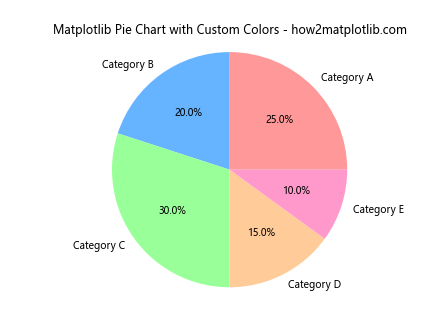
In this example, we use a custom color palette defined in the colors list. Each slice of the pie chart is assigned a specific color, creating a visually striking chart.
Adding Exploded Slices to Matplotlib Pie Charts
To emphasize specific segments in your matplotlib pie chart, you can use the explode feature. This technique separates one or more slices from the main pie, drawing attention to important data points.
Here’s how to create a matplotlib pie chart with exploded slices:
import matplotlib.pyplot as plt

sizes = [35, 25, 20, 15, 5]
labels = ['Product A', 'Product B', 'Product C', 'Product D', 'Product E']
explode = (0.1, 0, 0, 0, 0)  # Explode the first slice

plt.pie(sizes, labels=labels, explode=explode, autopct='%1.1f%%', shadow=True)
plt.title('Matplotlib Pie Chart with Exploded Slice - how2matplotlib.com')
plt.axis('equal')
plt.show()
Output:
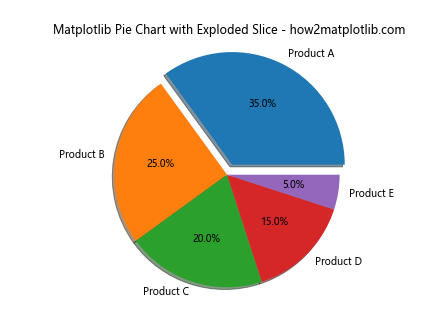
In this example, we use the explode parameter to separate the first slice from the main pie. The shadow parameter adds a subtle shadow effect, enhancing the 3D appearance of the chart.
Customizing Label Formatting in Matplotlib Pie Charts
Matplotlib pie charts allow for extensive customization of label formatting. You can adjust the font size, color, and position of labels to improve readability and visual appeal.
Here’s an example of a matplotlib pie chart with custom label formatting:
import matplotlib.pyplot as plt

sizes = [30, 25, 20, 15, 10]
labels = ['Category 1', 'Category 2', 'Category 3', 'Category 4', 'Category 5']

plt.pie(sizes, labels=labels, autopct='%1.1f%%',
        textprops={'fontsize': 14, 'color': 'white'},
        wedgeprops={'linewidth': 3, 'edgecolor': 'white'})
plt.title('Matplotlib Pie Chart with Custom Label Formatting - how2matplotlib.com', fontsize=16)
plt.axis('equal')
plt.show()
Output:
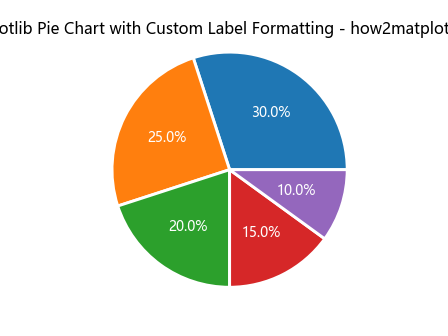
In this example, we use the textprops parameter to customize the font size and color of the labels. The wedgeprops parameter is used to add white borders to each slice, creating a clean and modern look.
Creating Donut Charts with Matplotlib
A variation of the traditional pie chart is the donut chart, which features a hole in the center. Donut charts can be created using Matplotlib by adjusting the wedgeprops parameter.
Here’s how to create a matplotlib donut chart:
import matplotlib.pyplot as plt

sizes = [35, 25, 20, 15, 5]
labels = ['A', 'B', 'C', 'D', 'E']
colors = ['#ff9999', '#66b3ff', '#99ff99', '#ffcc99', '#ff99cc']

plt.pie(sizes, labels=labels, colors=colors, autopct='%1.1f%%',
        wedgeprops={'edgecolor': 'white', 'linewidth': 2, 'width': 0.6})
plt.title('Matplotlib Donut Chart - how2matplotlib.com')
plt.axis('equal')
plt.show()
Output:
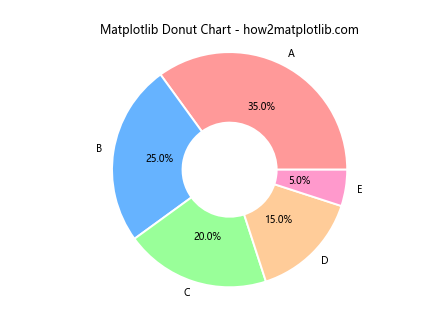
In this example, we use the width parameter within wedgeprops to create the donut shape. The width value of 0.6 means that the outer radius of the donut is 60% of the plot’s radius.
Adding a Legend to Matplotlib Pie Charts
For pie charts with many categories or when you want to provide additional information, adding a legend can be helpful. Matplotlib allows you to easily add and customize legends for your pie charts.
Here’s an example of a matplotlib pie chart with a legend:
import matplotlib.pyplot as plt

sizes = [30, 25, 20, 15, 10]
labels = ['Category A', 'Category B', 'Category C', 'Category D', 'Category E']
colors = ['#ff9999', '#66b3ff', '#99ff99', '#ffcc99', '#ff99cc']

plt.pie(sizes, colors=colors, autopct='%1.1f%%', startangle=90)
plt.title('Matplotlib Pie Chart with Legend - how2matplotlib.com')
plt.axis('equal')
plt.legend(labels, title="Categories", loc="center left", bbox_to_anchor=(1, 0, 0.5, 1))
plt.show()
Output:
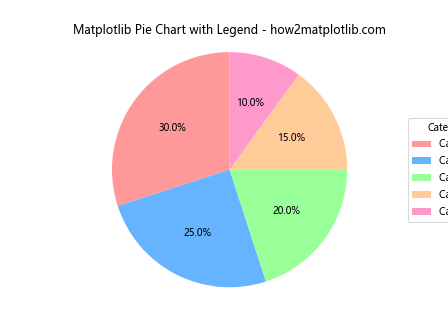
In this example, we use the plt.legend() function to add a legend to the chart. The bbox_to_anchor parameter positions the legend outside the pie chart for better readability.
Creating Nested Pie Charts with Matplotlib
Nested pie charts, also known as multilevel pie charts, allow you to display hierarchical data in a single visualization. Matplotlib provides the flexibility to create these complex charts with relative ease.
Here’s an example of creating a nested matplotlib pie chart:
import matplotlib.pyplot as plt

# Outer pie chart data
sizes_outer = [40, 30, 30]
labels_outer = ['Group A', 'Group B', 'Group C']
colors_outer = ['#ff9999', '#66b3ff', '#99ff99']

# Inner pie chart data
sizes_inner = [15, 25, 10, 20, 30]
labels_inner = ['A1', 'A2', 'B1', 'B2', 'C1']
colors_inner = ['#ff9999', '#ffcccc', '#66b3ff', '#99ccff', '#99ff99']

# Create the outer pie chart
plt.pie(sizes_outer, labels=labels_outer, colors=colors_outer, autopct='%1.1f%%', radius=1.2)

# Create the inner pie chart
plt.pie(sizes_inner, labels=labels_inner, colors=colors_inner, autopct='%1.1f%%', radius=0.8)

plt.title('Nested Matplotlib Pie Chart - how2matplotlib.com')
plt.axis('equal')
plt.show()
Output:
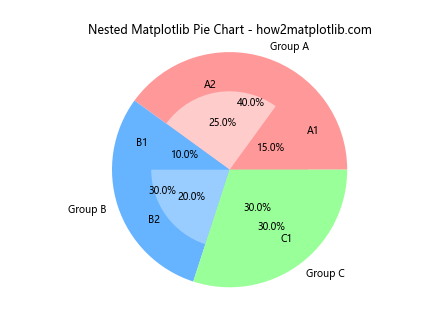
In this example, we create two pie charts with different radii. The outer pie chart represents the main categories, while the inner pie chart shows subcategories. This technique allows for the visualization of hierarchical data in a single chart.
Customizing Text Properties in Matplotlib Pie Charts
Fine-tuning the text properties of your matplotlib pie charts can significantly enhance their readability and visual appeal. You can adjust various aspects such as font size, style, color, and positioning.
Here’s an example of a matplotlib pie chart with customized text properties:
import matplotlib.pyplot as plt

sizes = [30, 25, 20, 15, 10]
labels = ['A', 'B', 'C', 'D', 'E']
colors = ['#ff9999', '#66b3ff', '#99ff99', '#ffcc99', '#ff99cc']

plt.pie(sizes, labels=labels, colors=colors, autopct='%1.1f%%',
        textprops={'fontsize': 14, 'fontweight': 'bold', 'color': 'white'},
        wedgeprops={'linewidth': 2, 'edgecolor': 'white'})
plt.title('Matplotlib Pie Chart with Custom Text Properties - how2matplotlib.com', fontsize=16, fontweight='bold')
plt.axis('equal')
plt.show()
Output:
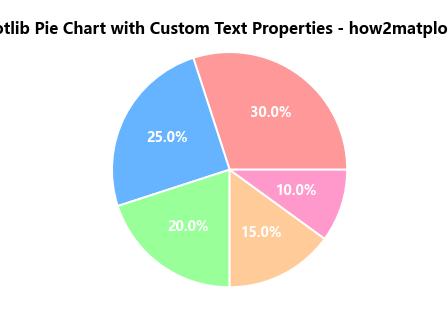
In this example, we use the textprops parameter to customize the font size, weight, and color of the labels and percentages. The title is also customized using the fontsize and fontweight parameters.
Creating Pie Charts with Subplots in Matplotlib
When you need to compare multiple datasets or display related pie charts side by side, using subplots can be an effective solution. Matplotlib allows you to create multiple pie charts within a single figure using subplots.
Here’s an example of creating multiple matplotlib pie charts using subplots:
import matplotlib.pyplot as plt

# Data for the pie charts
sizes1 = [30, 20, 25, 15, 10]
sizes2 = [35, 25, 20, 15, 5]
labels = ['A', 'B', 'C', 'D', 'E']
colors = ['#ff9999', '#66b3ff', '#99ff99', '#ffcc99', '#ff99cc']

# Create a figure with two subplots
fig, (ax1, ax2) = plt.subplots(1, 2, figsize=(12, 6))

# Create the first pie chart
ax1.pie(sizes1, labels=labels, colors=colors, autopct='%1.1f%%')
ax1.set_title('Pie Chart 1 - how2matplotlib.com')

# Create the second pie chart
ax2.pie(sizes2, labels=labels, colors=colors, autopct='%1.1f%%')
ax2.set_title('Pie Chart 2 - how2matplotlib.com')

plt.tight_layout()
plt.show()
Output:
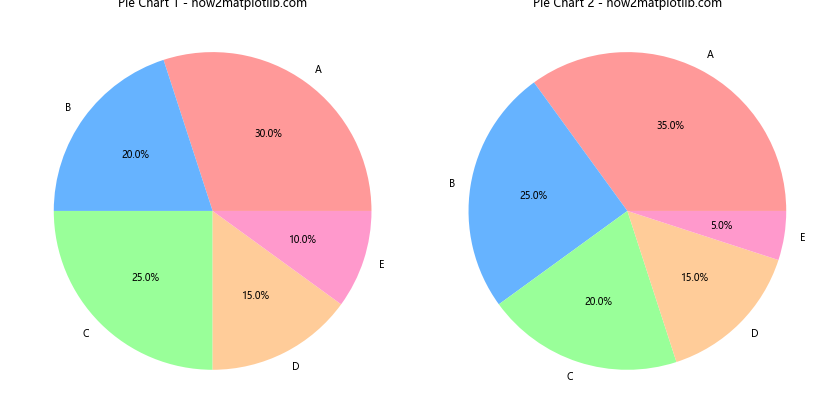
In this example, we create two pie charts side by side using subplots. This allows for easy comparison between different datasets or time periods.
Adding Data Labels to Matplotlib Pie Charts
While percentage labels are useful, sometimes you may want to display the actual data values on your matplotlib pie chart. This can provide more detailed information to your audience.
Here’s how to add data labels to a matplotlib pie chart:
import matplotlib.pyplot as plt

sizes = [300, 250, 200, 150, 100]
labels = ['Product A', 'Product B', 'Product C', 'Product D', 'Product E']
colors = ['#ff9999', '#66b3ff', '#99ff99', '#ffcc99', '#ff99cc']

def make_autopct(values):
    def my_autopct(pct):
        total = sum(values)
        val = int(round(pct*total/100.0))
        return f'{pct:.1f}%\n({val:d})'
    return my_autopct

plt.pie(sizes, labels=labels, colors=colors, autopct=make_autopct(sizes))
plt.title('Matplotlib Pie Chart with Data Labels - how2matplotlib.com')
plt.axis('equal')
plt.show()
Output:
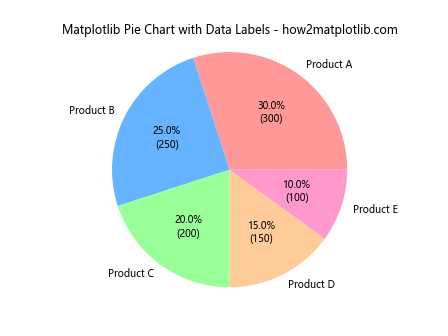
In this example, we define a custom function make_autopct that returns both the percentage and the actual value for each slice. This provides a more comprehensive view of the data.
Creating 3D Pie Charts with Matplotlib
While traditional 2D pie charts are effective, 3D pie charts can add an extra dimension of visual interest to your data visualization. Matplotlib allows you to create 3D pie charts using the mplot3d toolkit.
Here’s an example of creating a 3D matplotlib pie chart:
import matplotlib.pyplot as plt
import numpy as np
from mpl_toolkits.mplot3d import Axes3D

# Pie chart data
sizes = [30, 20, 25, 15, 10]
labels = ['A', 'B', 'C', 'D', 'E']
colors = ['#ff9999', '#66b3ff', '#99ff99', '#ffcc99', '#ff99cc']

# Create a figure and a 3D axis
fig = plt.figure(figsize=(8, 8))
ax = fig.add_subplot(111, projection='3d')

# Create the pie chart
def pie3d(sizes, labels, colors, angle):
    start_angle = 0
    for i in range(len(sizes)):
        end_angle = start_angle + sizes[i] / sum(sizes) * 360
        X = [0] + np.cos(np.radians(np.linspace(start_angle, end_angle, 100))).tolist()
        Y = [0] + np.sin(np.radians(np.linspace(start_angle, end_angle, 100))).tolist()
        Z = [0] * len(X)
        ax.plot_surface(np.array([X] * 2), np.array([Y] * 2), np.array([Z, [0.5] * len(Z)]), color=colors[i])
        ax.text(np.mean(X), np.mean(Y), 0.6, labels[i], ha='center', va='center')
        start_angle = end_angle

pie3d(sizes, labels, colors, angle=30)

ax.set_xlim(-1, 1)
ax.set_ylim(-1, 1)
ax.set_zlim(0, 1)
ax.set_title('3D Matplotlib Pie Chart - how2matplotlib.com')
ax.axis('off')
plt.show()
Output:
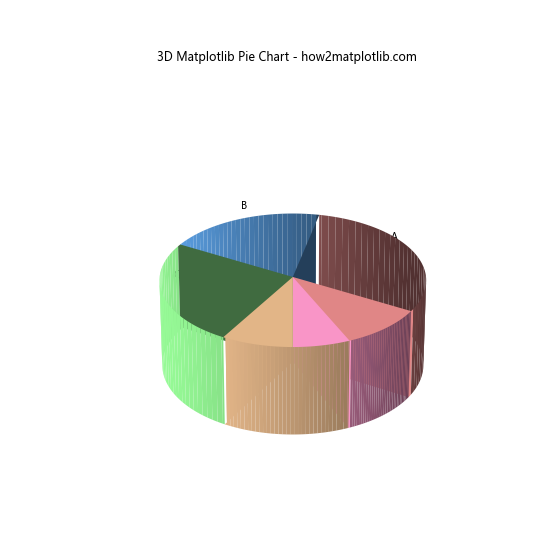
In this example, we use the mplot3d toolkit to create a 3D pie chart. The pie3d function plots each slice as a 3D surface, creating a visually striking representation of the data.
Animating Matplotlib Pie Charts
Adding animation to your matplotlib pie charts can create engaging and dynamic visualizations. This is particularly useful for showing changes in data over time or for presentations.
Here’s an example of creating an animated matplotlib pie chart:
import matplotlib.pyplot as plt
import matplotlib.animation as animation

# Data for the pie chart
sizes = [30, 20, 25, 15, 10]
labels = ['A', 'B', 'C', 'D', 'E']
colors = ['#ff9999', '#66b3ff', '#99ff99', '#ffcc99', '#ff99cc']

fig, ax = plt.subplots()

def animate(i):
    ax.clear()
    explode = [0.1 if j == i % len(sizes) else 0 for j in range(len(sizes))]
    ax.pie(sizes, labels=labels, colors=colors, explode=explode, autopct='%1.1f%%', startangle=90)
    ax.set_title('Animated Matplotlib Pie Chart - how2matplotlib.com')
    ax.axis('equal')

ani = animation.FuncAnimation(fig, animate, frames=len(sizes), repeat=True, interval=1000)
plt.show()
Output:
In this example, we use Matplotlib’s animation module to create an animated pie chart. The animate function is called repeatedly, updating the exploded slice in each frame to create a rotating effect.
Handling Small Slices in Matplotlib Pie Charts
When dealing with datasets that include very small values, pie charts can become cluttered and hard to read. Matplotlib provides solutions to handle these small slices effectively.
Here’s an example of handling small slices in a matplotlib pie chart:
import matplotlib.pyplot as plt

sizes = [30, 25, 20, 15, 5, 3, 2]
labels = ['A', 'B', 'C', 'D', 'E', 'F', 'G']
colors = ['#ff9999', '#66b3ff', '#99ff99', '#ffcc99', '#ff99cc', '#ffcc66', '#99ccff']

def make_autopct(values):
    def my_autopct(pct):
        total = sum(values)
        val = int(round(pct*total/100.0))
        return f'{pct:.1f}%\n({val:d})' if pct > 5 else ''
    return my_autopct

plt.pie(sizes, labels=labels, colors=colors, autopct=make_autopct(sizes))
plt.title('Matplotlib Pie Chart Handling Small Slices - how2matplotlib.com')
plt.axis('equal')
plt.show()
Output:
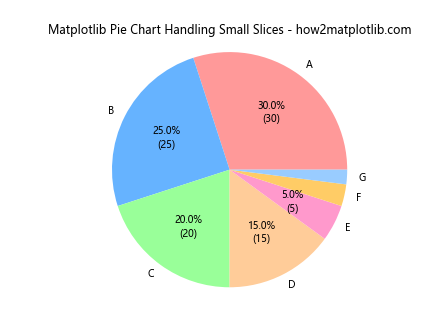
In this example, we use a custom function to only display labels and values for slices that represent more than 5% of the total. This helps to reduce clutter and improve readability.
Creating Semi-Circle Pie Charts with Matplotlib
Sometimes, you might want to create a semi-circle or half pie chart for aesthetic reasons or to save space. Matplotlib allows you to easily create these variations of pie charts.
Here’s an example of creating a semi-circle matplotlib pie chart:
import matplotlib.pyplot as plt

sizes = [30, 25, 20, 15, 10]
labels = ['A', 'B', 'C', 'D', 'E']
colors = ['#ff9999', '#66b3ff', '#99ff99', '#ffcc99', '#ff99cc']

plt.pie(sizes, labels=labels, colors=colors, autopct='%1.1f%%', startangle=90, counterclock=False)
plt.title('Semi-Circle Matplotlib Pie Chart - how2matplotlib.com')
plt.axis('equal')
plt.ylim(-0.5, 1)
plt.show()
Output:
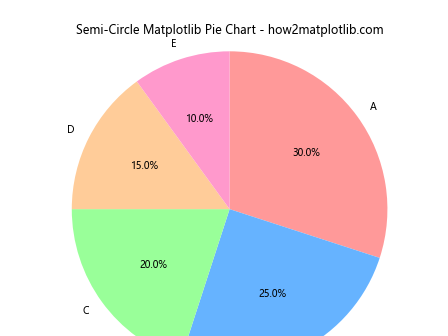
In this example, we use the startangle parameter to start the first slice at the 3 o’clock position, and counterclock=False to draw the slices clockwise. The ylim parameter is used to show only the top half of the pie.
Combining Pie Charts with Other Plot Types in Matplotlib
Matplotlib’s flexibility allows you to combine pie charts with other types of plots, creating rich and informative visualizations. This can be particularly useful when you want to provide multiple perspectives on your data.
Here’s an example of combining a matplotlib pie chart with a bar chart:
import matplotlib.pyplot as plt

# Data for pie chart
pie_sizes = [30, 25, 20, 15, 10]
pie_labels = ['A', 'B', 'C', 'D', 'E']
pie_colors = ['#ff9999', '#66b3ff', '#99ff99', '#ffcc99', '#ff99cc']

# Data for bar chart
bar_labels = ['Category 1', 'Category 2', 'Category 3']
bar_sizes = [40, 35, 25]

fig, (ax1, ax2) = plt.subplots(1, 2, figsize=(12, 6))

# Create pie chart
ax1.pie(pie_sizes, labels=pie_labels, colors=pie_colors, autopct='%1.1f%%', startangle=90)
ax1.set_title('Pie Chart - how2matplotlib.com')
ax1.axis('equal')

# Create bar chart
ax2.bar(bar_labels, bar_sizes, color='#66b3ff')
ax2.set_title('Bar Chart - how2matplotlib.com')
ax2.set_ylabel('Values')

plt.tight_layout()
plt.show()
Output:
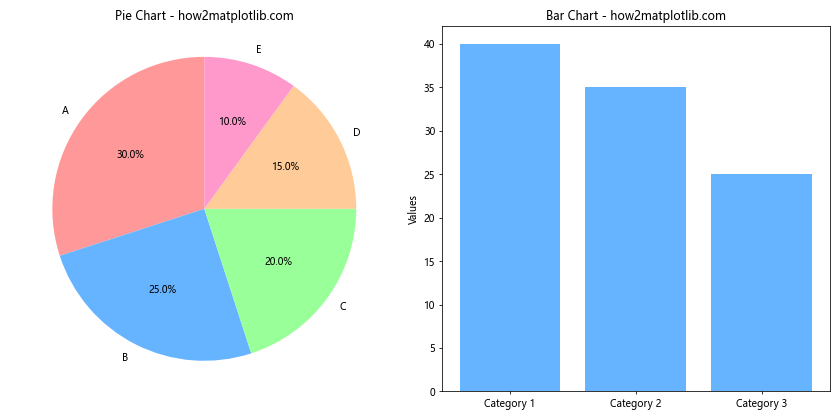
In this example, we create a figure with two subplots: one for a pie chart and another for a bar chart. This combination allows for a more comprehensive view of the data.
Customizing the Aspect Ratio of Matplotlib Pie Charts
The aspect ratio of your matplotlib pie chart can significantly impact its appearance and readability. While pie charts are typically circular, you might want to adjust the aspect ratio for specific layout requirements.
Here’s an example of customizing the aspect ratio of a matplotlib pie chart:
import matplotlib.pyplot as plt

sizes = [30, 25, 20, 15, 10]
labels = ['A', 'B', 'C', 'D', 'E']
colors = ['#ff9999', '#66b3ff', '#99ff99', '#ffcc99', '#ff99cc']

fig, ax = plt.subplots(figsize=(10, 6))
ax.pie(sizes, labels=labels, colors=colors, autopct='%1.1f%%', startangle=90)
ax.set_title('Matplotlib Pie Chart with Custom Aspect Ratio - how2matplotlib.com')
ax.set_aspect('equal')
plt.show()
Output:
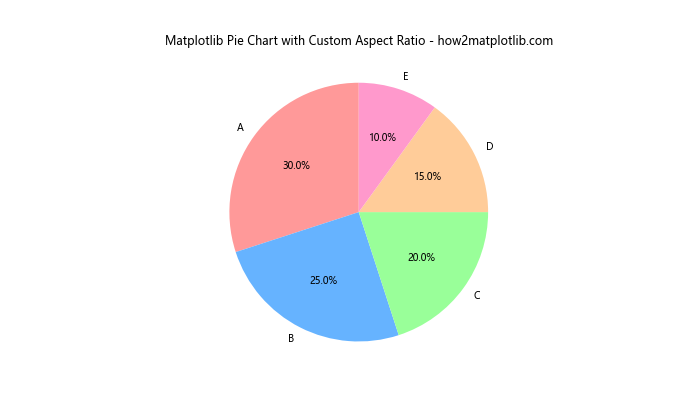
In this example, we use figsize=(10, 6) to create a rectangular figure, and ax.set_aspect('equal') to ensure that the pie chart remains circular within this rectangular frame.
Matplotlib pie charts Conclusion
Matplotlib pie charts are versatile tools for data visualization that offer a wide range of customization options. From basic pie charts to advanced techniques like nested charts, 3D representations, and animations, Matplotlib provides the flexibility to create stunning and informative visualizations.
By mastering the various aspects of matplotlib pie charts covered in this guide, you’ll be well-equipped to create compelling data visualizations that effectively communicate your insights. Remember to consider your audience and the nature of your data when choosing how to present your pie charts, and don’t hesitate to experiment with different styles and combinations to find the most effective representation for your data.
Whether you’re creating simple charts for quick data analysis or developing complex visualizations for presentations and reports, the techniques covered in this guide will help you make the most of matplotlib pie charts in your data visualization projects.