How to Master Matplotlib Errorbar: A Comprehensive Guide
Matplotlib Errorbar is a powerful tool for visualizing data with error bars in Python. This comprehensive guide will explore the various aspects of using Matplotlib Errorbar to create informative and visually appealing plots. We’ll cover everything from basic usage to advanced techniques, providing you with the knowledge and skills to effectively incorporate error bars into your data visualizations.
Matplotlib Errorbar Recommended Articles
- matplotlib errorbar style
- matplotlib errorbar no line
- matplotlib errorbar color
- matplotlib errorbar marker size
Understanding Matplotlib Errorbar Basics
Matplotlib Errorbar is a function in the Matplotlib library that allows you to create plots with error bars. Error bars are graphical representations of the variability of data and are often used to indicate the error or uncertainty in a measurement. They are particularly useful in scientific and statistical visualizations.
Let’s start with a simple example to demonstrate the basic usage of Matplotlib Errorbar:
import matplotlib.pyplot as plt
import numpy as np

x = np.linspace(0, 10, 50)
y = np.sin(x)
yerr = 0.1 + 0.2 * np.random.rand(len(x))

plt.errorbar(x, y, yerr=yerr, fmt='o', label='Data')
plt.title('Basic Matplotlib Errorbar Example - how2matplotlib.com')
plt.xlabel('X-axis')
plt.ylabel('Y-axis')
plt.legend()
plt.show()
Output:
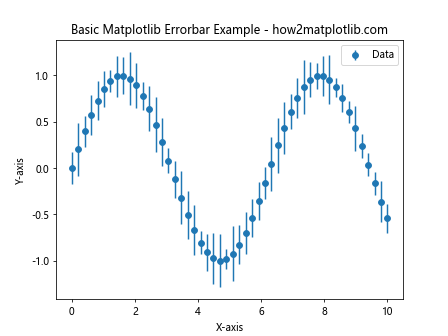
In this example, we create a simple sine wave plot with error bars. The errorbar function takes the x and y data points, along with the yerr parameter to specify the error values. The fmt='o' argument sets the marker style to circles.
Customizing Matplotlib Errorbar Appearance
Matplotlib Errorbar offers various options to customize the appearance of your error bars. You can adjust the color, line style, cap size, and more. Let’s explore some of these customization options:
import matplotlib.pyplot as plt
import numpy as np

x = np.linspace(0, 10, 10)
y = np.exp(-x/10)
yerr = 0.1 + 0.2 * np.random.rand(len(x))

plt.errorbar(x, y, yerr=yerr, fmt='s', color='red', ecolor='green',
             capsize=5, capthick=2, elinewidth=1, label='Custom Errorbar')
plt.title('Customized Matplotlib Errorbar - how2matplotlib.com')
plt.xlabel('X-axis')
plt.ylabel('Y-axis')
plt.legend()
plt.show()
Output:
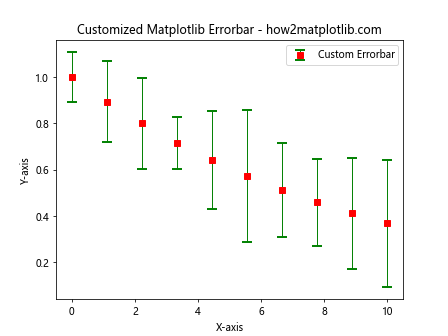
In this example, we’ve customized the error bars by setting:
fmt='s': Square markerscolor='red': Red color for the markers and connecting lineecolor='green': Green color for the error barscapsize=5: Size of the error bar capscapthick=2: Thickness of the error bar capselinewidth=1: Width of the error bar lines
Adding Horizontal Error Bars with Matplotlib Errorbar
While vertical error bars are more common, Matplotlib Errorbar also supports horizontal error bars. You can use the xerr parameter to add horizontal error bars to your plot:
import matplotlib.pyplot as plt
import numpy as np

x = np.linspace(0, 10, 8)
y = np.sin(x)
xerr = 0.2 + 0.4 * np.random.rand(len(x))
yerr = 0.1 + 0.2 * np.random.rand(len(x))

plt.errorbar(x, y, xerr=xerr, yerr=yerr, fmt='o',
             label='Data with X and Y errors')
plt.title('Matplotlib Errorbar with X and Y Errors - how2matplotlib.com')
plt.xlabel('X-axis')
plt.ylabel('Y-axis')
plt.legend()
plt.show()
Output:
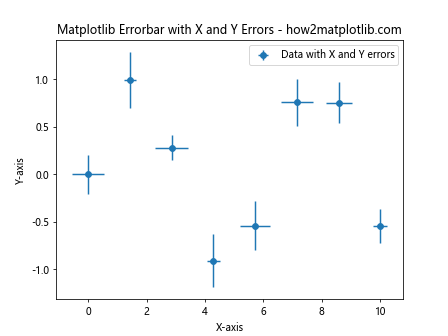
This example demonstrates how to add both horizontal and vertical error bars to your plot using the xerr and yerr parameters.
Using Asymmetric Error Bars in Matplotlib Errorbar
Matplotlib Errorbar allows you to specify asymmetric error bars, where the upper and lower error values can be different. This is particularly useful when dealing with data that has asymmetric uncertainties:
import matplotlib.pyplot as plt
import numpy as np

x = np.linspace(0, 10, 10)
y = np.exp(-x/10)
yerr_lower = 0.1 + 0.2 * np.random.rand(len(x))
yerr_upper = 0.2 + 0.4 * np.random.rand(len(x))

plt.errorbar(x, y, yerr=[yerr_lower, yerr_upper], fmt='o',
             label='Asymmetric Errors')
plt.title('Matplotlib Errorbar with Asymmetric Errors - how2matplotlib.com')
plt.xlabel('X-axis')
plt.ylabel('Y-axis')
plt.legend()
plt.show()
Output:
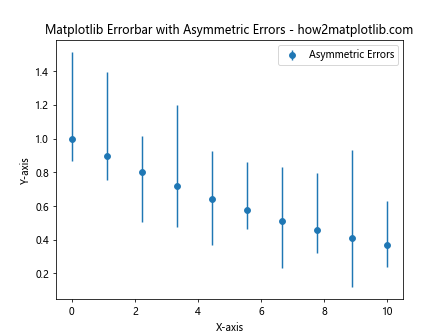
In this example, we’ve specified different lower and upper error values using a list [yerr_lower, yerr_upper] for the yerr parameter.
Creating Matplotlib Errorbar Plots with Multiple Datasets
You can use Matplotlib Errorbar to plot multiple datasets on the same graph, each with its own error bars. This is useful for comparing different sets of data:
import matplotlib.pyplot as plt
import numpy as np

x = np.linspace(0, 10, 10)
y1 = np.sin(x)
y2 = np.cos(x)
yerr1 = 0.1 + 0.1 * np.random.rand(len(x))
yerr2 = 0.2 + 0.2 * np.random.rand(len(x))

plt.errorbar(x, y1, yerr=yerr1, fmt='o-', label='Dataset 1')
plt.errorbar(x, y2, yerr=yerr2, fmt='s-', label='Dataset 2')
plt.title('Multiple Datasets with Matplotlib Errorbar - how2matplotlib.com')
plt.xlabel('X-axis')
plt.ylabel('Y-axis')
plt.legend()
plt.show()
Output:
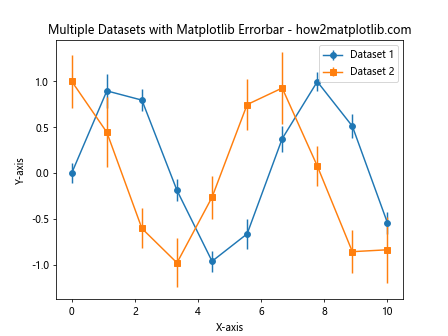
This example shows how to plot two different datasets, each with its own error bars and styling.
Matplotlib Errorbar with Logarithmic Scales
When dealing with data that spans multiple orders of magnitude, it’s often useful to use logarithmic scales. Matplotlib Errorbar works seamlessly with logarithmic scales:
import matplotlib.pyplot as plt
import numpy as np

x = np.logspace(0, 2, 20)
y = x**2
yerr = y * 0.1

plt.errorbar(x, y, yerr=yerr, fmt='o')
plt.xscale('log')
plt.yscale('log')
plt.title('Matplotlib Errorbar with Log Scales - how2matplotlib.com')
plt.xlabel('X-axis (log scale)')
plt.ylabel('Y-axis (log scale)')
plt.show()
Output:
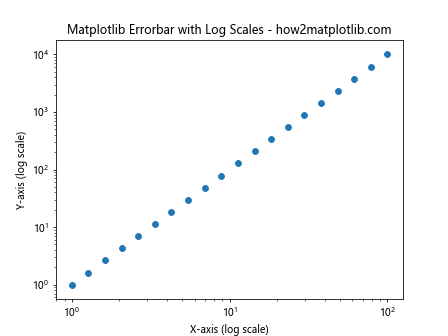
In this example, we’ve used plt.xscale('log') and plt.yscale('log') to set both axes to logarithmic scales.
Customizing Error Bar Caps in Matplotlib Errorbar
You can further customize the appearance of error bar caps in Matplotlib Errorbar. Here’s an example that demonstrates how to change the cap width and style:
import matplotlib.pyplot as plt
import numpy as np

x = np.linspace(0, 10, 10)
y = np.sin(x)
yerr = 0.2 + 0.2 * np.random.rand(len(x))

_, caps, _ = plt.errorbar(x, y, yerr=yerr, fmt='o', capsize=10,
                          capthick=2, label='Custom Caps')

for cap in caps:
    cap.set_markeredgewidth(1)
    cap.set_markersize(10)

plt.title('Matplotlib Errorbar with Custom Caps - how2matplotlib.com')
plt.xlabel('X-axis')
plt.ylabel('Y-axis')
plt.legend()
plt.show()
Output:
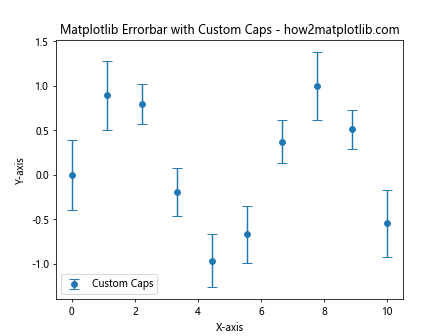
In this example, we’ve increased the capsize and capthick parameters, and then used the returned caps object to further customize the cap appearance.
Using Matplotlib Errorbar with Pandas DataFrames
Matplotlib Errorbar integrates well with Pandas DataFrames, making it easy to visualize data from tabular sources:
import matplotlib.pyplot as plt
import pandas as pd
import numpy as np

# Create a sample DataFrame
df = pd.DataFrame({
    'x': np.linspace(0, 10, 10),
    'y': np.sin(np.linspace(0, 10, 10)),
    'yerr': 0.1 + 0.2 * np.random.rand(10)
})

plt.errorbar(df['x'], df['y'], yerr=df['yerr'], fmt='o',
             label='Data from DataFrame')
plt.title('Matplotlib Errorbar with Pandas DataFrame - how2matplotlib.com')
plt.xlabel('X-axis')
plt.ylabel('Y-axis')
plt.legend()
plt.show()
Output:
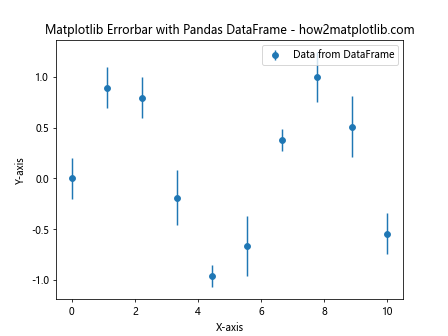
This example demonstrates how to use Matplotlib Errorbar with data stored in a Pandas DataFrame.
Creating Filled Error Bands with Matplotlib Errorbar
While Matplotlib Errorbar typically draws error bars as lines, you can also create filled error bands for a different visual effect:
import matplotlib.pyplot as plt
import numpy as np

x = np.linspace(0, 10, 50)
y = np.sin(x)
yerr = 0.2 + 0.2 * np.random.rand(len(x))

plt.plot(x, y, 'b-', label='Data')
plt.fill_between(x, y-yerr, y+yerr, alpha=0.3, label='Error Band')
plt.title('Filled Error Band with Matplotlib - how2matplotlib.com')
plt.xlabel('X-axis')
plt.ylabel('Y-axis')
plt.legend()
plt.show()
Output:
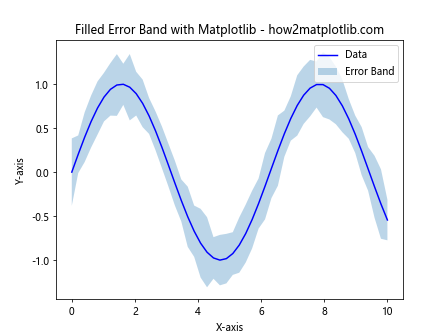
In this example, we’ve used plt.fill_between() to create a filled error band instead of traditional error bars.
Matplotlib Errorbar with Categorical Data
Matplotlib Errorbar can also be used with categorical data. Here’s an example that demonstrates how to create a bar plot with error bars for categorical data:
import matplotlib.pyplot as plt
import numpy as np

categories = ['A', 'B', 'C', 'D', 'E']
values = [3, 5, 2, 7, 4]
errors = [0.5, 1, 0.7, 1.2, 0.9]

x = np.arange(len(categories))
plt.bar(x, values, yerr=errors, align='center', alpha=0.8,
        ecolor='black', capsize=10, label='Data')
plt.xticks(x, categories)
plt.title('Matplotlib Errorbar with Categorical Data - how2matplotlib.com')
plt.xlabel('Categories')
plt.ylabel('Values')
plt.legend()
plt.show()
Output:
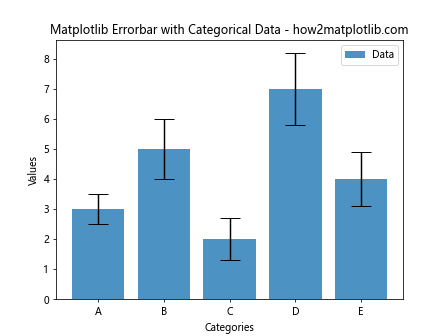
This example shows how to create a bar plot with error bars for categorical data using Matplotlib Errorbar.
Advanced Matplotlib Errorbar Techniques
Let’s explore some advanced techniques for using Matplotlib Errorbar to create more complex and informative visualizations.
Errorbar Plot with Shaded Confidence Interval
You can combine error bars with a shaded confidence interval for a more comprehensive visualization of uncertainty:
import matplotlib.pyplot as plt
import numpy as np

x = np.linspace(0, 10, 50)
y = np.sin(x)
yerr = 0.2 + 0.2 * np.random.rand(len(x))

plt.errorbar(x, y, yerr=yerr, fmt='o', label='Data Points')
plt.fill_between(x, y-yerr, y+yerr, alpha=0.3, label='Confidence Interval')
plt.plot(x, y, 'r-', label='Trend Line')
plt.title('Errorbar with Shaded Confidence Interval - how2matplotlib.com')
plt.xlabel('X-axis')
plt.ylabel('Y-axis')
plt.legend()
plt.show()
Output:
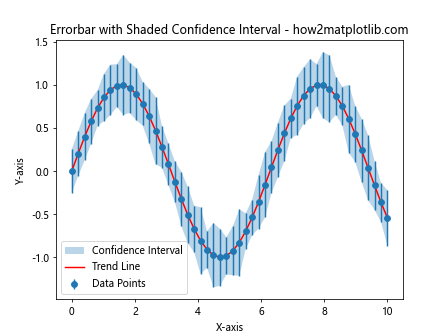
This example combines error bars, a shaded confidence interval, and a trend line for a comprehensive visualization of the data and its uncertainty.
Errorbar Plot with Varying Error Bar Colors
You can vary the color of error bars based on certain conditions or data values:
import matplotlib.pyplot as plt
import numpy as np

x = np.linspace(0, 10, 20)
y = np.sin(x)
yerr = 0.1 + 0.2 * np.random.rand(len(x))

colors = ['red' if err > 0.2 else 'blue' for err in yerr]

for i in range(len(x)):
    plt.errorbar(x[i], y[i], yerr=yerr[i], fmt='o', color=colors[i])

plt.title('Matplotlib Errorbar with Varying Colors - how2matplotlib.com')
plt.xlabel('X-axis')
plt.ylabel('Y-axis')
plt.show()
Output:
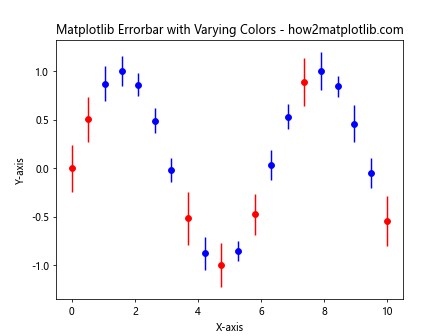
In this example, we’ve colored the error bars red if the error is greater than 0.2, and blue otherwise.
Errorbar Plot with Annotations
You can add annotations to your errorbar plot to highlight specific data points or provide additional information:
import matplotlib.pyplot as plt
import numpy as np

x = np.linspace(0, 10, 10)
y = np.sin(x)
yerr = 0.1 + 0.2 * np.random.rand(len(x))

plt.errorbar(x, y, yerr=yerr, fmt='o', label='Data')

# Add annotations
for i in range(len(x)):
    if yerr[i] > 0.25:
        plt.annotate(f'High error: {yerr[i]:.2f}', (x[i], y[i]),
                     xytext=(5, 5), textcoords='offset points')

plt.title('Matplotlib Errorbar with Annotations - how2matplotlib.com')
plt.xlabel('X-axis')
plt.ylabel('Y-axis')
plt.legend()
plt.show()
Output:
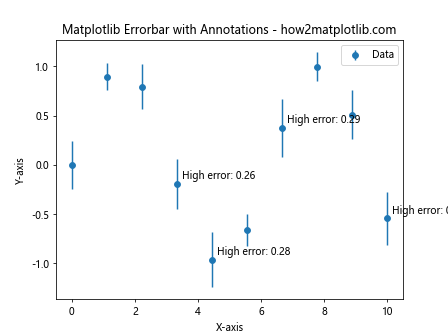
This example adds annotations to data points where the error is greater than 0.25.
Errorbar Plot with Subplots
You can create multiple errorbar plots in subplots for easy comparison:
import matplotlib.pyplot as plt
import numpy as np

x = np.linspace(0, 10, 20)
y1 = np.sin(x)
y2 = np.cos(x)
yerr1 = 0.1 + 0.1 * np.random.rand(len(x))
yerr2 = 0.2 + 0.2 * np.random.rand(len(x))

fig, (ax1, ax2) = plt.subplots(1, 2, figsize=(12, 5))

ax1.errorbar(x, y1, yerr=yerr1, fmt='o-', label='Sin(x)')
ax1.set_title('Sin(x) with Errorbars - how2matplotlib.com')
ax1.set_xlabel('X-axis')
ax1.set_ylabel('Y-axis')
ax1.legend()

ax2.errorbar(x, y2, yerr=yerr2, fmt='s-', label='Cos(x)')
ax2.set_title('Cos(x) with Errorbars - how2matplotlib.com')
ax2.set_xlabel('X-axis')
ax2.set_ylabel('Y-axis')
ax2.legend()

plt.tight_layout()
plt.show()
Output:
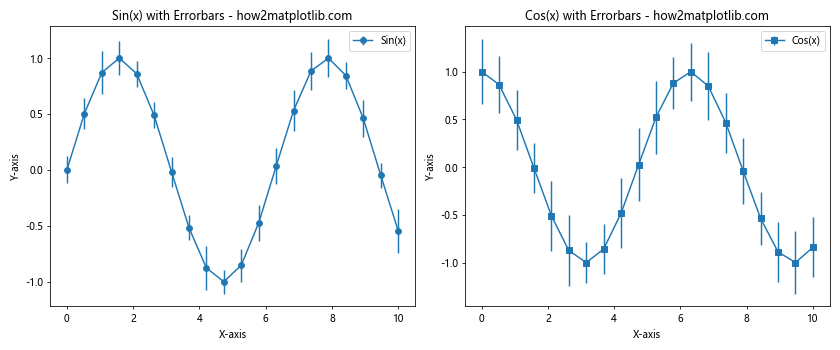
This example creates two subplots, each containing an errorbar plot for different functions.
Best Practices for Using Matplotlib Errorbar
When working with Matplotlib Errorbar, it’s important to follow some best practices to ensure your visualizations are clear, informative, and effective:
- Choose appropriate error values: Make sure your error values accurately represent the uncertainty in your data.
Use clear labels and titles: Always include descriptive labels for your axes and a clear title for your plot.
Consider your audience: Adjust the complexity of your plot based on your target audience.
Use color effectively: Choose colors that are easy to distinguish and consider color-blind friendly palettes.
Don’t overcrowd your plot: Avoid adding too many data points or error bars, which can make the plot difficult to read.
Use appropriate scales: Consider using logarithmic scales for data that spans multiple orders of magnitude.
Provide a legend: When plotting multiple datasets, always include a clear legend.
Consider asymmetric errors: If your data has asymmetric uncertainties, use asymmetric error bars to accurately represent this.
Be consistent: When creating multiple plots for comparison, use consistent styling and scales.
Explain your error bars: In your figure caption or accompanying text, explain what the error bars represent (e.g., standard deviation, standard error, etc.).
Troubleshooting Common Matplotlib Errorbar Issues
When working with Matplotlib Errorbar, you may encounter some common issues. Here are some problems and their solutions: