How to Customize Matplotlib Errorbar Marker Size: A Comprehensive Guide
Matplotlib errorbar marker size is an essential aspect of data visualization that allows you to control the appearance of error bars and their associated markers in your plots. This article will provide a detailed exploration of how to adjust the marker size in errorbar plots using Matplotlib, offering numerous examples and explanations to help you master this crucial aspect of data visualization.
Understanding Matplotlib Errorbar Marker Size
Matplotlib errorbar marker size refers to the dimensions of the markers used in errorbar plots. These markers typically represent data points, while the error bars indicate the uncertainty or variability associated with each point. By adjusting the marker size, you can emphasize certain data points or improve the overall readability of your plot.
Let’s start with a basic example to illustrate how to create an errorbar plot and set the marker size:
import matplotlib.pyplot as plt
import numpy as np

x = np.linspace(0, 10, 10)
y = np.sin(x)
yerr = 0.1 + 0.2 * np.random.rand(len(x))

plt.figure(figsize=(10, 6))
plt.errorbar(x, y, yerr=yerr, fmt='o', markersize=8, capsize=5)
plt.title('Basic Errorbar Plot with Custom Marker Size - how2matplotlib.com')
plt.xlabel('X-axis')
plt.ylabel('Y-axis')
plt.show()
Output:
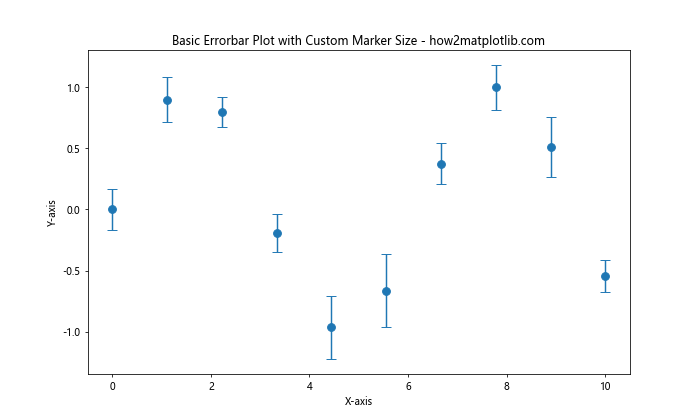
In this example, we create a simple errorbar plot using sine wave data. The markersize parameter is set to 8, which determines the size of the markers. The capsize parameter is set to 5, which controls the width of the error bar caps.
Adjusting Matplotlib Errorbar Marker Size
You can easily adjust the marker size by modifying the markersize parameter in the errorbar function. Let’s explore different marker sizes:
import matplotlib.pyplot as plt
import numpy as np

x = np.linspace(0, 10, 10)
y = np.cos(x)
yerr = 0.1 + 0.1 * np.random.rand(len(x))

plt.figure(figsize=(15, 5))

for i, size in enumerate([4, 8, 12]):
    plt.subplot(1, 3, i+1)
    plt.errorbar(x, y, yerr=yerr, fmt='o', markersize=size, capsize=5)
    plt.title(f'Marker Size: {size} - how2matplotlib.com')
    plt.xlabel('X-axis')
    plt.ylabel('Y-axis')

plt.tight_layout()
plt.show()
Output:
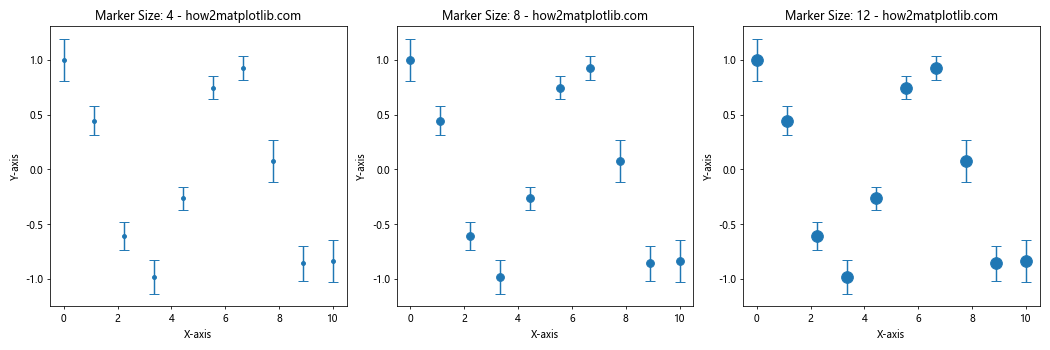
This example demonstrates three different marker sizes (4, 8, and 12) in separate subplots. You can observe how the marker size affects the visibility and emphasis of data points.
Customizing Matplotlib Errorbar Marker Style
In addition to size, you can also customize the marker style. Matplotlib offers various marker styles that you can use in combination with different sizes:
import matplotlib.pyplot as plt
import numpy as np

x = np.linspace(0, 10, 10)
y = np.exp(-x/10)
yerr = 0.05 + 0.05 * np.random.rand(len(x))

marker_styles = ['o', 's', '^', 'D']
marker_sizes = [6, 8, 10, 12]

plt.figure(figsize=(15, 5))

for i, (style, size) in enumerate(zip(marker_styles, marker_sizes)):
    plt.subplot(1, 4, i+1)
    plt.errorbar(x, y, yerr=yerr, fmt=style, markersize=size, capsize=5)
    plt.title(f'Style: {style}, Size: {size} - how2matplotlib.com')
    plt.xlabel('X-axis')
    plt.ylabel('Y-axis')

plt.tight_layout()
plt.show()
Output:
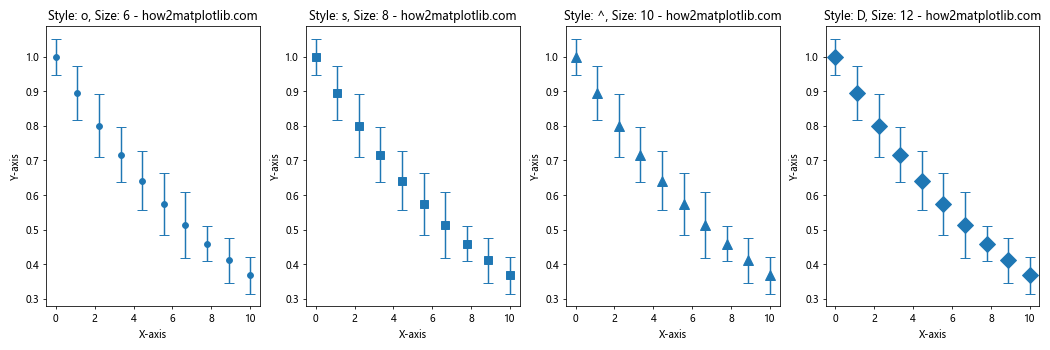
This example showcases different marker styles (‘o’ for circle, ‘s’ for square, ‘^’ for triangle, and ‘D’ for diamond) with varying sizes. You can experiment with different combinations to find the most suitable representation for your data.
Matplotlib Errorbar Marker Size and Color
You can further enhance your errorbar plots by combining marker size adjustments with color customization:
import matplotlib.pyplot as plt
import numpy as np

x = np.linspace(0, 10, 10)
y = np.log(x + 1)
yerr = 0.1 + 0.1 * np.random.rand(len(x))

colors = ['red', 'green', 'blue', 'purple']
marker_sizes = [6, 8, 10, 12]

plt.figure(figsize=(15, 5))

for i, (color, size) in enumerate(zip(colors, marker_sizes)):
    plt.subplot(1, 4, i+1)
    plt.errorbar(x, y, yerr=yerr, fmt='o', markersize=size, color=color, capsize=5)
    plt.title(f'Color: {color}, Size: {size} - how2matplotlib.com')
    plt.xlabel('X-axis')
    plt.ylabel('Y-axis')

plt.tight_layout()
plt.show()
Output:
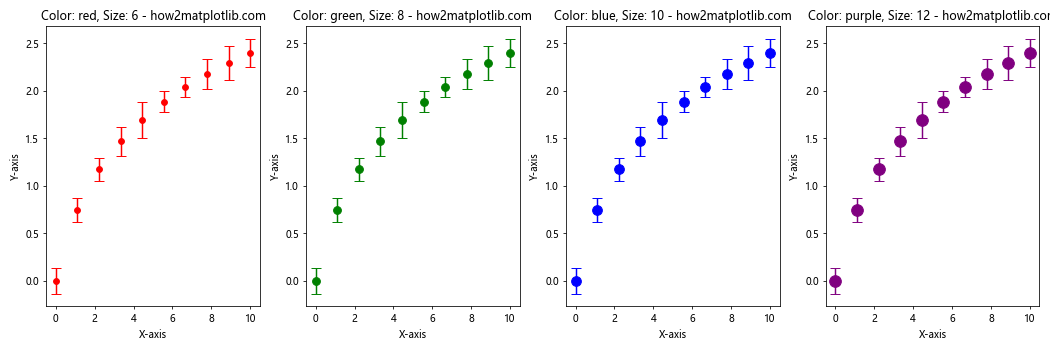
This example demonstrates how to combine different marker sizes with various colors, allowing you to create visually appealing and informative errorbar plots.
Matplotlib Errorbar Marker Size in Scatter Plots
You can also incorporate errorbar marker size adjustments in scatter plots for a more detailed visualization:
import matplotlib.pyplot as plt
import numpy as np

x = np.linspace(0, 10, 20)
y = np.sin(x) + 0.1 * np.random.randn(len(x))
yerr = 0.1 + 0.2 * np.random.rand(len(x))
sizes = 50 + 100 * np.random.rand(len(x))

plt.figure(figsize=(10, 6))
plt.scatter(x, y, s=sizes, alpha=0.5, label='Data points')
plt.errorbar(x, y, yerr=yerr, fmt='none', ecolor='red', capsize=5)
plt.title('Scatter Plot with Errorbars - how2matplotlib.com')
plt.xlabel('X-axis')
plt.ylabel('Y-axis')
plt.legend()
plt.show()
Output:
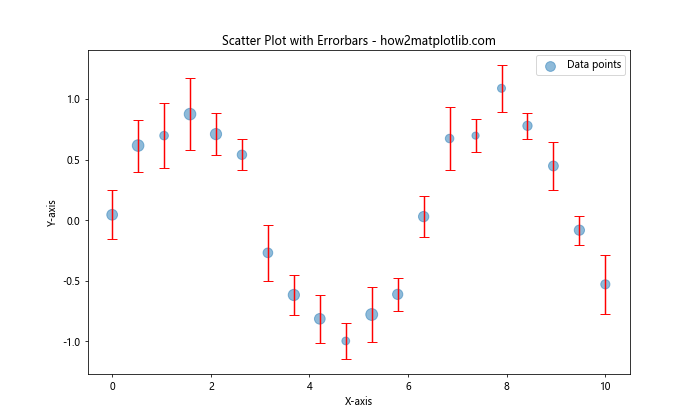
In this example, we combine a scatter plot with errorbars. The scatter plot markers have varying sizes controlled by the sizes array, while the errorbars are added separately using the errorbar function.
Matplotlib Errorbar Marker Size in Multiple Datasets
When working with multiple datasets, you can use different marker sizes to distinguish between them:
import matplotlib.pyplot as plt
import numpy as np

x = np.linspace(0, 10, 10)
y1 = np.sin(x)
y2 = np.cos(x)
yerr1 = 0.1 + 0.1 * np.random.rand(len(x))
yerr2 = 0.1 + 0.1 * np.random.rand(len(x))

plt.figure(figsize=(10, 6))
plt.errorbar(x, y1, yerr=yerr1, fmt='o', markersize=8, capsize=5, label='Dataset 1')
plt.errorbar(x, y2, yerr=yerr2, fmt='s', markersize=6, capsize=5, label='Dataset 2')
plt.title('Multiple Datasets with Different Marker Sizes - how2matplotlib.com')
plt.xlabel('X-axis')
plt.ylabel('Y-axis')
plt.legend()
plt.show()
Output:
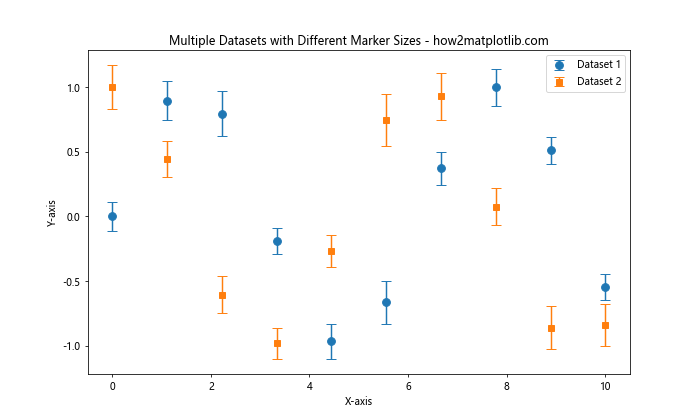
This example shows how to plot two datasets with different marker sizes and styles, making it easy to distinguish between them visually.
Matplotlib Errorbar Marker Size and Line Style
You can combine marker size adjustments with custom line styles for a more comprehensive visualization:
import matplotlib.pyplot as plt
import numpy as np

x = np.linspace(0, 10, 10)
y = np.exp(-x/5)
yerr = 0.1 + 0.1 * np.random.rand(len(x))

plt.figure(figsize=(10, 6))
plt.errorbar(x, y, yerr=yerr, fmt='o-', markersize=8, capsize=5, linewidth=2, linestyle='--')
plt.title('Errorbar Plot with Custom Marker Size and Line Style - how2matplotlib.com')
plt.xlabel('X-axis')
plt.ylabel('Y-axis')
plt.show()
Output:
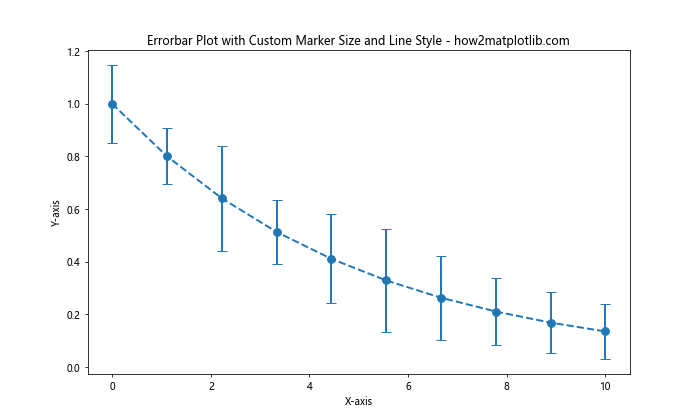
In this example, we use a dashed line style (‘–‘) and a larger linewidth (2) to connect the data points, while still maintaining a custom marker size of 8.
Matplotlib Errorbar Marker Size in Logarithmic Scales
When working with logarithmic scales, marker size adjustments can help improve visibility:
import matplotlib.pyplot as plt
import numpy as np

x = np.logspace(0, 2, 20)
y = np.log10(x) + 0.1 * np.random.randn(len(x))
yerr = 0.1 + 0.2 * np.random.rand(len(x))

plt.figure(figsize=(10, 6))
plt.errorbar(x, y, yerr=yerr, fmt='o', markersize=8, capsize=5)
plt.xscale('log')
plt.title('Errorbar Plot with Logarithmic X-axis - how2matplotlib.com')
plt.xlabel('X-axis (log scale)')
plt.ylabel('Y-axis')
plt.grid(True)
plt.show()
Output:
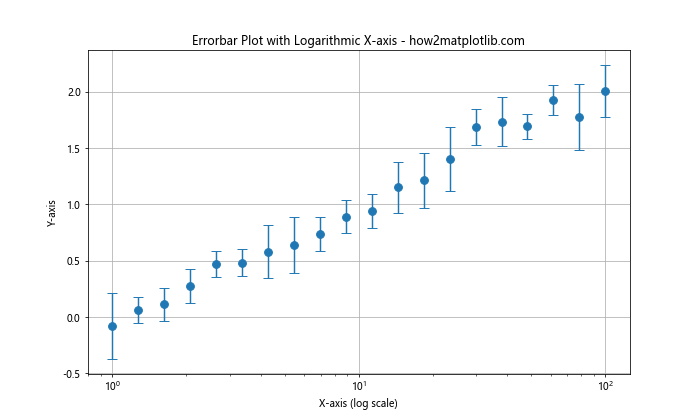
This example demonstrates how to use a larger marker size (8) in a logarithmic plot to ensure data points remain visible across different scales.
Matplotlib Errorbar Marker Size with Custom Caps
You can further customize your errorbar plots by adjusting the cap size and width:
import matplotlib.pyplot as plt
import numpy as np

x = np.linspace(0, 10, 10)
y = np.sin(x) + 0.1 * np.random.randn(len(x))
yerr = 0.2 + 0.2 * np.random.rand(len(x))

plt.figure(figsize=(10, 6))
plt.errorbar(x, y, yerr=yerr, fmt='o', markersize=10, capsize=10, capthick=2, elinewidth=2)
plt.title('Errorbar Plot with Custom Caps - how2matplotlib.com')
plt.xlabel('X-axis')
plt.ylabel('Y-axis')
plt.show()
Output:
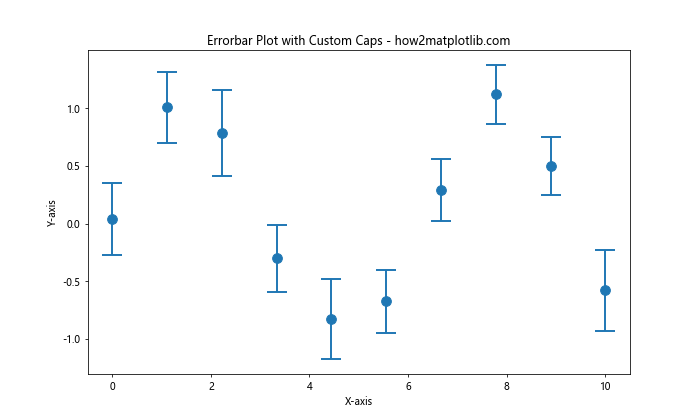
In this example, we set a larger marker size (10), increase the capsize (10), and adjust the cap thickness (2) and error line width (2) for a more pronounced appearance.
Matplotlib Errorbar Marker Size in 3D Plots
You can also apply marker size adjustments to 3D errorbar plots:
import matplotlib.pyplot as plt
import numpy as np
from mpl_toolkits.mplot3d import Axes3D

fig = plt.figure(figsize=(10, 8))
ax = fig.add_subplot(111, projection='3d')

x = np.linspace(0, 10, 10)
y = np.sin(x)
z = np.cos(x)
zerr = 0.1 + 0.1 * np.random.rand(len(x))

ax.errorbar(x, y, z, zerr=zerr, fmt='o', markersize=8, capsize=5)
ax.set_title('3D Errorbar Plot - how2matplotlib.com')
ax.set_xlabel('X-axis')
ax.set_ylabel('Y-axis')
ax.set_zlabel('Z-axis')
plt.show()
Output:
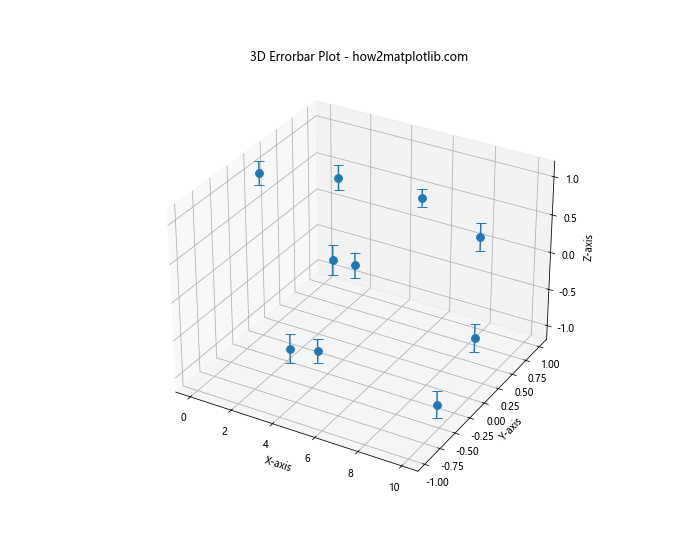
This example shows how to create a 3D errorbar plot with custom marker size, demonstrating that these techniques can be applied to more complex visualizations.
Matplotlib Errorbar Marker Size with Asymmetric Errors
You can use different marker sizes for asymmetric error bars:
import matplotlib.pyplot as plt
import numpy as np

x = np.linspace(0, 10, 10)
y = np.exp(-x/5)
yerr_lower = 0.1 + 0.1 * np.random.rand(len(x))
yerr_upper = 0.2 + 0.2 * np.random.rand(len(x))

plt.figure(figsize=(10, 6))
plt.errorbar(x, y, yerr=[yerr_lower, yerr_upper], fmt='o', markersize=8, capsize=5)
plt.title('Errorbar Plot with Asymmetric Errors - how2matplotlib.com')
plt.xlabel('X-axis')
plt.ylabel('Y-axis')
plt.show()
Output:
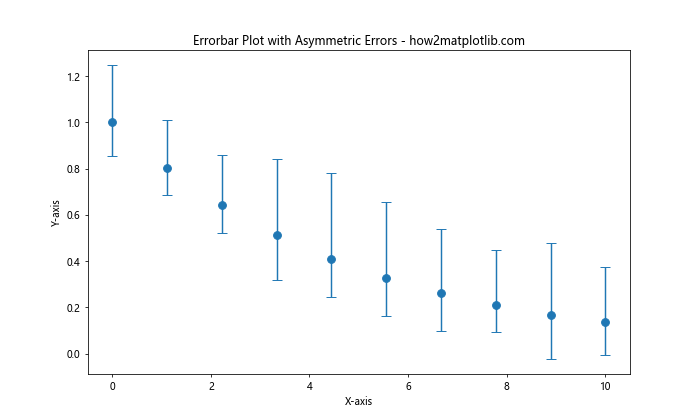
This example demonstrates how to create an errorbar plot with asymmetric error bars while maintaining a consistent marker size.
Matplotlib Errorbar Marker Size in Subplots
When working with subplots, you can adjust marker sizes individually:
import matplotlib.pyplot as plt
import numpy as np

x = np.linspace(0, 10, 10)
y1 = np.sin(x)
y2 = np.cos(x)
yerr = 0.1 + 0.1 * np.random.rand(len(x))

fig, (ax1, ax2) = plt.subplots(1, 2, figsize=(15, 6))

ax1.errorbar(x, y1, yerr=yerr, fmt='o', markersize=6, capsize=5)
ax1.set_title('Subplot 1: Smaller Markers - how2matplotlib.com')
ax1.set_xlabel('X-axis')
ax1.set_ylabel('Y-axis')

ax2.errorbar(x, y2, yerr=yerr, fmt='o', markersize=10, capsize=5)
ax2.set_title('Subplot 2: Larger Markers - how2matplotlib.com')
ax2.set_xlabel('X-axis')
ax2.set_ylabel('Y-axis')

plt.tight_layout()
plt.show()
Output:
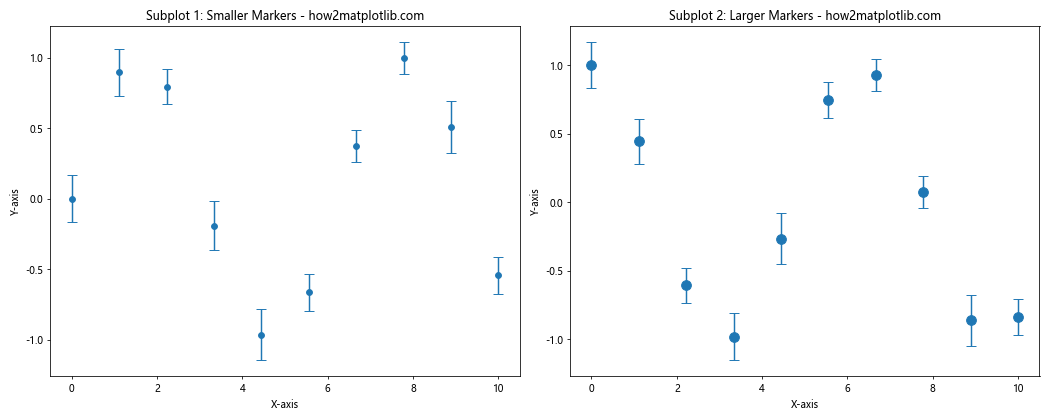
This example shows how to create two subplots with different marker sizes, allowing for comparison between visualizations.
Matplotlib errorbar marker size Conclusion
Mastering Matplotlib errorbar marker size is crucial for creating clear and informative data visualizations. By adjusting marker sizes, styles, and colors, you can emphasize important data points, distinguish between datasets, and improve the overall readability of your plots. The examples provided in this article demonstrate various techniques for customizing errorbar plots, from basic adjustments to more advanced applications in 3D plots and subplots.
Remember that the optimal marker size depends on your specific data and the message you want to convey. Experiment with different sizes and combinations to find the most effective representation for your data. By leveraging these techniques, you can create professional-looking visualizations that effectively communicate your findings to your audience.
As you continue to work with Matplotlib, keep exploring new ways to customize your plots and refine your data visualization skills. The flexibility and power of Matplotlib make it an invaluable tool for data scientists, researchers, and analysts across various fields.