How to Create Matplotlib Errorbar Plots No Lines: A Comprehensive Guide
Matplotlib errorbar no line is a powerful technique for visualizing data uncertainty without connecting data points. This article will explore various aspects of creating errorbar plots without lines using Matplotlib, providing detailed explanations and numerous examples to help you master this visualization method.
Understanding Matplotlib Errorbar No Line Plots
Matplotlib errorbar no line plots are a variation of standard errorbar plots where the data points are not connected by lines. This approach is particularly useful when you want to emphasize individual data points and their associated uncertainties without implying a continuous relationship between them.
Let’s start with a basic example of a matplotlib errorbar no line plot:
import matplotlib.pyplot as plt
import numpy as np

x = np.array([1, 2, 3, 4, 5])
y = np.array([2, 4, 6, 8, 10])
yerr = np.array([0.5, 0.8, 1.0, 1.2, 1.5])

plt.figure(figsize=(8, 6))
plt.errorbar(x, y, yerr=yerr, fmt='o', capsize=5, label='Data')
plt.xlabel('X-axis (how2matplotlib.com)')
plt.ylabel('Y-axis (how2matplotlib.com)')
plt.title('Matplotlib Errorbar No Line Plot')
plt.legend()
plt.grid(True)
plt.show()
Output:
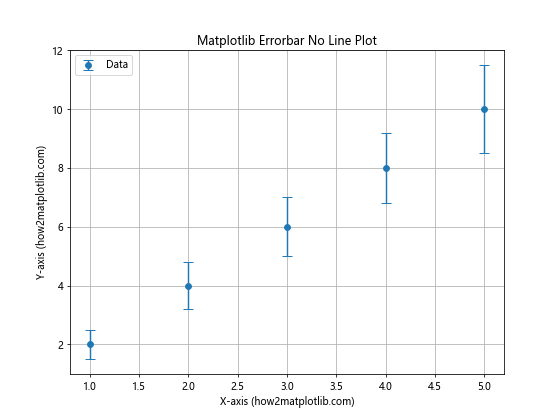
In this example, we create a matplotlib errorbar no line plot by setting the fmt parameter to ‘o’, which displays only markers without connecting lines. The capsize parameter controls the size of the error bar caps.
Customizing Marker Styles in Matplotlib Errorbar No Line Plots
When creating matplotlib errorbar no line plots, you can customize the marker styles to better represent your data. Here’s an example demonstrating different marker styles:
import matplotlib.pyplot as plt
import numpy as np

x = np.array([1, 2, 3, 4, 5])
y = np.array([2, 4, 6, 8, 10])
yerr = np.array([0.5, 0.8, 1.0, 1.2, 1.5])

plt.figure(figsize=(12, 8))
marker_styles = ['o', 's', '^', 'D', 'p']

for i, marker in enumerate(marker_styles):
    plt.errorbar(x + i*0.1, y, yerr=yerr, fmt=marker, capsize=5, label=f'Style {i+1}')

plt.xlabel('X-axis (how2matplotlib.com)')
plt.ylabel('Y-axis (how2matplotlib.com)')
plt.title('Matplotlib Errorbar No Line Plot with Different Marker Styles')
plt.legend()
plt.grid(True)
plt.show()
Output:
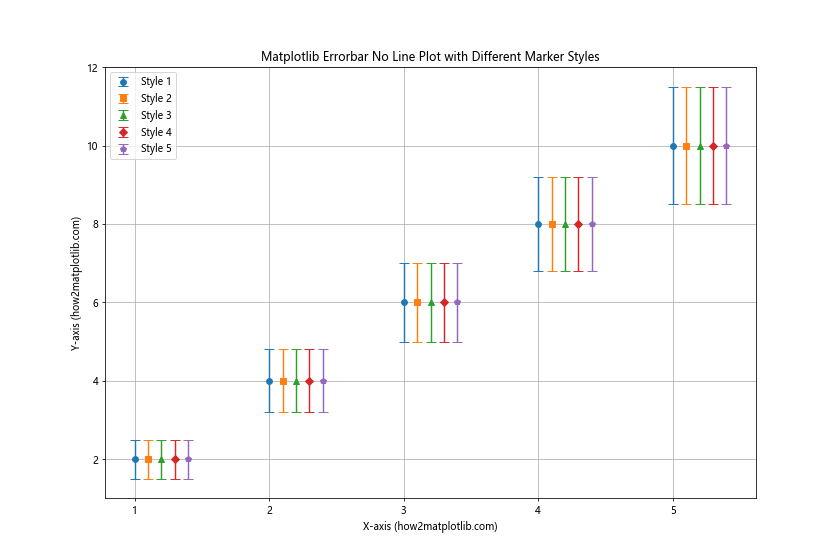
This example demonstrates how to use different marker styles in a matplotlib errorbar no line plot. We use a loop to create multiple errorbar plots with various marker styles, slightly offsetting each series along the x-axis for better visibility.
Adding Color to Matplotlib Errorbar No Line Plots
Color can be a powerful tool to enhance the visual appeal and information content of your matplotlib errorbar no line plots. Here’s an example showing how to add color to your plots:
import matplotlib.pyplot as plt
import numpy as np

x = np.array([1, 2, 3, 4, 5])
y1 = np.array([2, 4, 6, 8, 10])
y2 = np.array([1, 3, 5, 7, 9])
yerr1 = np.array([0.5, 0.8, 1.0, 1.2, 1.5])
yerr2 = np.array([0.3, 0.6, 0.9, 1.1, 1.3])

plt.figure(figsize=(10, 7))
plt.errorbar(x, y1, yerr=yerr1, fmt='o', capsize=5, color='blue', label='Data 1')
plt.errorbar(x, y2, yerr=yerr2, fmt='s', capsize=5, color='red', label='Data 2')

plt.xlabel('X-axis (how2matplotlib.com)')
plt.ylabel('Y-axis (how2matplotlib.com)')
plt.title('Colored Matplotlib Errorbar No Line Plot')
plt.legend()
plt.grid(True)
plt.show()
Output:
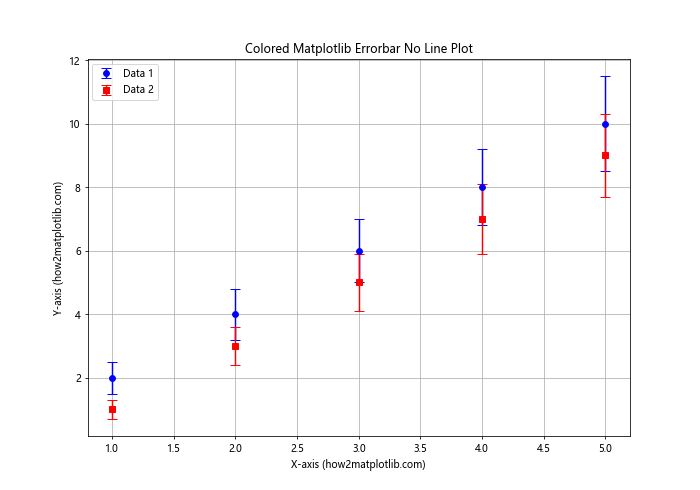
In this example, we create two matplotlib errorbar no line plots with different colors. The color parameter is used to set the color of both the markers and error bars.
Adjusting Error Bar Appearance in Matplotlib Errorbar No Line Plots
You can customize the appearance of error bars in matplotlib errorbar no line plots to better suit your visualization needs. Here’s an example demonstrating various error bar customizations:
import matplotlib.pyplot as plt
import numpy as np

x = np.array([1, 2, 3, 4, 5])
y = np.array([2, 4, 6, 8, 10])
yerr = np.array([0.5, 0.8, 1.0, 1.2, 1.5])

plt.figure(figsize=(10, 7))
plt.errorbar(x, y, yerr=yerr, fmt='o', capsize=10, capthick=2,
             ecolor='red', elinewidth=2, markeredgecolor='blue',
             markerfacecolor='lightblue', markersize=10,
             label='Custom Error Bars')

plt.xlabel('X-axis (how2matplotlib.com)')
plt.ylabel('Y-axis (how2matplotlib.com)')
plt.title('Matplotlib Errorbar No Line Plot with Custom Error Bars')
plt.legend()
plt.grid(True)
plt.show()
Output:
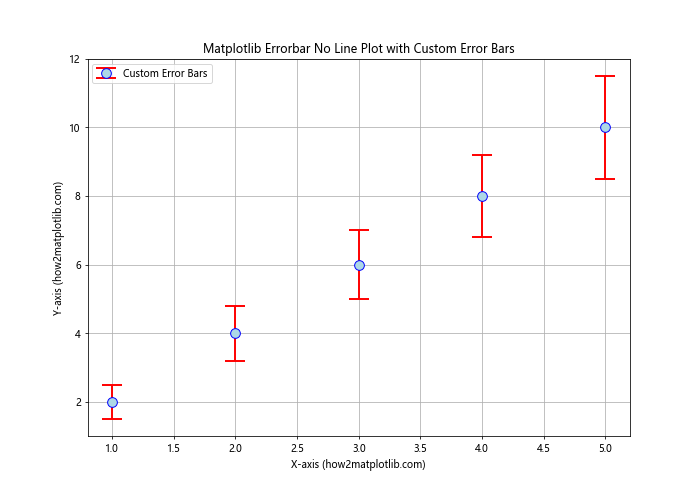
This example shows how to customize various aspects of error bars in a matplotlib errorbar no line plot:
capsize: Controls the length of the error bar capscapthick: Sets the thickness of the error bar capsecolor: Defines the color of the error barselinewidth: Adjusts the width of the error bar linesmarkeredgecolor: Sets the color of the marker edgemarkerfacecolor: Defines the fill color of the markermarkersize: Controls the size of the markers
Creating Matplotlib Errorbar No Line Plots with Asymmetric Error Bars
Sometimes, your data may have asymmetric uncertainties. Matplotlib errorbar no line plots can handle this situation. Here’s an example:
import matplotlib.pyplot as plt
import numpy as np

x = np.array([1, 2, 3, 4, 5])
y = np.array([2, 4, 6, 8, 10])
yerr_lower = np.array([0.3, 0.5, 0.7, 0.9, 1.1])
yerr_upper = np.array([0.5, 0.8, 1.1, 1.4, 1.7])

plt.figure(figsize=(10, 7))
plt.errorbar(x, y, yerr=[yerr_lower, yerr_upper], fmt='o', capsize=5,
             label='Asymmetric Errors')

plt.xlabel('X-axis (how2matplotlib.com)')
plt.ylabel('Y-axis (how2matplotlib.com)')
plt.title('Matplotlib Errorbar No Line Plot with Asymmetric Error Bars')
plt.legend()
plt.grid(True)
plt.show()
Output:
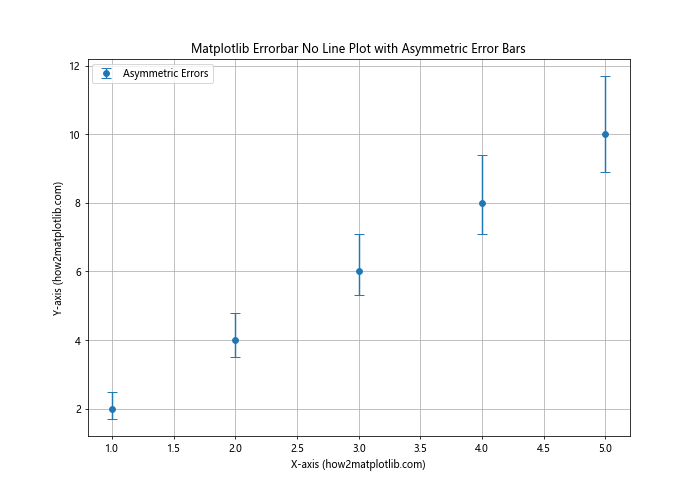
In this example, we create a matplotlib errorbar no line plot with asymmetric error bars. The yerr parameter takes a list of two arrays: the first for lower errors and the second for upper errors.
Adding Horizontal Error Bars to Matplotlib Errorbar No Line Plots
While vertical error bars are more common, you can also add horizontal error bars to your matplotlib errorbar no line plots. Here’s an example:
import matplotlib.pyplot as plt
import numpy as np

x = np.array([1, 2, 3, 4, 5])
y = np.array([2, 4, 6, 8, 10])
xerr = np.array([0.2, 0.3, 0.4, 0.5, 0.6])
yerr = np.array([0.5, 0.8, 1.0, 1.2, 1.5])

plt.figure(figsize=(10, 7))
plt.errorbar(x, y, xerr=xerr, yerr=yerr, fmt='o', capsize=5,
             label='Data with X and Y Errors')

plt.xlabel('X-axis (how2matplotlib.com)')
plt.ylabel('Y-axis (how2matplotlib.com)')
plt.title('Matplotlib Errorbar No Line Plot with X and Y Error Bars')
plt.legend()
plt.grid(True)
plt.show()
Output:
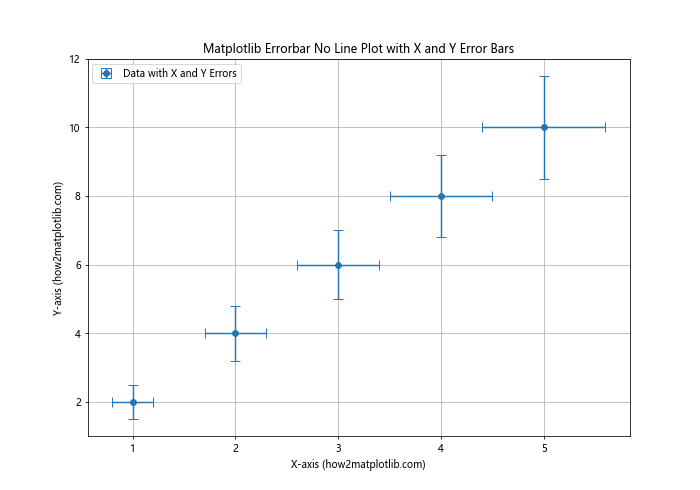
This example demonstrates how to add both horizontal and vertical error bars to a matplotlib errorbar no line plot. The xerr parameter is used to specify the horizontal error values.
Creating Matplotlib Errorbar No Line Plots with Logarithmic Scales
For data that spans multiple orders of magnitude, using logarithmic scales can be beneficial. Here’s how to create a matplotlib errorbar no line plot with logarithmic scales:
import matplotlib.pyplot as plt
import numpy as np

x = np.array([1, 10, 100, 1000, 10000])
y = np.array([2, 20, 200, 2000, 20000])
yerr = np.array([0.5, 5, 50, 500, 5000])

plt.figure(figsize=(10, 7))
plt.errorbar(x, y, yerr=yerr, fmt='o', capsize=5, label='Log Scale Data')

plt.xscale('log')
plt.yscale('log')
plt.xlabel('X-axis (log scale) (how2matplotlib.com)')
plt.ylabel('Y-axis (log scale) (how2matplotlib.com)')
plt.title('Matplotlib Errorbar No Line Plot with Logarithmic Scales')
plt.legend()
plt.grid(True)
plt.show()
Output:
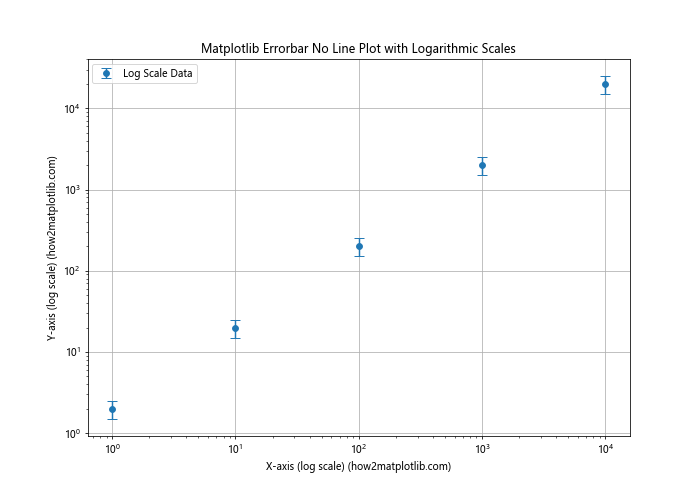
In this example, we use plt.xscale('log') and plt.yscale('log') to set both x and y axes to logarithmic scales. This is particularly useful for data that spans multiple orders of magnitude.
Combining Matplotlib Errorbar No Line Plots with Other Plot Types
You can combine matplotlib errorbar no line plots with other plot types to create more informative visualizations. Here’s an example that combines an errorbar plot with a line plot:
import matplotlib.pyplot as plt
import numpy as np

x = np.array([1, 2, 3, 4, 5])
y1 = np.array([2, 4, 6, 8, 10])
y2 = np.array([1.5, 3.5, 5.5, 7.5, 9.5])
yerr = np.array([0.5, 0.8, 1.0, 1.2, 1.5])

plt.figure(figsize=(10, 7))
plt.errorbar(x, y1, yerr=yerr, fmt='o', capsize=5, label='Data with Errors')
plt.plot(x, y2, 'r-', label='Trend Line')

plt.xlabel('X-axis (how2matplotlib.com)')
plt.ylabel('Y-axis (how2matplotlib.com)')
plt.title('Matplotlib Errorbar No Line Plot Combined with Line Plot')
plt.legend()
plt.grid(True)
plt.show()
Output:
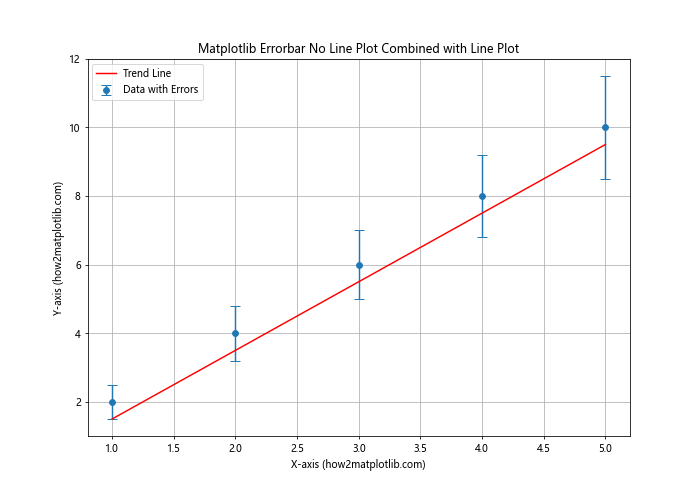
This example demonstrates how to combine a matplotlib errorbar no line plot with a regular line plot. The errorbar plot shows data points with uncertainties, while the line plot represents a trend or theoretical prediction.
Creating Matplotlib Errorbar No Line Plots with Multiple Datasets
When working with multiple datasets, you can create matplotlib errorbar no line plots to compare them visually. Here’s an example:
import matplotlib.pyplot as plt
import numpy as np

x = np.array([1, 2, 3, 4, 5])
y1 = np.array([2, 4, 6, 8, 10])
y2 = np.array([1.5, 3.5, 5.5, 7.5, 9.5])
yerr1 = np.array([0.5, 0.8, 1.0, 1.2, 1.5])
yerr2 = np.array([0.3, 0.6, 0.9, 1.1, 1.3])

plt.figure(figsize=(10, 7))
plt.errorbar(x, y1, yerr=yerr1, fmt='o', capsize=5, label='Dataset 1')
plt.errorbar(x + 0.1, y2, yerr=yerr2, fmt='s', capsize=5, label='Dataset 2')

plt.xlabel('X-axis (how2matplotlib.com)')
plt.ylabel('Y-axis (how2matplotlib.com)')
plt.title('Matplotlib Errorbar No Line Plot with Multiple Datasets')
plt.legend()
plt.grid(True)
plt.show()
Output:
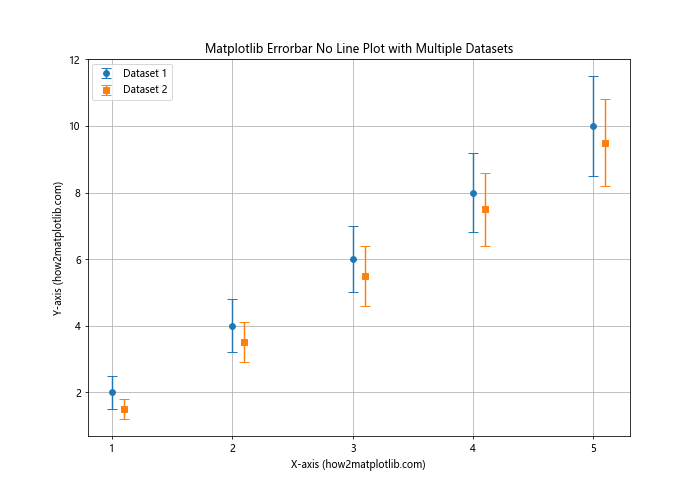
In this example, we create two matplotlib errorbar no line plots for different datasets. We slightly offset the x-values of the second dataset to prevent overlap of the error bars.
Creating Matplotlib Errorbar No Line Plots with Subplots
For complex data analysis, you might want to create multiple matplotlib errorbar no line plots in a single figure using subplots. Here’s an example:
import matplotlib.pyplot as plt
import numpy as np

x = np.array([1, 2, 3, 4, 5])
y1 = np.array([2, 4, 6, 8, 10])
y2 = np.array([1.5, 3.5, 5.5, 7.5, 9.5])
yerr1 = np.array([0.5, 0.8, 1.0, 1.2, 1.5])
yerr2 = np.array([0.3, 0.6, 0.9, 1.1, 1.3])

fig, (ax1, ax2) = plt.subplots(1, 2, figsize=(15, 6))

ax1.errorbar(x, y1, yerr=yerr1, fmt='o', capsize=5, label='Dataset 1')
ax1.set_xlabel('X-axis (how2matplotlib.com)')
ax1.set_ylabel('Y-axis (how2matplotlib.com)')
ax1.set_title('Subplot 1')
ax1.legend()
ax1.grid(True)

ax2.errorbar(x, y2, yerr=yerr2, fmt='s', capsize=5, label='Dataset 2')
ax2.set_xlabel('X-axis (how2matplotlib.com)')
ax2.set_ylabel('Y-axis (how2matplotlib.com)')
ax2.set_title('Subplot 2')
ax2.legend()
ax2.grid(True)

plt.tight_layout()
plt.show()
Output:
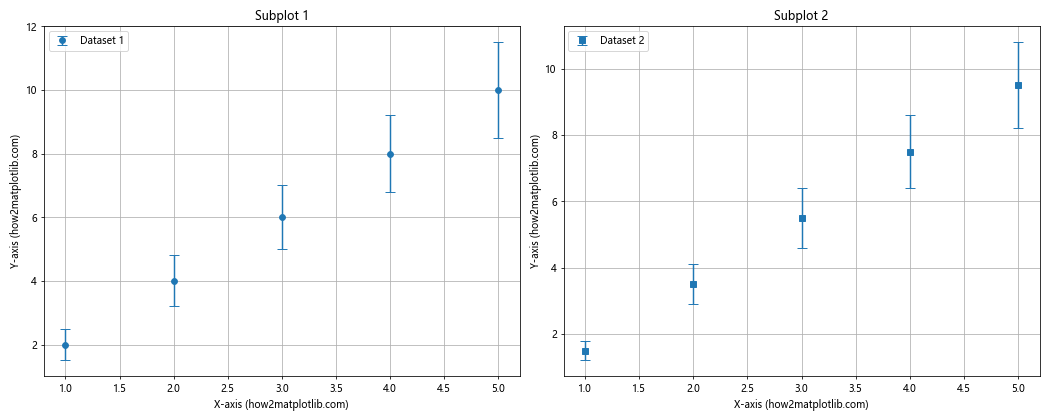
This example demonstrates how to create two matplotlib errorbar no line plots as subplots within a single figure. We use plt.subplots() to create a figure with two axes, and then create an errorbar plot on each axis.
Adding Error Bar Caps to Matplotlib Errorbar No Line Plots
Error bar caps can help to clearly define the extent of the error in your matplotlib errorbar no line plots. Here’s an example showing how to customize error bar caps:
import matplotlib.pyplot as plt
import numpy as np

x = np.array([1, 2, 3, 4, 5])
y = np.array([2, 4, 6, 8, 10])
yerr = np.array([0.5, 0.8, 1.0, 1.2, 1.5])

plt.figure(figsize=(10, 7))
plt.errorbar(x, y, yerr=yerr, fmt='o', capsize=10, capthick=2,
             ecolor='red', markeredgecolor='blue', markerfacecolor='lightblue',
             markersize=10, label='Data with Custom Caps')

plt.xlabel('X-axis (how2matplotlib.com)')
plt.ylabel('Y-axis (how2matplotlib.com)')
plt.title('Matplotlib Errorbar No Line Plot with Custom Error Bar Caps')
plt.legend()
plt.grid(True)
plt.show()
Output:
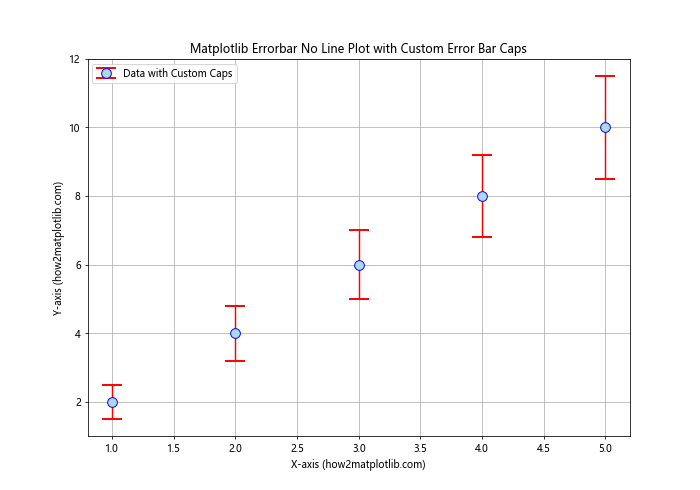
In this example, we use the capsize parameter to set the length of the error bar caps, and capthick to set their thickness. The ecolor parameter sets the color of the error bars and caps.
Creating Matplotlib Errorbar No Line Plots with Confidence Intervals
Matplotlib errorbar no line plots can be used to visualize confidence intervals. Here’s an example:
import matplotlib.pyplot as plt
import numpy as np

x = np.array([1, 2, 3, 4, 5])
y = np.array([2, 4, 6, 8, 10])
confidence_interval = np.array([0.5, 0.8, 1.0, 1.2, 1.5])

plt.figure(figsize=(10, 7))
plt.errorbar(x, y, yerr=confidence_interval, fmt='o', capsize=5,
             label='Data with 95% Confidence Interval')

plt.xlabel('X-axis (how2matplotlib.com)')
plt.ylabel('Y-axis (how2matplotlib.com)')
plt.title('Matplotlib Errorbar No Line Plot with Confidence Intervals')
plt.legend()
plt.grid(True)
plt.show()
Output:
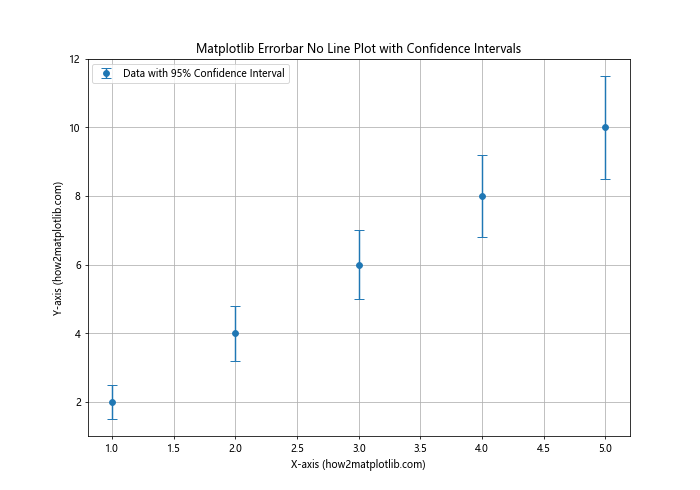
This example shows how to create a matplotlib errorbar no line plot where the error bars represent confidence intervals. The interpretation of these error bars would depend on how the confidence intervals were calculated.
Creating Matplotlib Errorbar No Line Plots with Categorical Data
Matplotlib errorbar no line plots can also be used with categorical data. Here’s an example:
import matplotlib.pyplot as plt
import numpy as np

categories = ['A', 'B', 'C', 'D', 'E']
y = np.array([2, 4, 6, 8, 10])
yerr = np.array([0.5, 0.8, 1.0, 1.2, 1.5])

plt.figure(figsize=(10, 7))
plt.errorbar(categories, y, yerr=yerr, fmt='o', capsize=5,
             label='Categorical Data')

plt.xlabel('Categories (how2matplotlib.com)')
plt.ylabel('Values (how2matplotlib.com)')
plt.title('Matplotlib Errorbar No Line Plot with Categorical Data')
plt.legend()
plt.grid(True)
plt.show()
Output:
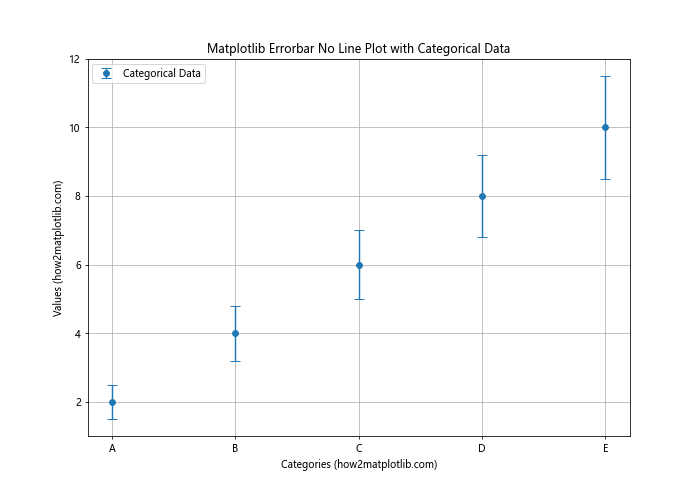
This example demonstrates how to create a matplotlib errorbar no line plot with categorical data on the x-axis. The categories are treated as strings and automatically spaced evenly along the x-axis.
Adding a Color Gradient to Matplotlib Errorbar No Line Plots
You can add a color gradient to your matplotlib errorbar no line plots to represent an additional dimension of data. Here’s an example:
import matplotlib.pyplot as plt
import numpy as np

x = np.array([1, 2, 3, 4, 5])
y = np.array([2, 4, 6, 8, 10])
yerr = np.array([0.5, 0.8, 1.0, 1.2, 1.5])
z = np.array([10, 20, 30, 40, 50])  # Additional data dimension

plt.figure(figsize=(10, 7))
scatter = plt.scatter(x, y, c=z, cmap='viridis', s=100)
plt.colorbar(scatter, label='Z-value (how2matplotlib.com)')
plt.errorbar(x, y, yerr=yerr, fmt='none', capsize=5, ecolor='gray')

plt.xlabel('X-axis (how2matplotlib.com)')
plt.ylabel('Y-axis (how2matplotlib.com)')
plt.title('Matplotlib Errorbar No Line Plot with Color Gradient')
plt.grid(True)
plt.show()
Output:
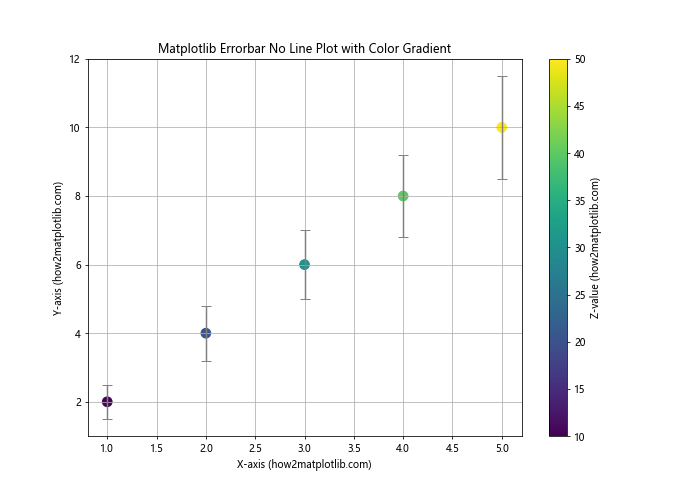
In this example, we use plt.scatter() to create color-coded markers, where the color represents an additional dimension of data (z). We then add error bars using plt.errorbar() with fmt='none' to show only the error bars without additional markers.
Creating Matplotlib Errorbar No Line Plots with Annotations
Adding annotations to your matplotlib errorbar no line plots can provide additional context or highlight specific data points. Here’s an example:
import matplotlib.pyplot as plt
import numpy as np

x = np.array([1, 2, 3, 4, 5])
y = np.array([2, 4, 6, 8, 10])
yerr = np.array([0.5, 0.8, 1.0, 1.2, 1.5])

plt.figure(figsize=(10, 7))
plt.errorbar(x, y, yerr=yerr, fmt='o', capsize=5, label='Data')

for i, (xi, yi) in enumerate(zip(x, y)):
    plt.annotate(f'Point {i+1}', (xi, yi), xytext=(5, 5),
                 textcoords='offset points')

plt.xlabel('X-axis (how2matplotlib.com)')
plt.ylabel('Y-axis (how2matplotlib.com)')
plt.title('Matplotlib Errorbar No Line Plot with Annotations')
plt.legend()
plt.grid(True)
plt.show()
Output:
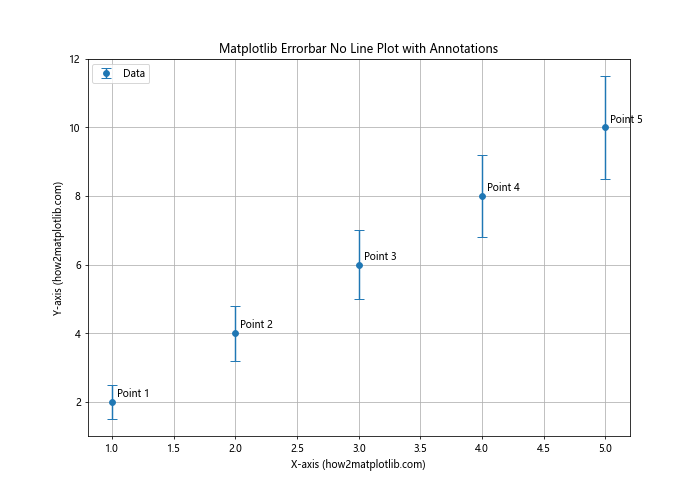
This example shows how to add annotations to each data point in a matplotlib errorbar no line plot. We use a loop to add an annotation for each point, slightly offset from the point itself.
Matplotlib errorbar no line Conclusion
Matplotlib errorbar no line plots are a versatile tool for visualizing data with uncertainties. Throughout this article, we’ve explored various aspects of creating and customizing these plots, from basic usage to advanced techniques. We’ve covered topics such as customizing marker styles, adding color, adjusting error bar appearance, handling asymmetric errors, using logarithmic scales, combining with other plot types, working with multiple datasets, applying styles, creating subplots, customizing error bar caps, visualizing confidence intervals, adjusting marker sizes, working with categorical data, adding color gradients, and including annotations.
By mastering these techniques, you can create informative and visually appealing matplotlib errorbar no line plots that effectively communicate your data and its associated uncertainties. Remember to experiment with different options and combinations to find the best representation for your specific data and audience.
As you continue to work with matplotlib errorbar no line plots, keep in mind the importance of clear labeling, appropriate scaling, and thoughtful color choices. These elements can significantly enhance the readability and impact of your visualizations.
Whether you’re working in scientific research, data analysis, or any field that deals with data uncertainty, matplotlib errorbar no line plots are an invaluable tool in your data visualization toolkit. With the knowledge gained from this article, you’re well-equipped to create professional-quality plots that effectively communicate your data and insights.