How to Master Matplotlib Linestyle
Matplotlib linestyle is a crucial aspect of data visualization in Python. This article will delve deep into the world of Matplotlib linestyle, exploring its various features, customization options, and best practices. Whether you’re a beginner or an experienced data scientist, this guide will help you harness the full power of Matplotlib linestyle to create stunning and informative visualizations.
Matplotlib Linestyle Recommended Articles
- matplotlib linestyle arrow
- matplotlib linestyle bigger dots
- matplotlib linestyle contour
- matplotlib linestyle dashed
- matplotlib linestyle dotted
- matplotlib linestyle marker
- matplotlib linestyle none
- matplotlib linestyle thick
- matplotlib linestyles
- matplotlib reset linestyle
Understanding Matplotlib Linestyle Basics
Matplotlib linestyle refers to the appearance of lines in plots created using the Matplotlib library. It encompasses various attributes such as line type, color, width, and markers. By mastering Matplotlib linestyle, you can effectively communicate your data and make your visualizations more appealing and informative.
Let’s start with a simple example to illustrate the basic usage of Matplotlib linestyle:
import matplotlib.pyplot as plt
import numpy as np

x = np.linspace(0, 10, 100)
y = np.sin(x)

plt.plot(x, y, linestyle='-', label='how2matplotlib.com')
plt.title('Basic Matplotlib Linestyle Example')
plt.xlabel('X-axis')
plt.ylabel('Y-axis')
plt.legend()
plt.show()
Output:
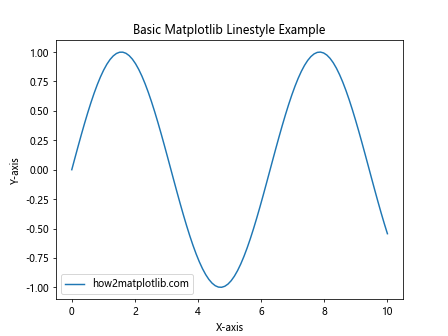
In this example, we use the default solid linestyle (‘-‘) to plot a sine wave. The linestyle parameter in the plot() function allows us to specify the desired line style.
Exploring Different Matplotlib Linestyle Options
Matplotlib offers a wide range of linestyle options to suit various visualization needs. Let’s explore some of the most commonly used linestyle options:
- Solid line (‘-‘)
- Dashed line (‘–‘)
- Dotted line (‘:’)
- Dash-dot line (‘-.’)
Here’s an example showcasing these different Matplotlib linestyle options:
import matplotlib.pyplot as plt
import numpy as np

x = np.linspace(0, 10, 100)
y1 = np.sin(x)
y2 = np.cos(x)
y3 = np.tan(x)
y4 = np.exp(-x/10)

plt.plot(x, y1, linestyle='-', label='Solid (how2matplotlib.com)')
plt.plot(x, y2, linestyle='--', label='Dashed')
plt.plot(x, y3, linestyle=':', label='Dotted')
plt.plot(x, y4, linestyle='-.', label='Dash-dot')

plt.title('Different Matplotlib Linestyle Options')
plt.xlabel('X-axis')
plt.ylabel('Y-axis')
plt.legend()
plt.show()
Output:
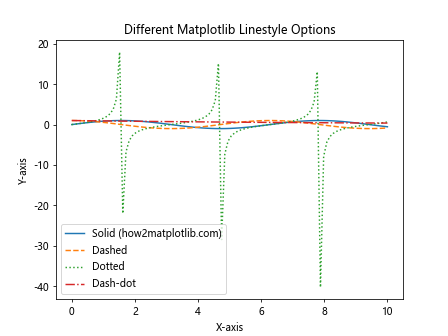
This example demonstrates how different linestyles can be used to distinguish between multiple lines in a single plot.
Customizing Matplotlib Linestyle Colors
Color is an essential aspect of Matplotlib linestyle customization. Matplotlib provides various ways to specify colors, including color names, hex codes, and RGB values.
Let’s explore color customization with Matplotlib linestyle:
import matplotlib.pyplot as plt
import numpy as np

x = np.linspace(0, 10, 100)
y = np.sin(x)

plt.plot(x, y, linestyle='-', color='red', label='Red (how2matplotlib.com)')
plt.plot(x, y + 1, linestyle='--', color='#00FF00', label='Green (hex)')
plt.plot(x, y - 1, linestyle=':', color=(0, 0, 1), label='Blue (RGB)')

plt.title('Matplotlib Linestyle Color Customization')
plt.xlabel('X-axis')
plt.ylabel('Y-axis')
plt.legend()
plt.show()
Output:
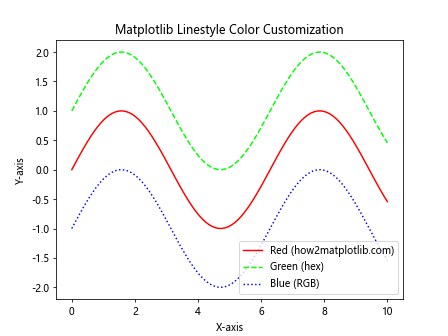
In this example, we use different methods to specify colors for each line: color name (‘red’), hex code (‘#00FF00’), and RGB tuple ((0, 0, 1)).
Adjusting Matplotlib Linestyle Width
Line width is another important aspect of Matplotlib linestyle that can greatly impact the visual appeal of your plots. You can easily adjust the line width using the linewidth or lw parameter.
Here’s an example demonstrating different line widths:
import matplotlib.pyplot as plt
import numpy as np

x = np.linspace(0, 10, 100)
y = np.sin(x)

plt.plot(x, y, linestyle='-', linewidth=1, label='1px (how2matplotlib.com)')
plt.plot(x, y + 0.5, linestyle='--', linewidth=2, label='2px')
plt.plot(x, y - 0.5, linestyle=':', linewidth=4, label='4px')

plt.title('Matplotlib Linestyle Width Customization')
plt.xlabel('X-axis')
plt.ylabel('Y-axis')
plt.legend()
plt.show()
Output:
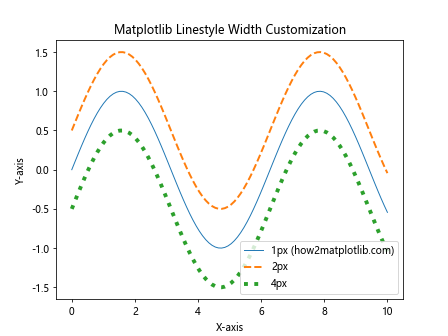
This example shows how different line widths can be used to emphasize certain lines or create a visual hierarchy in your plots.
Adding Markers to Matplotlib Linestyle
Markers are visual elements that can be added to data points along a line to highlight specific values or make the data more readable. Matplotlib offers a wide variety of marker styles that can be combined with different linestyles.
Let’s explore some marker options with Matplotlib linestyle:
import matplotlib.pyplot as plt
import numpy as np

x = np.linspace(0, 10, 20)
y = np.sin(x)

plt.plot(x, y, linestyle='-', marker='o', label='Circle (how2matplotlib.com)')
plt.plot(x, y + 0.5, linestyle='--', marker='s', label='Square')
plt.plot(x, y - 0.5, linestyle=':', marker='^', label='Triangle')

plt.title('Matplotlib Linestyle with Markers')
plt.xlabel('X-axis')
plt.ylabel('Y-axis')
plt.legend()
plt.show()
Output:
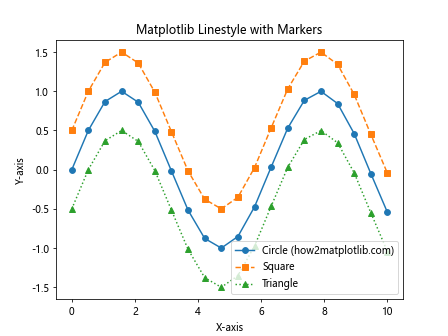
This example demonstrates how different marker styles can be combined with various linestyles to create more informative plots.
Creating Custom Matplotlib Linestyle Patterns
While Matplotlib provides several built-in linestyle options, you can also create custom linestyle patterns using a sequence of on/off ink specifications.
Here’s an example of creating custom Matplotlib linestyle patterns:
import matplotlib.pyplot as plt
import numpy as np

x = np.linspace(0, 10, 100)
y = np.sin(x)

plt.plot(x, y, linestyle=(0, (5, 5)), label='Custom 1 (how2matplotlib.com)')
plt.plot(x, y + 0.5, linestyle=(0, (5, 1)), label='Custom 2')
plt.plot(x, y - 0.5, linestyle=(0, (1, 1, 3, 1)), label='Custom 3')

plt.title('Custom Matplotlib Linestyle Patterns')
plt.xlabel('X-axis')
plt.ylabel('Y-axis')
plt.legend()
plt.show()
Output:
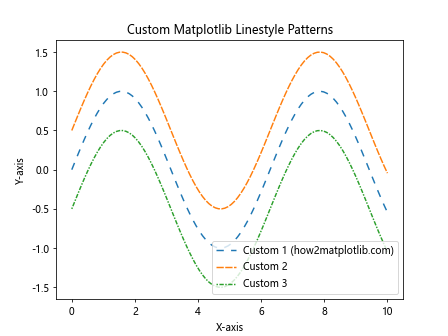
In this example, we create three custom linestyle patterns using tuples that specify the on/off ink sequence.
Combining Multiple Matplotlib Linestyle Properties
To create truly unique and informative visualizations, you can combine various Matplotlib linestyle properties such as color, width, markers, and custom patterns.
Let’s see an example that combines multiple Matplotlib linestyle properties:
import matplotlib.pyplot as plt
import numpy as np

x = np.linspace(0, 10, 50)
y = np.sin(x)

plt.plot(x, y, linestyle='--', color='red', linewidth=2, marker='o', markersize=8, label='Combined 1 (how2matplotlib.com)')
plt.plot(x, y + 0.5, linestyle=(0, (5, 2)), color='blue', linewidth=1.5, marker='s', markersize=6, label='Combined 2')

plt.title('Combined Matplotlib Linestyle Properties')
plt.xlabel('X-axis')
plt.ylabel('Y-axis')
plt.legend()
plt.show()
Output:
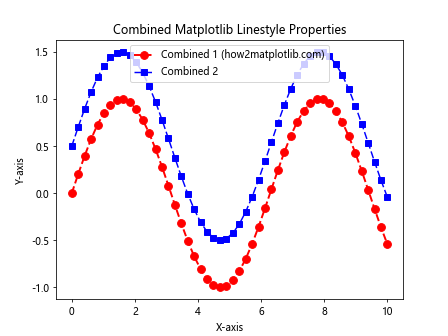
This example demonstrates how combining different linestyle properties can create visually appealing and informative plots.
Using Matplotlib Linestyle in Subplots
Matplotlib allows you to create multiple subplots within a single figure, each with its own linestyle customizations. This is particularly useful when comparing different datasets or visualizing related information side by side.
Here’s an example of using Matplotlib linestyle in subplots:
import matplotlib.pyplot as plt
import numpy as np

x = np.linspace(0, 10, 100)
y1 = np.sin(x)
y2 = np.cos(x)

fig, (ax1, ax2) = plt.subplots(1, 2, figsize=(12, 5))

ax1.plot(x, y1, linestyle='-', color='red', label='Sin (how2matplotlib.com)')
ax1.set_title('Sine Wave')
ax1.set_xlabel('X-axis')
ax1.set_ylabel('Y-axis')
ax1.legend()

ax2.plot(x, y2, linestyle='--', color='blue', label='Cos (how2matplotlib.com)')
ax2.set_title('Cosine Wave')
ax2.set_xlabel('X-axis')
ax2.set_ylabel('Y-axis')
ax2.legend()

plt.tight_layout()
plt.show()
Output:
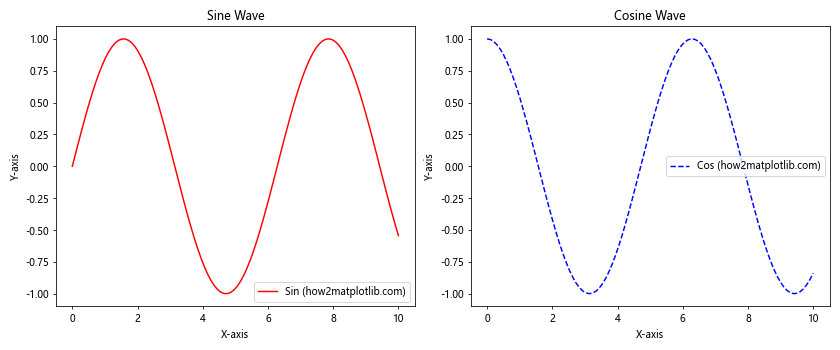
This example creates two subplots, each with its own Matplotlib linestyle customizations, allowing for easy comparison between the sine and cosine waves.
Applying Matplotlib Linestyle to Different Plot Types
Matplotlib linestyle can be applied to various plot types beyond simple line plots. Let’s explore how to use Matplotlib linestyle with different plot types:
Scatter Plots
import matplotlib.pyplot as plt
import numpy as np

x = np.random.rand(50)
y = np.random.rand(50)

plt.scatter(x, y, c='red', marker='o', s=50, label='Data points (how2matplotlib.com)')
plt.plot(x, y, linestyle='--', color='blue', alpha=0.5, label='Connecting line')

plt.title('Scatter Plot with Matplotlib Linestyle')
plt.xlabel('X-axis')
plt.ylabel('Y-axis')
plt.legend()
plt.show()
Output:
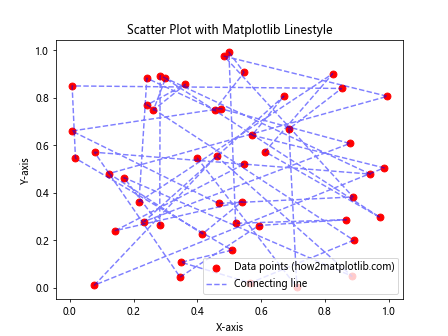
This example demonstrates how to combine a scatter plot with a connecting line using Matplotlib linestyle.
Bar Plots
import matplotlib.pyplot as plt
import numpy as np

categories = ['A', 'B', 'C', 'D', 'E']
values = np.random.randint(1, 10, 5)

plt.bar(categories, values, color='skyblue', edgecolor='black', linewidth=2, linestyle='--')
plt.title('Bar Plot with Matplotlib Linestyle')
plt.xlabel('Categories')
plt.ylabel('Values')
plt.text(0, 9, 'how2matplotlib.com', fontsize=12)
plt.show()
Output:
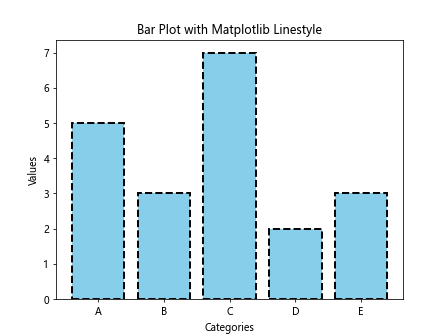
In this example, we use Matplotlib linestyle to customize the edge of the bars in a bar plot.
Pie Charts
import matplotlib.pyplot as plt

sizes = [30, 25, 20, 15, 10]
labels = ['A', 'B', 'C', 'D', 'E']
colors = ['red', 'green', 'blue', 'yellow', 'orange']

plt.pie(sizes, labels=labels, colors=colors, autopct='%1.1f%%', wedgeprops={'linewidth': 3, 'edgecolor': 'white'})
plt.title('Pie Chart with Matplotlib Linestyle')
plt.text(-1.3, 1.3, 'how2matplotlib.com', fontsize=12)
plt.axis('equal')
plt.show()
Output:

This example shows how to use Matplotlib linestyle to add edge lines to pie chart wedges.
Animating Matplotlib Linestyle
Matplotlib can be used to create animated plots with changing linestyles. This can be particularly useful for visualizing time-series data or demonstrating the evolution of a system over time.
Here’s an example of animating Matplotlib linestyle:
import matplotlib.pyplot as plt
import matplotlib.animation as animation
import numpy as np

fig, ax = plt.subplots()
x = np.linspace(0, 2*np.pi, 100)
line, = ax.plot(x, np.sin(x), linestyle='-')

def animate(i):
    line.set_ydata(np.sin(x + i/10))
    line.set_linestyle(['--', ':', '-.', '-'][i % 4])
    return line,

ani = animation.FuncAnimation(fig, animate, frames=200, interval=50, blit=True)
plt.title('Animated Matplotlib Linestyle')
plt.text(0, 1.1, 'how2matplotlib.com', fontsize=12)
plt.show()
Output:
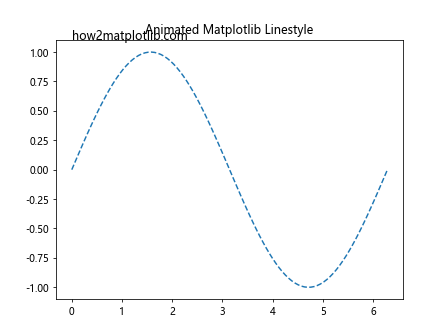
This example creates an animation where both the sine wave and the linestyle change over time.
Best Practices for Using Matplotlib Linestyle
When working with Matplotlib linestyle, it’s important to follow some best practices to ensure your visualizations are effective and easy to understand:
- Use consistent linestyles: When creating multiple plots or comparing different datasets, use consistent linestyles to represent similar types of data.
Choose appropriate colors: Select colors that are easily distinguishable and consider color-blind friendly palettes.
Avoid clutter: Don’t use too many different linestyles in a single plot, as it can become confusing and hard to read.
Use line width effectively: Adjust line width to emphasize important data or create a visual hierarchy.
Combine linestyles with markers: Use markers in conjunction with linestyles to highlight specific data points or intervals.
Label your plots: Always include clear labels, titles, and legends to explain what each linestyle represents.
Consider the context: Choose linestyles that are appropriate for the type of data you’re visualizing and the message you want to convey.
Here’s an example that demonstrates some of these best practices: