How to Master Matplotlib Linestyle and Thick Lines: A Comprehensive Guide
Matplotlib linestyle and thick lines are essential elements in creating visually appealing and informative plots. This comprehensive guide will explore various aspects of using linestyles and adjusting line thickness in Matplotlib, providing you with the knowledge and skills to enhance your data visualization projects. We’ll cover everything from basic concepts to advanced techniques, accompanied by easy-to-understand code examples.
Understanding Matplotlib Linestyle Basics
Matplotlib linestyle options allow you to customize the appearance of lines in your plots. The linestyle parameter can be used to change the style of lines, while the linewidth parameter controls the thickness of lines. Let’s start with a simple example to demonstrate how to use these parameters:
import matplotlib.pyplot as plt
import numpy as np

x = np.linspace(0, 10, 100)
y = np.sin(x)

plt.figure(figsize=(8, 6))
plt.plot(x, y, linestyle='--', linewidth=2, label='how2matplotlib.com')
plt.title('Matplotlib Linestyle and Thick Line Example')
plt.xlabel('X-axis')
plt.ylabel('Y-axis')
plt.legend()
plt.show()
Output:
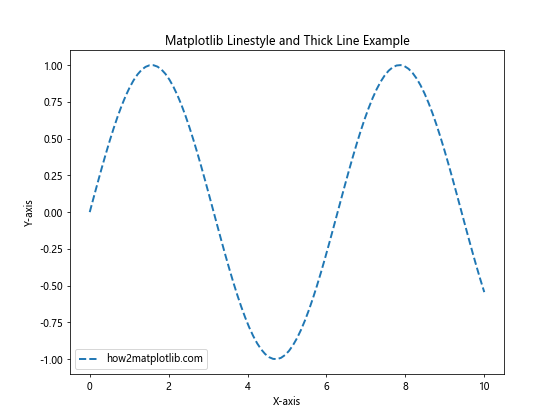
In this example, we’ve used a dashed linestyle (‘–‘) and set the linewidth to 2, creating a thicker line than the default. The label ‘how2matplotlib.com’ is added to demonstrate how to include text in the plot.
Exploring Matplotlib Linestyle Options
Matplotlib offers a variety of linestyle options to choose from. Here’s a list of commonly used linestyles:
- Solid line: ‘-‘
- Dashed line: ‘–‘
- Dotted line: ‘:’
- Dash-dot line: ‘-.’
Let’s create a plot that showcases these different linestyles:
import matplotlib.pyplot as plt
import numpy as np

x = np.linspace(0, 10, 100)
y1 = np.sin(x)
y2 = np.cos(x)
y3 = np.tan(x)
y4 = np.exp(-x/10)

plt.figure(figsize=(10, 8))
plt.plot(x, y1, linestyle='-', linewidth=2, label='Solid (how2matplotlib.com)')
plt.plot(x, y2, linestyle='--', linewidth=2, label='Dashed (how2matplotlib.com)')
plt.plot(x, y3, linestyle=':', linewidth=2, label='Dotted (how2matplotlib.com)')
plt.plot(x, y4, linestyle='-.', linewidth=2, label='Dash-dot (how2matplotlib.com)')

plt.title('Matplotlib Linestyle Options')
plt.xlabel('X-axis')
plt.ylabel('Y-axis')
plt.legend()
plt.grid(True)
plt.show()
Output:
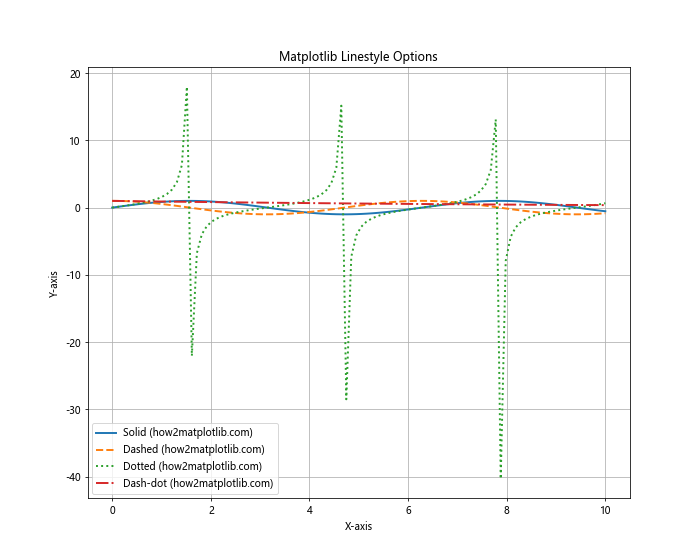
This example demonstrates the four basic linestyles available in Matplotlib. Each line is plotted with a different style and labeled accordingly.
Customizing Matplotlib Linestyle with Thick Lines
Combining different linestyles with varying line thicknesses can create visually striking plots. Let’s explore how to use thick lines with different styles:
import matplotlib.pyplot as plt
import numpy as np

x = np.linspace(0, 5, 100)
y1 = x
y2 = x**2
y3 = x**3

plt.figure(figsize=(10, 8))
plt.plot(x, y1, linestyle='-', linewidth=4, label='Thick Solid (how2matplotlib.com)')
plt.plot(x, y2, linestyle='--', linewidth=3, label='Thick Dashed (how2matplotlib.com)')
plt.plot(x, y3, linestyle=':', linewidth=5, label='Extra Thick Dotted (how2matplotlib.com)')

plt.title('Matplotlib Linestyle with Thick Lines')
plt.xlabel('X-axis')
plt.ylabel('Y-axis')
plt.legend()
plt.grid(True)
plt.show()
Output:
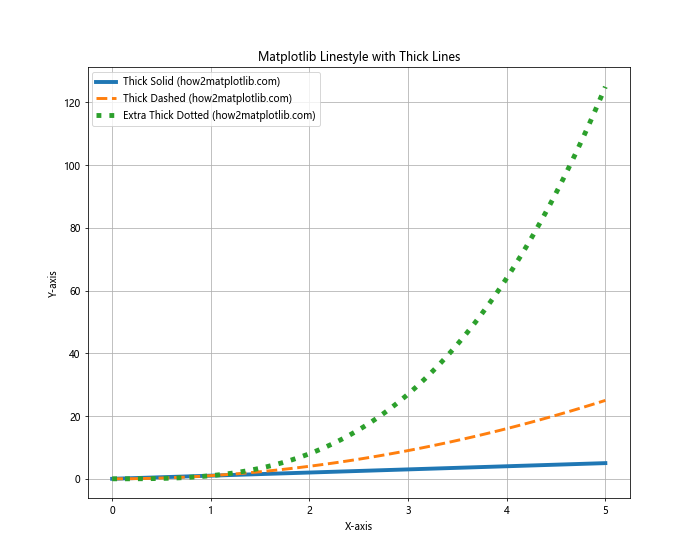
In this example, we’ve used different linewidth values to create varying degrees of thickness for each line. The solid line has a linewidth of 4, the dashed line has a linewidth of 3, and the dotted line has an extra thick linewidth of 5.
Using Matplotlib Linestyle with Custom Patterns
Matplotlib also allows you to create custom linestyles using a sequence of on/off ink specifications. This feature gives you even more control over the appearance of your lines. Here’s an example:
import matplotlib.pyplot as plt
import numpy as np

x = np.linspace(0, 10, 100)
y = np.sin(x)

plt.figure(figsize=(10, 6))
plt.plot(x, y, linestyle=(0, (5, 2, 1, 2)), linewidth=2, label='Custom (how2matplotlib.com)')

plt.title('Matplotlib Linestyle with Custom Pattern')
plt.xlabel('X-axis')
plt.ylabel('Y-axis')
plt.legend()
plt.grid(True)
plt.show()
Output:
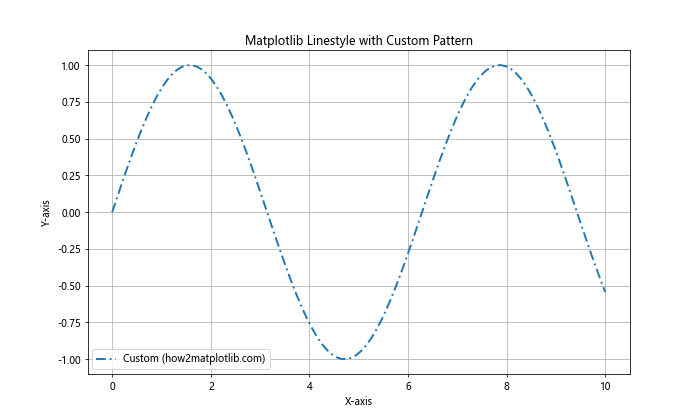
In this example, we’ve used a custom linestyle defined by the tuple (0, (5, 2, 1, 2)). This creates a pattern of 5 points on, 2 points off, 1 point on, and 2 points off, repeated throughout the line.
Combining Matplotlib Linestyle and Color
To further enhance your plots, you can combine linestyle and color options. Matplotlib offers a wide range of color choices that can be used alongside different linestyles:
import matplotlib.pyplot as plt
import numpy as np

x = np.linspace(0, 10, 100)
y1 = np.sin(x)
y2 = np.cos(x)

plt.figure(figsize=(10, 6))
plt.plot(x, y1, linestyle='--', linewidth=2, color='red', label='Red Dashed (how2matplotlib.com)')
plt.plot(x, y2, linestyle=':', linewidth=3, color='blue', label='Blue Dotted (how2matplotlib.com)')

plt.title('Matplotlib Linestyle and Color Combination')
plt.xlabel('X-axis')
plt.ylabel('Y-axis')
plt.legend()
plt.grid(True)
plt.show()
Output:
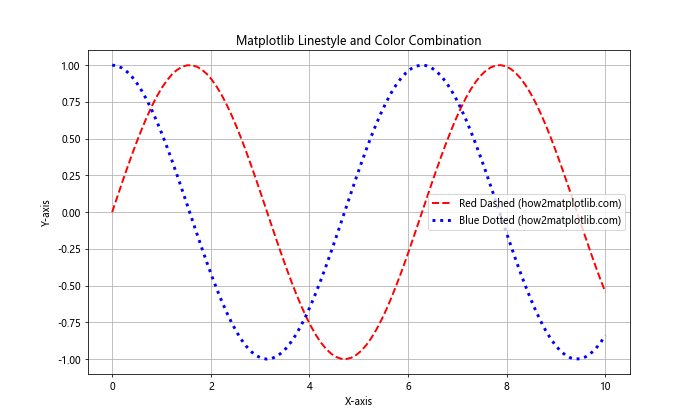
This example shows how to combine linestyle, linewidth, and color options to create visually distinct lines in your plot.
Using Matplotlib Linestyle in Subplots
When working with multiple subplots, you can apply different linestyles to each subplot. This is particularly useful when comparing different datasets or visualizing various aspects of your data:
import matplotlib.pyplot as plt
import numpy as np

x = np.linspace(0, 10, 100)
y1 = np.sin(x)
y2 = np.cos(x)

fig, (ax1, ax2) = plt.subplots(2, 1, figsize=(10, 10))

ax1.plot(x, y1, linestyle='--', linewidth=2, label='Sine (how2matplotlib.com)')
ax1.set_title('Subplot 1: Sine Wave')
ax1.set_xlabel('X-axis')
ax1.set_ylabel('Y-axis')
ax1.legend()
ax1.grid(True)

ax2.plot(x, y2, linestyle=':', linewidth=3, label='Cosine (how2matplotlib.com)')
ax2.set_title('Subplot 2: Cosine Wave')
ax2.set_xlabel('X-axis')
ax2.set_ylabel('Y-axis')
ax2.legend()
ax2.grid(True)

plt.tight_layout()
plt.show()
Output:
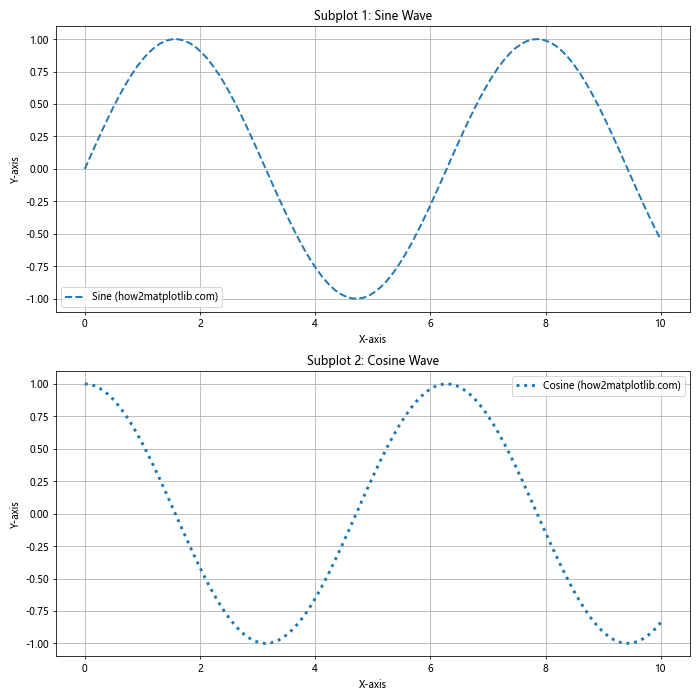
This example demonstrates how to create two subplots, each with a different linestyle and thickness.
Matplotlib Linestyle in Scatter Plots
While linestyles are typically associated with line plots, you can also use them to connect points in scatter plots. This can be useful for showing trends or relationships between data points:
import matplotlib.pyplot as plt
import numpy as np

x = np.linspace(0, 10, 20)
y = np.sin(x) + np.random.normal(0, 0.1, 20)

plt.figure(figsize=(10, 6))
plt.scatter(x, y, label='Data Points (how2matplotlib.com)')
plt.plot(x, y, linestyle='--', linewidth=1, color='red', label='Connecting Line (how2matplotlib.com)')

plt.title('Matplotlib Linestyle in Scatter Plot')
plt.xlabel('X-axis')
plt.ylabel('Y-axis')
plt.legend()
plt.grid(True)
plt.show()
Output:
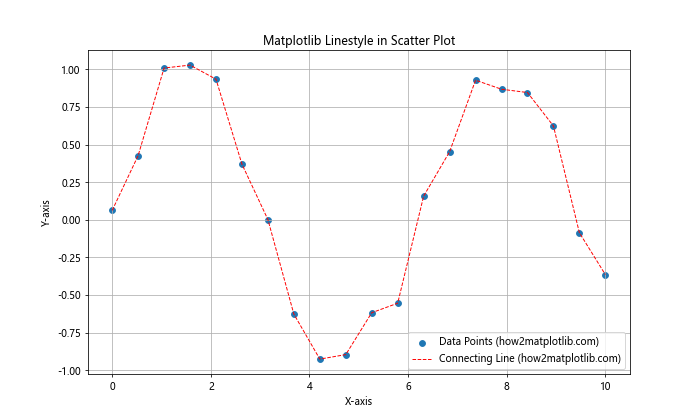
In this example, we’ve created a scatter plot and added a dashed line to connect the points, demonstrating how linestyles can be used in conjunction with scatter plots.
Animating Matplotlib Linestyle and Thickness
You can create animated plots that change linestyle and thickness over time. This can be particularly effective for demonstrating changes in data or emphasizing certain aspects of your visualization:
import matplotlib.pyplot as plt
import numpy as np
from matplotlib.animation import FuncAnimation

fig, ax = plt.subplots(figsize=(10, 6))
x = np.linspace(0, 10, 100)
line, = ax.plot(x, np.sin(x), label='how2matplotlib.com')

def update(frame):
    line.set_ydata(np.sin(x + frame / 10))
    line.set_linestyle(['--', ':', '-.'][frame % 3])
    line.set_linewidth(1 + frame % 5)
    return line,

ani = FuncAnimation(fig, update, frames=100, interval=50, blit=True)

plt.title('Animated Matplotlib Linestyle and Thickness')
plt.xlabel('X-axis')
plt.ylabel('Y-axis')
plt.legend()
plt.grid(True)
plt.show()
Output:
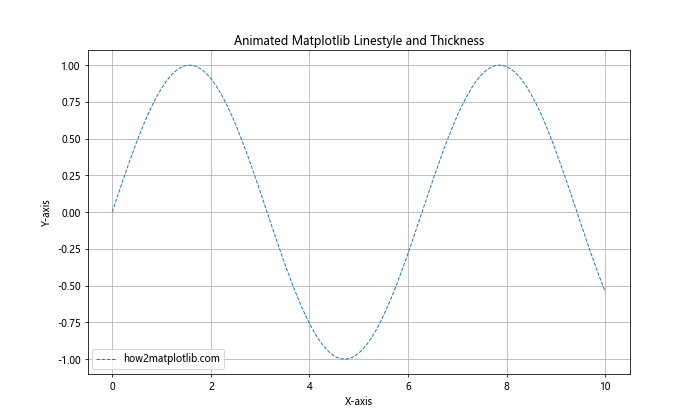
This example creates an animation where the linestyle and thickness of the sine wave change over time.
Using Matplotlib Linestyle in 3D Plots
Matplotlib’s linestyle and thickness options can also be applied to 3D plots, allowing you to create visually striking three-dimensional visualizations:
import matplotlib.pyplot as plt
import numpy as np
from mpl_toolkits.mplot3d import Axes3D

fig = plt.figure(figsize=(10, 8))
ax = fig.add_subplot(111, projection='3d')

t = np.linspace(0, 10, 100)
x = np.sin(t)
y = np.cos(t)
z = t

ax.plot(x, y, z, linestyle='--', linewidth=2, label='3D Curve (how2matplotlib.com)')

ax.set_title('Matplotlib Linestyle in 3D Plot')
ax.set_xlabel('X-axis')
ax.set_ylabel('Y-axis')
ax.set_zlabel('Z-axis')
ax.legend()
plt.show()
Output:
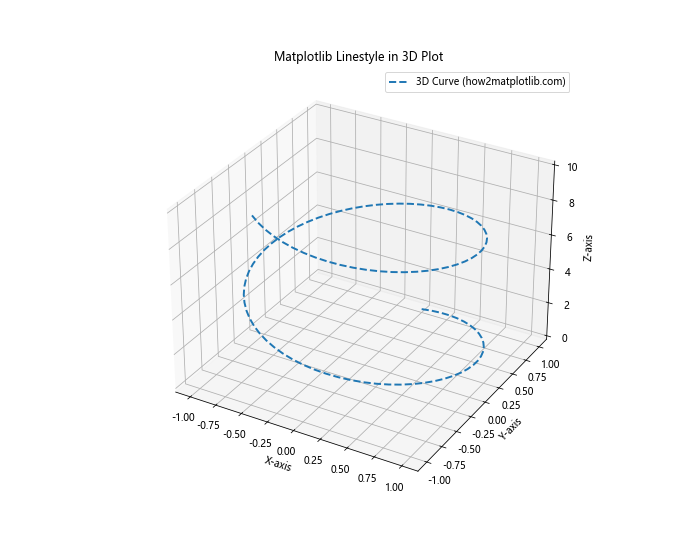
This example demonstrates how to apply linestyle and thickness to a 3D plot, creating a visually appealing representation of a spiral curve.
Customizing Matplotlib Linestyle for Different Plot Types
Different types of plots may benefit from specific linestyle and thickness combinations. Let’s explore how to apply these concepts to various plot types:
Step Plots with Matplotlib Linestyle
import matplotlib.pyplot as plt
import numpy as np

x = np.linspace(0, 10, 20)
y = np.cumsum(np.random.randn(20))

plt.figure(figsize=(10, 6))
plt.step(x, y, linestyle='--', linewidth=2, where='mid', label='Step Plot (how2matplotlib.com)')

plt.title('Matplotlib Linestyle in Step Plot')
plt.xlabel('X-axis')
plt.ylabel('Y-axis')
plt.legend()
plt.grid(True)
plt.show()
Output:
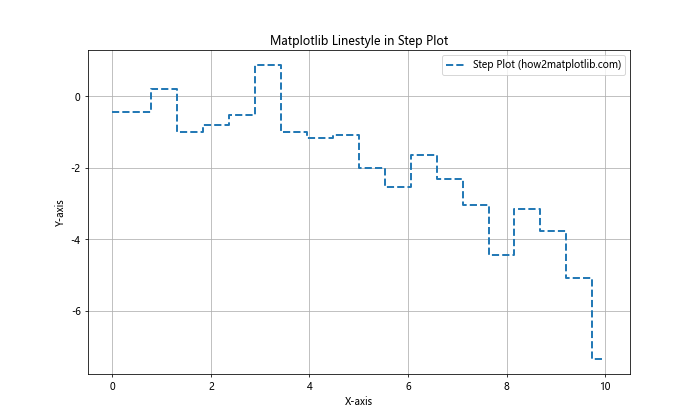
This example shows how to create a step plot with a custom linestyle and thickness.
Stacked Area Plots with Matplotlib Linestyle
import matplotlib.pyplot as plt
import numpy as np

x = np.linspace(0, 10, 100)
y1 = np.sin(x)
y2 = np.cos(x)

plt.figure(figsize=(10, 6))
plt.stackplot(x, y1, y2, labels=['Sin (how2matplotlib.com)', 'Cos (how2matplotlib.com)'])
plt.plot(x, y1 + y2, linestyle='--', linewidth=2, color='red', label='Total (how2matplotlib.com)')

plt.title('Matplotlib Linestyle in Stacked Area Plot')
plt.xlabel('X-axis')
plt.ylabel('Y-axis')
plt.legend(loc='upper left')
plt.grid(True)
plt.show()
Output:
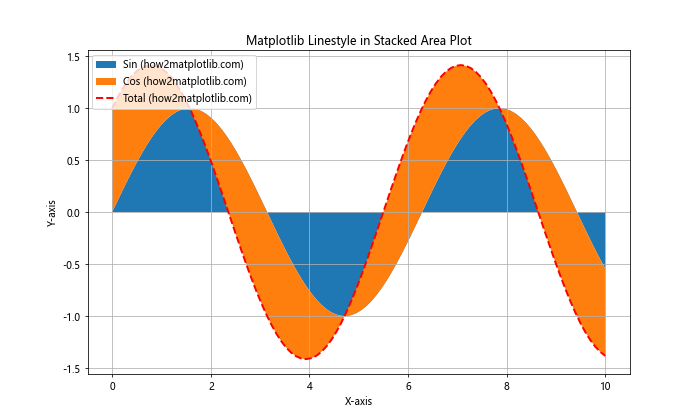
This example demonstrates how to combine a stacked area plot with a custom linestyle for the total line.
Advanced Matplotlib Linestyle Techniques
For more advanced users, Matplotlib offers additional ways to customize linestyles and thicknesses. Let’s explore some of these techniques:
Using Line Collections
Line collections allow you to efficiently draw multiple lines with different styles and thicknesses:
import matplotlib.pyplot as plt
import numpy as np
from matplotlib.collections import LineCollection

x = np.linspace(0, 10, 100)
y = np.sin(x)

points = np.array([x, y]).T.reshape(-1, 1, 2)
segments = np.concatenate([points[:-1], points[1:]], axis=1)

fig, ax = plt.subplots(figsize=(10, 6))
lc = LineCollection(segments, linewidths=np.linspace(1, 5, len(segments)),
                    linestyles='--', label='Line Collection (how2matplotlib.com)')
ax.add_collection(lc)

ax.set_xlim(x.min(), x.max())
ax.set_ylim(y.min(), y.max())
ax.set_title('Matplotlib Linestyle with Line Collection')
ax.set_xlabel('X-axis')
ax.set_ylabel('Y-axis')
plt.legend()
plt.grid(True)
plt.show()
Output:
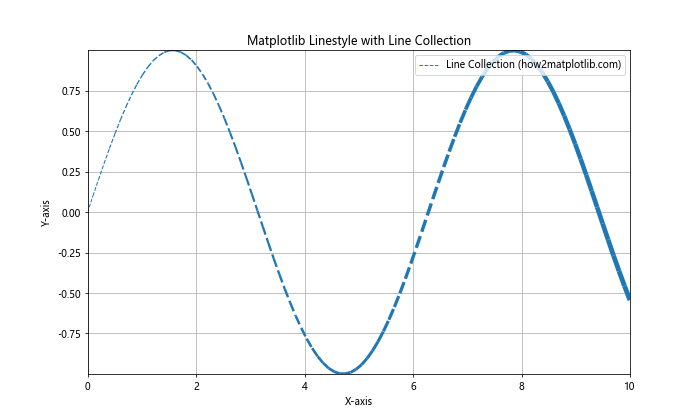
This example uses a LineCollection to create a line with varying thickness along its length.
Best Practices for Using Matplotlib Linestyle and Thick Lines
When working with Matplotlib linestyle and thick lines, it’s important to follow some best practices to ensure your visualizations are effective and visually appealing:
- Consistency: Use consistent linestyles and thicknesses throughout your visualization to maintain a cohesive look.
Contrast: Ensure that different lines are easily distinguishable by using contrasting styles and thicknesses.
Readability: Avoid using overly complex linestyles or extremely thick lines that may obscure data points or other plot elements.
Color coordination: Choose colors that complement your linestyles and thicknesses to create a harmonious visual experience.
5.5. Purpose-driven choices: Select linestyles and thicknesses that serve a specific purpose in your visualization, such as emphasizing important trends or distinguishing between different data series.