How to Use Matplotlib Linestyle None: A Comprehensive Guide
Matplotlib linestyle none is a powerful feature in the popular Python plotting library Matplotlib. This article will explore the various aspects of using matplotlib linestyle none, providing detailed explanations and practical examples to help you master this technique. Whether you’re a beginner or an experienced data visualization enthusiast, this guide will equip you with the knowledge to effectively use matplotlib linestyle none in your plots.
Understanding Matplotlib Linestyle None
Matplotlib linestyle none is a specific line style option in Matplotlib that allows you to create plots without visible connecting lines between data points. This can be particularly useful when you want to emphasize individual data points or create scatter plots without any lines. The linestyle none option is often used in combination with markers to create clear and visually appealing visualizations.
Let’s start with a simple example to demonstrate the use of matplotlib linestyle none:
import matplotlib.pyplot as plt

x = [1, 2, 3, 4, 5]
y = [2, 4, 6, 8, 10]

plt.plot(x, y, linestyle='none', marker='o', label='how2matplotlib.com')
plt.title('Matplotlib Linestyle None Example')
plt.xlabel('X-axis')
plt.ylabel('Y-axis')
plt.legend()
plt.show()
Output:
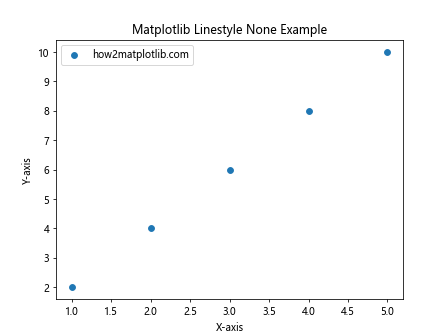
In this example, we create a basic plot using plt.plot() and set the linestyle parameter to 'none'. This removes any connecting lines between the data points. We also add markers using the marker parameter to make the individual data points visible.
The Importance of Matplotlib Linestyle None
Matplotlib linestyle none plays a crucial role in data visualization when you want to focus on individual data points rather than trends or connections between points. Here are some key reasons why matplotlib linestyle none is important:
- Clarity: By removing connecting lines, you can reduce visual clutter and make individual data points stand out.
- Scatter plots: Matplotlib linestyle none is essential for creating scatter plots, which are used to show the relationship between two variables.
- Customization: It allows for greater flexibility in plot design, as you can combine it with various marker styles and colors.
- Data representation: Some datasets are better represented without connecting lines, especially when there’s no inherent order or continuity between points.
Let’s explore another example that demonstrates the importance of matplotlib linestyle none:
import matplotlib.pyplot as plt
import numpy as np

np.random.seed(42)
x = np.random.rand(50)
y = np.random.rand(50)

plt.scatter(x, y, c='blue', marker='s', label='how2matplotlib.com')
plt.plot(x, y, linestyle='none', marker='o', color='red', markersize=5)
plt.title('Scatter Plot with Matplotlib Linestyle None')
plt.xlabel('X-axis')
plt.ylabel('Y-axis')
plt.legend()
plt.show()
Output:
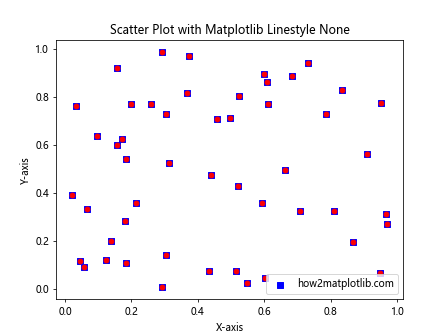
In this example, we create a scatter plot using plt.scatter() and then overlay it with a plot using matplotlib linestyle none. This combination allows us to display the same data points with different marker styles, providing a visually interesting and informative plot.
Different Ways to Specify Matplotlib Linestyle None
Matplotlib provides multiple ways to specify the linestyle none option. Understanding these different methods can help you write more flexible and readable code. Here are the main ways to specify matplotlib linestyle none:
- Using the string ‘none’:
plt.plot(x, y, linestyle='none') - Using an empty string:
plt.plot(x, y, linestyle='') - Using the shorthand notation:
plt.plot(x, y, ls='none') - Using the line style tuple:
plt.plot(x, y, linestyle=(0, ()))
Let’s see an example that demonstrates these different methods:
import matplotlib.pyplot as plt

x = [1, 2, 3, 4, 5]
y1 = [2, 4, 6, 8, 10]
y2 = [1, 3, 5, 7, 9]
y3 = [3, 5, 7, 9, 11]
y4 = [4, 6, 8, 10, 12]

plt.plot(x, y1, linestyle='none', marker='o', label='Method 1 (how2matplotlib.com)')
plt.plot(x, y2, linestyle='', marker='s', label='Method 2')
plt.plot(x, y3, ls='none', marker='^', label='Method 3')
plt.plot(x, y4, linestyle=(0, ()), marker='D', label='Method 4')

plt.title('Different Ways to Specify Matplotlib Linestyle None')
plt.xlabel('X-axis')
plt.ylabel('Y-axis')
plt.legend()
plt.show()
Output:
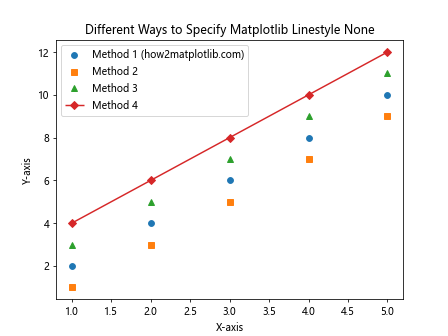
This example demonstrates four different ways to specify matplotlib linestyle none, each applied to a different set of data points. All methods produce the same result: no connecting lines between the data points.
Combining Matplotlib Linestyle None with Markers
One of the most common and effective uses of matplotlib linestyle none is in combination with various marker styles. This combination allows you to create visually appealing and informative plots that highlight individual data points. Matplotlib offers a wide range of marker styles that you can use with linestyle none.
Here’s an example that showcases different marker styles with matplotlib linestyle none:
import matplotlib.pyplot as plt

x = range(1, 6)
markers = ['o', 's', '^', 'D', 'p']

for i, marker in enumerate(markers):
    plt.plot(x, [i*2]*5, linestyle='none', marker=marker,
             label=f'Marker {marker} (how2matplotlib.com)')

plt.title('Matplotlib Linestyle None with Different Markers')
plt.xlabel('X-axis')
plt.ylabel('Y-axis')
plt.legend()
plt.show()
Output:
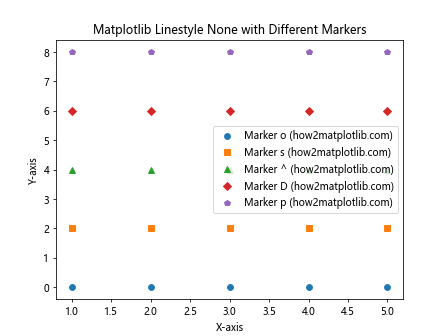
In this example, we create multiple plots using different marker styles, all with matplotlib linestyle none. This demonstrates how you can use various markers to represent different datasets or categories in your visualizations.
Using Matplotlib Linestyle None in Subplots
Matplotlib linestyle none can be particularly useful when working with subplots. Subplots allow you to create multiple plots within a single figure, and using linestyle none can help you create clear and concise visualizations in each subplot.
Let’s look at an example that uses matplotlib linestyle none in subplots:
import matplotlib.pyplot as plt
import numpy as np

np.random.seed(42)
x = np.random.rand(20)
y1 = np.random.rand(20)
y2 = np.random.rand(20)

fig, (ax1, ax2) = plt.subplots(1, 2, figsize=(12, 5))

ax1.plot(x, y1, linestyle='none', marker='o', color='blue', label='how2matplotlib.com')
ax1.set_title('Subplot 1: Scatter Plot')
ax1.set_xlabel('X-axis')
ax1.set_ylabel('Y-axis')
ax1.legend()

ax2.plot(x, y2, linestyle='none', marker='s', color='red')
ax2.set_title('Subplot 2: Square Markers')
ax2.set_xlabel('X-axis')
ax2.set_ylabel('Y-axis')

plt.tight_layout()
plt.show()
Output:
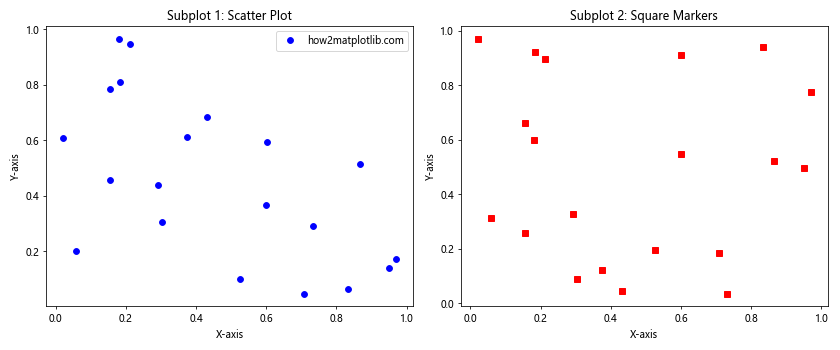
This example creates two subplots, both using matplotlib linestyle none but with different marker styles and colors. This approach allows you to compare different datasets or visualize related information side by side.
Customizing Colors with Matplotlib Linestyle None
While matplotlib linestyle none removes the connecting lines between data points, you can still use colors effectively to enhance your visualizations. Customizing colors can help differentiate between different datasets or highlight specific data points.
Here’s an example that demonstrates color customization with matplotlib linestyle none:
import matplotlib.pyplot as plt
import numpy as np

np.random.seed(42)
x = np.random.rand(50)
y = np.random.rand(50)
colors = np.random.rand(50)
sizes = 1000 * np.random.rand(50)

plt.scatter(x, y, c=colors, s=sizes, alpha=0.5, cmap='viridis')
plt.colorbar(label='Color Scale')

plt.plot(x, y, linestyle='none', marker='o', color='red', markersize=5, alpha=0.5, label='how2matplotlib.com')

plt.title('Color Customization with Matplotlib Linestyle None')
plt.xlabel('X-axis')
plt.ylabel('Y-axis')
plt.legend()
plt.show()
Output:
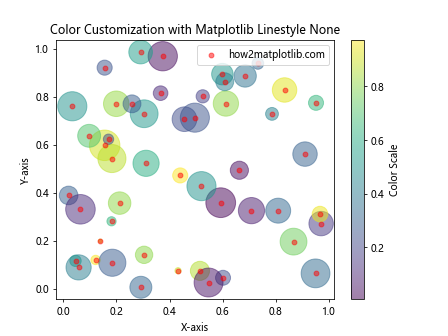
In this example, we create a scatter plot with customized colors and sizes, and then overlay it with a plot using matplotlib linestyle none. This combination allows us to represent multiple dimensions of data (position, color, and size) while still emphasizing individual data points.
Matplotlib Linestyle None in Time Series Data
Matplotlib linestyle none can be particularly useful when working with time series data, especially when you want to highlight specific events or data points without showing continuous trends. This approach can help emphasize discrete events or measurements over time.
Let’s look at an example using matplotlib linestyle none with time series data:
import matplotlib.pyplot as plt
import pandas as pd

dates = pd.date_range(start='2023-01-01', end='2023-12-31', freq='M')
values = [10, 15, 13, 18, 20, 25, 23, 28, 30, 27, 32, 35]

plt.figure(figsize=(12, 6))
plt.plot(dates, values, linestyle='none', marker='o', markersize=8, color='blue', label='how2matplotlib.com')

for i, (date, value) in enumerate(zip(dates, values)):
    if i % 3 == 0:  # Annotate every third point
        plt.annotate(f'{value}', (date, value), textcoords="offset points", xytext=(0,10), ha='center')

plt.title('Monthly Data with Matplotlib Linestyle None')
plt.xlabel('Date')
plt.ylabel('Value')
plt.legend()
plt.grid(True, linestyle='--', alpha=0.7)
plt.show()
Output:
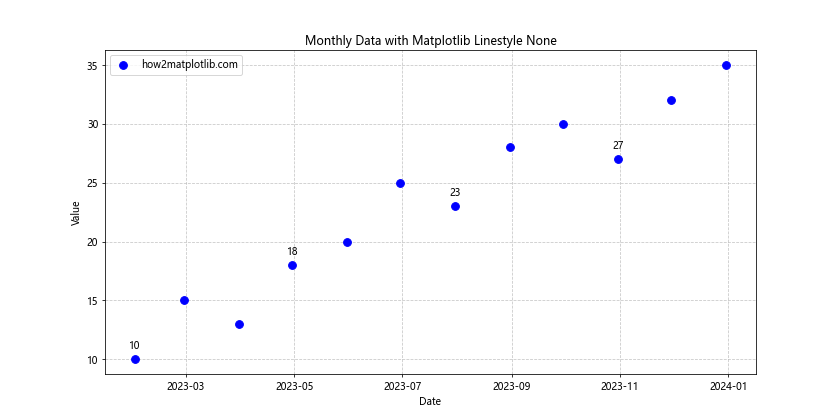
This example creates a time series plot using matplotlib linestyle none, with annotations for selected data points. This approach allows us to clearly see the individual monthly values without implying a continuous trend between the points.
Combining Matplotlib Linestyle None with Other Line Styles
While matplotlib linestyle none is useful on its own, it can also be effectively combined with other line styles to create more complex and informative visualizations. This combination can help highlight trends while still emphasizing individual data points.
Here’s an example that combines matplotlib linestyle none with other line styles:
import matplotlib.pyplot as plt
import numpy as np

x = np.linspace(0, 10, 50)
y1 = np.sin(x)
y2 = np.cos(x)

plt.plot(x, y1, linestyle='-', color='blue', label='Sine Wave')
plt.plot(x, y2, linestyle='--', color='red', label='Cosine Wave')
plt.plot(x[::5], y1[::5], linestyle='none', marker='o', color='blue', label='Sine Points (how2matplotlib.com)')
plt.plot(x[::5], y2[::5], linestyle='none', marker='s', color='red', label='Cosine Points')

plt.title('Combining Matplotlib Linestyle None with Other Styles')
plt.xlabel('X-axis')
plt.ylabel('Y-axis')
plt.legend()
plt.grid(True, linestyle=':', alpha=0.7)
plt.show()
Output:
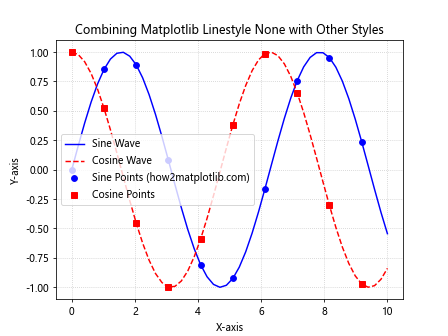
In this example, we plot sine and cosine waves using solid and dashed lines, respectively. We then overlay these plots with points using matplotlib linestyle none, creating a visualization that shows both the continuous trends and specific data points.
Using Matplotlib Linestyle None in 3D Plots
Matplotlib linestyle none can also be used effectively in 3D plots to create scatter plots or emphasize specific points in three-dimensional space. This can be particularly useful for visualizing complex datasets or relationships between multiple variables.
Let’s look at an example of using matplotlib linestyle none in a 3D plot:
import matplotlib.pyplot as plt
from mpl_toolkits.mplot3d import Axes3D
import numpy as np

fig = plt.figure(figsize=(10, 8))
ax = fig.add_subplot(111, projection='3d')

n = 100
x = np.random.rand(n)
y = np.random.rand(n)
z = np.random.rand(n)
colors = np.random.rand(n)

ax.scatter(x, y, z, c=colors, cmap='viridis', s=50, label='how2matplotlib.com')
ax.plot(x, y, z, linestyle='none', marker='o', color='red', markersize=5, alpha=0.5)

ax.set_xlabel('X-axis')
ax.set_ylabel('Y-axis')
ax.set_zlabel('Z-axis')
ax.set_title('3D Scatter Plot with Matplotlib Linestyle None')
plt.colorbar(ax.scatter(x, y, z, c=colors, cmap='viridis', s=50), label='Color Scale')
plt.legend()
plt.show()
Output:
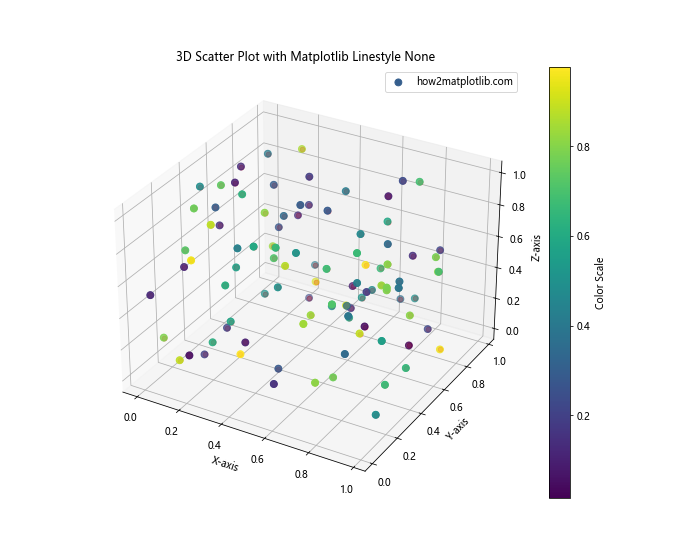
This example creates a 3D scatter plot using both ax.scatter() and ax.plot() with matplotlib linestyle none. This combination allows us to represent the data points with different colors and sizes while also emphasizing their positions in 3D space.
Matplotlib Linestyle None in Polar Plots
Matplotlib linestyle none can be used effectively in polar plots to create radial scatter plots or highlight specific angular positions. This can be particularly useful for visualizing directional or cyclical data.
Here’s an example of using matplotlib linestyle none in a polar plot:
import matplotlib.pyplot as plt
import numpy as np

theta = np.linspace(0, 2*np.pi, 100)
r = np.random.rand(100)

fig, ax = plt.subplots(subplot_kw=dict(projection='polar'))
ax.plot(theta, r, linestyle='none', marker='o', markersize=5, label='how2matplotlib.com')

ax.set_title('Polar Plot with Matplotlib Linestyle None')
ax.set_rticks([0.2, 0.4, 0.6, 0.8])
ax.grid(True)
plt.legend()
plt.show()
Output:
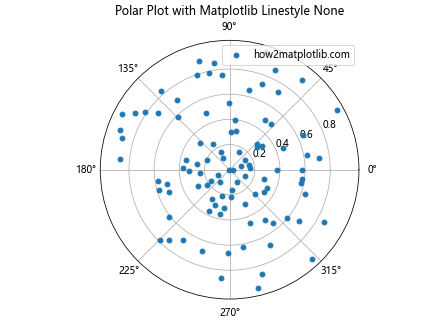
This example creates a polar plot using matplotlib linestyle none, resulting in a radial scatter plot. This approach is useful for visualizing data with angular and radial components without implying connections between the points.
Matplotlib Linestyle None in Heatmaps
While heatmaps typically use color to represent data values, matplotlib linestyle none can be used to overlay specific points or markers on a heatmap. This can be useful for highlighting particular data points or adding additional information to the visualization.
Here’s an example of using matplotlib linestyle none with a heatmap:
import matplotlib.pyplot as plt
import numpy as np

data = np.random.rand(10, 10)
x, y = np.meshgrid(np.arange(10), np.arange(10))
mask = data > 0.8  # Highlight values above 0.8

plt.figure(figsize=(10, 8))
plt.imshow(data, cmap='viridis')
plt.colorbar(label='Value')

plt.plot(x[mask], y[mask], linestyle='none', marker='o', color='red', markersize=8, label='how2matplotlib.com')

plt.title('Heatmap with Matplotlib Linestyle None Overlay')
plt.xlabel('X-axis')
plt.ylabel('Y-axis')
plt.legend()
plt.show()
Output:
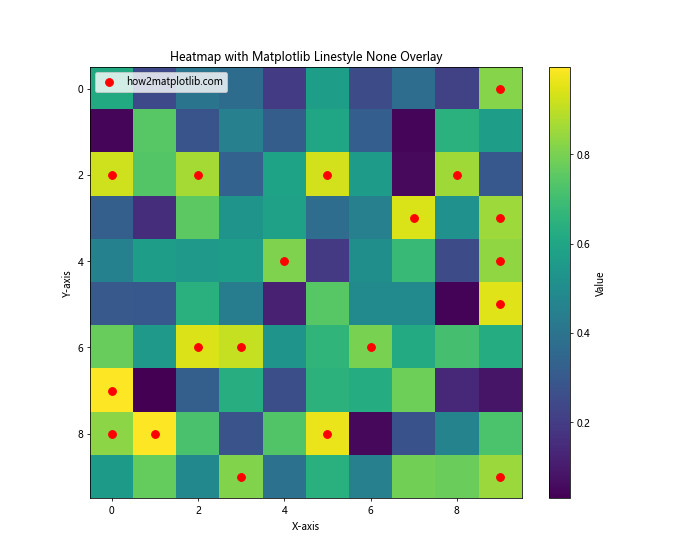
This example creates a heatmap and then uses matplotlib linestyle none to overlay markers on specific points that meet a certain condition. This combination allows us to highlight particular values within the context of the overall data distribution.
Animating Plots with Matplotlib Linestyle None
Matplotlib linestyle none can be effectively used in animations to create dynamic scatter plots or emphasize changing data points over time. This can be particularly useful for visualizing evolving datasets or simulations.
Here’s an example of creating a simple animation using matplotlib linestyle none:
import matplotlib.pyplot as plt
import matplotlib.animation as animation
import numpy as np

fig, ax = plt.subplots()

def animate(frame):
    ax.clear()
    x = np.random.rand(20)
    y = np.random.rand(20)
    ax.plot(x, y, linestyle='none', marker='o', markersize=10, label='how2matplotlib.com')
    ax.set_xlim(0, 1)
    ax.set_ylim(0, 1)
    ax.set_title(f'Frame {frame + 1}')
    ax.legend()

ani = animation.FuncAnimation(fig, animate, frames=50, interval=200, repeat=True)

plt.show()
Output:
This example creates an animation where the positions of the points change in each frame. By using matplotlib linestyle none, we create a dynamic scatter plot that clearly shows the changing positions of individual points over time.
Best Practices for Using Matplotlib Linestyle None
To make the most effective use of matplotlib linestyle none, consider the following best practices:
- Combine with appropriate markers: Always use clear and visible markers when using linestyle none to ensure data points are easily identifiable.
Use color effectively: Even without lines, you can use color to differentiate between different datasets or highlight specific points.
Consider data density: For datasets with many points, consider using alpha transparency or adjusting marker size to prevent overcrowding.
Provide context: Use titles, labels, and legends to provide context for your plot and explain what the individual points represent.
Combine with other styles: When appropriate, consider combining linestyle none with other line styles to show both individual points and overall trends.
Here’s an example that demonstrates these best practices: