How to Master Matplotlib Linestyle and Marker: A Comprehensive Guide
Matplotlib linestyle and marker are essential components for creating visually appealing and informative plots in Python. This comprehensive guide will explore the various aspects of matplotlib linestyle and marker options, providing detailed explanations and practical examples to help you master these crucial elements of data visualization.
Understanding Matplotlib Linestyle and Marker Basics
Matplotlib linestyle and marker options allow you to customize the appearance of lines and data points in your plots. The linestyle determines the pattern of the line connecting data points, while markers represent individual data points on the plot. By combining different linestyles and markers, you can create visually distinct and informative plots that effectively communicate your data.
Let’s start with a simple example that demonstrates the use of matplotlib linestyle and marker:
import matplotlib.pyplot as plt
import numpy as np

x = np.linspace(0, 10, 100)
y = np.sin(x)

plt.plot(x, y, linestyle='--', marker='o', label='how2matplotlib.com')
plt.title('Matplotlib Linestyle and Marker Example')
plt.xlabel('X-axis')
plt.ylabel('Y-axis')
plt.legend()
plt.show()
Output:
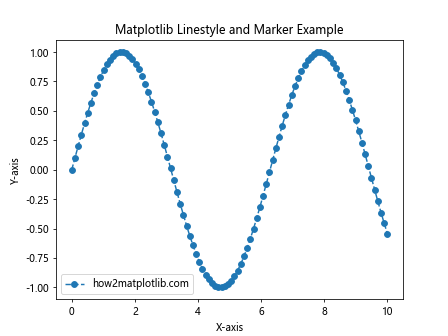
In this example, we use a dashed linestyle (‘–‘) and circular markers (‘o’) to plot a sine wave. The linestyle and marker parameters in the plt.plot() function allow us to specify these attributes.
Exploring Matplotlib Linestyle Options
Matplotlib offers a wide range of linestyle options to customize the appearance of your plots. Let’s dive deeper into the various linestyle choices available:
Solid Lines
The solid line is the default linestyle in matplotlib. You can explicitly set it using the following code:
import matplotlib.pyplot as plt
import numpy as np

x = np.linspace(0, 10, 100)
y = np.sin(x)

plt.plot(x, y, linestyle='-', label='how2matplotlib.com')
plt.title('Matplotlib Solid Linestyle')
plt.xlabel('X-axis')
plt.ylabel('Y-axis')
plt.legend()
plt.show()
Output:
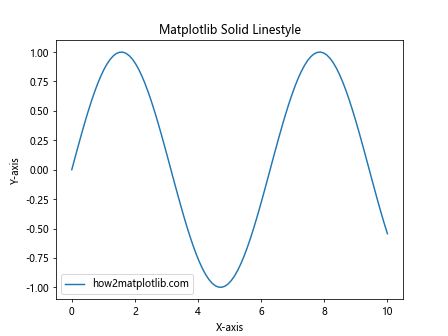
This example demonstrates the use of a solid line (‘-‘) to plot the sine wave.
Dashed Lines
Dashed lines are useful for distinguishing between different data series or highlighting specific trends. Here’s an example:
import matplotlib.pyplot as plt
import numpy as np

x = np.linspace(0, 10, 100)
y1 = np.sin(x)
y2 = np.cos(x)

plt.plot(x, y1, linestyle='--', label='Sine - how2matplotlib.com')
plt.plot(x, y2, linestyle='-.', label='Cosine - how2matplotlib.com')
plt.title('Matplotlib Dashed Linestyles')
plt.xlabel('X-axis')
plt.ylabel('Y-axis')
plt.legend()
plt.show()
Output:
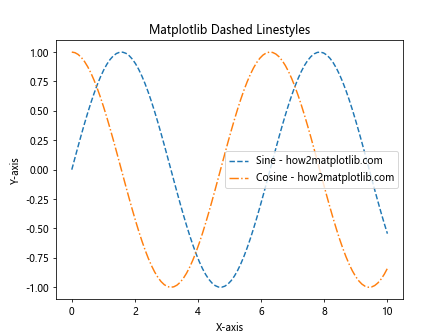
In this example, we use two different dashed linestyles: ‘–‘ for the sine wave and ‘-.’ for the cosine wave.
Dotted Lines
Dotted lines can be useful for representing secondary or less important data. Here’s how to create a dotted line:
import matplotlib.pyplot as plt
import numpy as np

x = np.linspace(0, 10, 100)
y = np.sin(x)

plt.plot(x, y, linestyle=':', label='how2matplotlib.com')
plt.title('Matplotlib Dotted Linestyle')
plt.xlabel('X-axis')
plt.ylabel('Y-axis')
plt.legend()
plt.show()
Output:
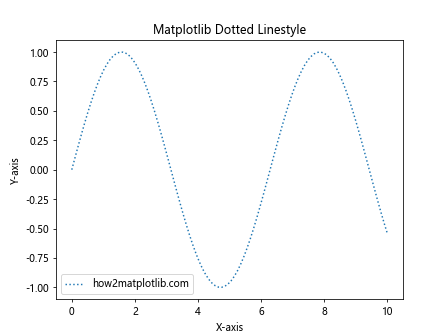
This example uses a dotted linestyle (‘:’) to plot the sine wave.
Custom Linestyles
Matplotlib also allows you to create custom linestyles using a tuple of on/off lengths. Here’s an example:
import matplotlib.pyplot as plt
import numpy as np

x = np.linspace(0, 10, 100)
y = np.sin(x)

plt.plot(x, y, linestyle=(0, (5, 2, 1, 2)), label='how2matplotlib.com')
plt.title('Matplotlib Custom Linestyle')
plt.xlabel('X-axis')
plt.ylabel('Y-axis')
plt.legend()
plt.show()
Output:
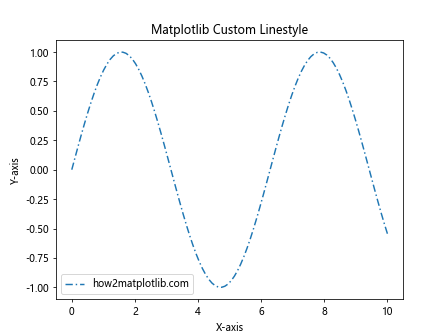
In this example, we create a custom linestyle using the tuple (0, (5, 2, 1, 2)), which represents a pattern of 5 points on, 2 off, 1 on, and 2 off.
Mastering Matplotlib Marker Options
Markers are essential for highlighting individual data points in your plots. Matplotlib provides a wide variety of marker styles to choose from. Let’s explore some of the most commonly used markers:
Circular Markers
Circular markers are one of the most popular choices for representing data points. Here’s an example:
import matplotlib.pyplot as plt
import numpy as np

x = np.linspace(0, 10, 20)
y = np.sin(x)

plt.plot(x, y, linestyle='-', marker='o', label='how2matplotlib.com')
plt.title('Matplotlib Circular Markers')
plt.xlabel('X-axis')
plt.ylabel('Y-axis')
plt.legend()
plt.show()
Output:
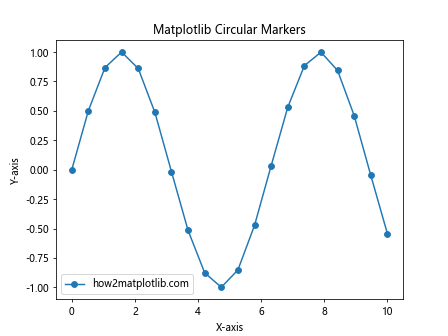
This example uses circular markers (‘o’) along with a solid line to represent the data points.
Square Markers
Square markers can be useful for distinguishing between different data series. Here’s how to use them:
import matplotlib.pyplot as plt
import numpy as np

x = np.linspace(0, 10, 20)
y1 = np.sin(x)
y2 = np.cos(x)

plt.plot(x, y1, linestyle='-', marker='s', label='Sine - how2matplotlib.com')
plt.plot(x, y2, linestyle='-', marker='D', label='Cosine - how2matplotlib.com')
plt.title('Matplotlib Square Markers')
plt.xlabel('X-axis')
plt.ylabel('Y-axis')
plt.legend()
plt.show()
Output:
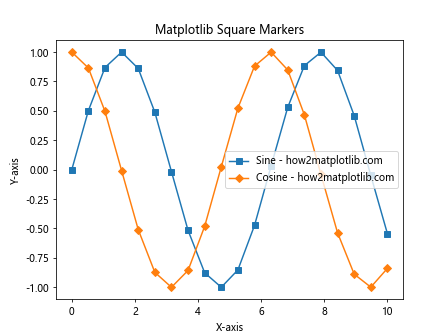
In this example, we use square markers (‘s’) for the sine wave and diamond markers (‘D’) for the cosine wave.
Triangle Markers
Triangle markers can add variety to your plots and help differentiate between data series. Here’s an example:
import matplotlib.pyplot as plt
import numpy as np

x = np.linspace(0, 10, 20)
y = np.sin(x)

plt.plot(x, y, linestyle='-', marker='^', label='how2matplotlib.com')
plt.title('Matplotlib Triangle Markers')
plt.xlabel('X-axis')
plt.ylabel('Y-axis')
plt.legend()
plt.show()
Output:
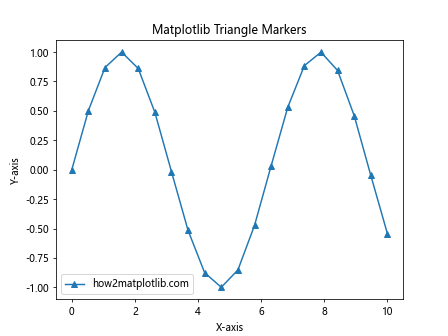
This example uses upward-pointing triangle markers (‘^’) to represent the data points.
Star Markers
Star markers can be eye-catching and useful for highlighting specific data points. Here’s how to use them:
import matplotlib.pyplot as plt
import numpy as np

x = np.linspace(0, 10, 20)
y = np.sin(x)

plt.plot(x, y, linestyle='-', marker='*', label='how2matplotlib.com')
plt.title('Matplotlib Star Markers')
plt.xlabel('X-axis')
plt.ylabel('Y-axis')
plt.legend()
plt.show()
Output:
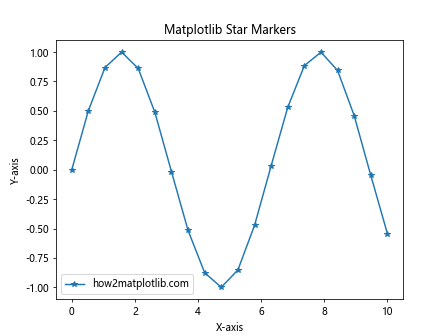
This example uses star markers (‘*’) to represent the data points.
Combining Matplotlib Linestyle and Marker Options
One of the strengths of matplotlib is the ability to combine different linestyles and markers to create visually appealing and informative plots. Let’s explore some examples of how to effectively combine these options:
Multiple Data Series with Different Linestyles and Markers
When plotting multiple data series, using different linestyles and markers can help distinguish between them:
import matplotlib.pyplot as plt
import numpy as np

x = np.linspace(0, 10, 50)
y1 = np.sin(x)
y2 = np.cos(x)
y3 = np.tan(x)

plt.plot(x, y1, linestyle='-', marker='o', label='Sine - how2matplotlib.com')
plt.plot(x, y2, linestyle='--', marker='s', label='Cosine - how2matplotlib.com')
plt.plot(x, y3, linestyle=':', marker='^', label='Tangent - how2matplotlib.com')
plt.title('Matplotlib Linestyle and Marker Combinations')
plt.xlabel('X-axis')
plt.ylabel('Y-axis')
plt.legend()
plt.ylim(-2, 2)  # Limit y-axis for better visibility
plt.show()
Output:
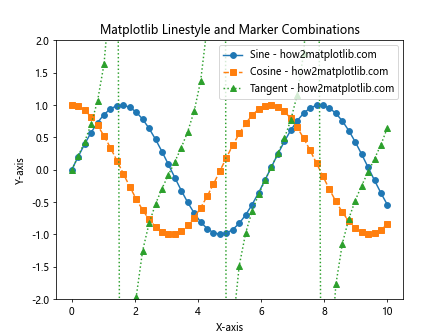
In this example, we plot three trigonometric functions using different combinations of linestyles and markers to make each series easily distinguishable.
Emphasizing Specific Data Points
You can use markers to emphasize specific data points while using linestyles to show the overall trend:
import matplotlib.pyplot as plt
import numpy as np

x = np.linspace(0, 10, 100)
y = np.sin(x)

plt.plot(x, y, linestyle='-', label='Trend - how2matplotlib.com')
plt.plot(x[::10], y[::10], linestyle='None', marker='o', label='Data Points - how2matplotlib.com')
plt.title('Matplotlib Linestyle for Trend, Markers for Data Points')
plt.xlabel('X-axis')
plt.ylabel('Y-axis')
plt.legend()
plt.show()
Output:
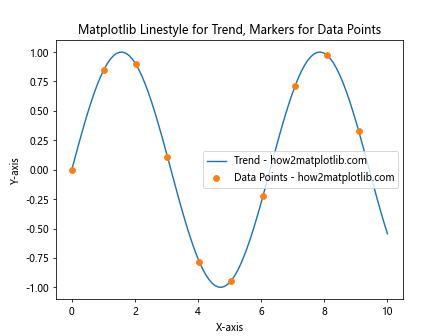
This example uses a solid line to show the overall trend of the sine wave, while using markers to highlight specific data points at regular intervals.
Advanced Matplotlib Linestyle and Marker Techniques
Now that we’ve covered the basics, let’s explore some advanced techniques for using matplotlib linestyle and marker options:
Varying Linestyle and Marker Properties
You can vary the properties of linestyles and markers along a single plot to emphasize different regions or trends:
import matplotlib.pyplot as plt
import numpy as np

x = np.linspace(0, 10, 100)
y = np.sin(x)

plt.plot(x, y, linestyle='-', label='how2matplotlib.com')
plt.plot(x[y>0], y[y>0], linestyle='None', marker='o', markersize=5, label='Positive - how2matplotlib.com')
plt.plot(x[y<0], y[y<0], linestyle='None', marker='s', markersize=5, label='Negative - how2matplotlib.com')
plt.title('Matplotlib Varying Marker Properties')
plt.xlabel('X-axis')
plt.ylabel('Y-axis')
plt.legend()
plt.show()
Output:
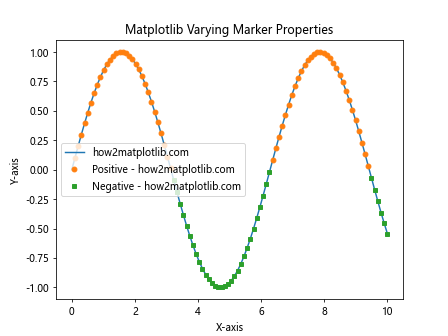
This example uses different markers to highlight positive and negative regions of the sine wave.
Linestyle and Marker in Scatter Plots
While we've focused on line plots, matplotlib linestyle and marker options are also useful in scatter plots:
import matplotlib.pyplot as plt
import numpy as np

x = np.random.rand(50)
y = np.random.rand(50)
colors = np.random.rand(50)
sizes = 1000 * np.random.rand(50)

plt.scatter(x, y, c=colors, s=sizes, alpha=0.5, marker='*', label='how2matplotlib.com')
plt.colorbar(label='Color Scale')
plt.title('Matplotlib Scatter Plot with Star Markers')
plt.xlabel('X-axis')
plt.ylabel('Y-axis')
plt.legend()
plt.show()
Output:

This example creates a scatter plot using star markers, with varying colors and sizes to represent additional dimensions of data.
Customizing Matplotlib Linestyle and Marker Appearance
Matplotlib provides extensive options for customizing the appearance of linestyles and markers. Let's explore some of these customization options:
Line and Marker Colors
You can easily change the colors of lines and markers to create visually appealing plots:
import matplotlib.pyplot as plt
import numpy as np

x = np.linspace(0, 10, 100)
y1 = np.sin(x)
y2 = np.cos(x)

plt.plot(x, y1, linestyle='-', color='red', marker='o', markerfacecolor='blue', markeredgecolor='red', label='Sine - how2matplotlib.com')
plt.plot(x, y2, linestyle='--', color='green', marker='s', markerfacecolor='yellow', markeredgecolor='green', label='Cosine - how2matplotlib.com')
plt.title('Matplotlib Custom Line and Marker Colors')
plt.xlabel('X-axis')
plt.ylabel('Y-axis')
plt.legend()
plt.show()
Output:
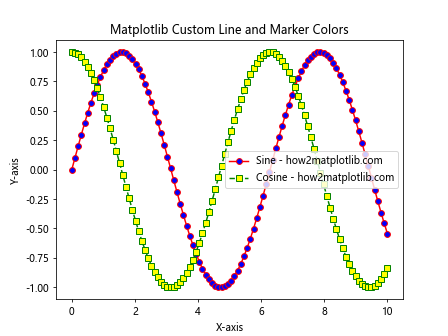
This example demonstrates how to set custom colors for lines, marker faces, and marker edges.
Line Width and Marker Size
Adjusting line width and marker size can help emphasize certain aspects of your plot:
import matplotlib.pyplot as plt
import numpy as np

x = np.linspace(0, 10, 50)
y1 = np.sin(x)
y2 = np.cos(x)

plt.plot(x, y1, linestyle='-', linewidth=2, marker='o', markersize=8, label='Sine - how2matplotlib.com')
plt.plot(x, y2, linestyle='--', linewidth=1, marker='s', markersize=6, label='Cosine - how2matplotlib.com')
plt.title('Matplotlib Custom Line Width and Marker Size')
plt.xlabel('X-axis')
plt.ylabel('Y-axis')
plt.legend()
plt.show()
Output:
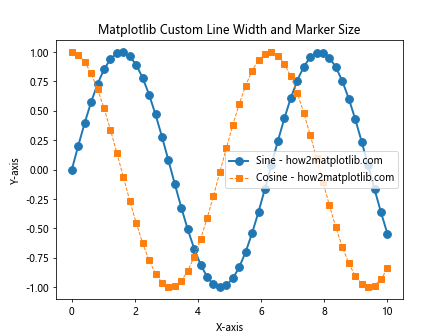
This example shows how to adjust line width and marker size for different data series.
Marker Fill Styles
Matplotlib allows you to customize the fill style of markers:
import matplotlib.pyplot as plt
import numpy as np

x = np.linspace(0, 10, 50)
y = np.sin(x)

plt.plot(x, y, linestyle='-', marker='o', fillstyle='full', label='Full - how2matplotlib.com')
plt.plot(x, y+0.5, linestyle='-', marker='o', fillstyle='left', label='Left - how2matplotlib.com')
plt.plot(x, y-0.5, linestyle='-', marker='o', fillstyle='right', label='Right - how2matplotlib.com')
plt.plot(x, y+1, linestyle='-', marker='o', fillstyle='bottom', label='Bottom - how2matplotlib.com')
plt.plot(x, y-1, linestyle='-', marker='o', fillstyle='top', label='Top - how2matplotlib.com')
plt.title('Matplotlib Marker Fill Styles')
plt.xlabel('X-axis')
plt.ylabel('Y-axis')
plt.legend()
plt.show()
Output:
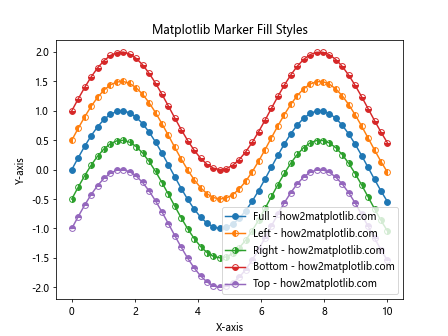
This example demonstrates different marker fill styles available in matplotlib.
Matplotlib Linestyle and Marker in Different Plot Types
While we've primarily focused on line plots, matplotlib linestyle and marker options can be applied to various plot types. Let's explore some examples:
Bar Plots with Custom Linestyles
You can use linestyles to add patterns to bar plots:
import matplotlib.pyplot as plt
import numpy as np

categories = ['A', 'B', 'C', 'D']
values = [3, 7, 2, 5]

plt.bar(categories, values, edgecolor='black', linestyle='--', fill=False, label='how2matplotlib.com')
plt.title('Matplotlib Bar Plot with Custom Linestyle')
plt.xlabel('Categories')
plt.ylabel('Values')
plt.legend()
plt.show()
Output:
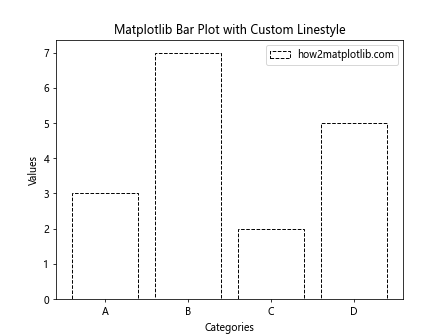
This example creates a bar plot with dashed outlines for each bar.
Polar Plots with Markers
Linestyles and markers can be effectively used in polar plots:
import matplotlib.pyplot as plt
import numpy as np

theta = np.linspace(0, 2*np.pi, 100)
r = np.sin(4*theta)

plt.polar(theta, r, linestyle='-', marker='o', markersize=4, label='how2matplotlib.com')
plt.title('Matplotlib Polar Plot with Linestyle and Markers')
plt.legend()
plt.show()
Output:
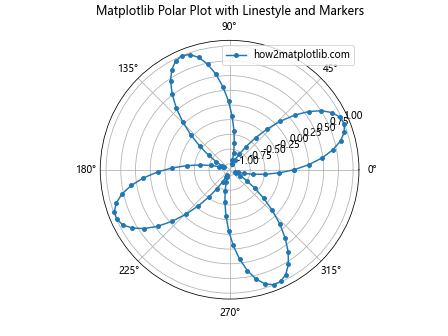
This example creates a polar plot with a solid line and circular markers.
Step Plots with Custom Markers
Step plots can benefit from custom markers to highlight data points:
import matplotlib.pyplot as plt
import numpy as np

x = np.linspace(0, 10, 15)
y = np.sin(x)

plt.step(x, y, where='mid', linestyle='-', marker='D', markersize=8, label='how2matplotlib.com')
plt.title('Matplotlib Step Plot with Custom Markers')
plt.xlabel('X-axis')
plt.ylabel('Y-axis')
plt.legend()
plt.show()
Output:
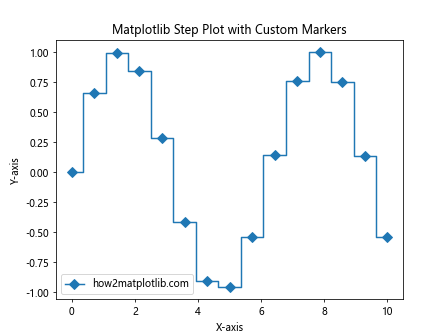
This example creates a step plot with diamond markers at each data point.
Best Practices for Using Matplotlib Linestyle and Marker
To effectively use matplotlib linestyle and marker options, consider the following best practices:
- Choose appropriate linestyles and markers for your data type and plot purpose.
- Use consistent linestyles and markers throughout your visualization for clarity.
- Avoid overusing different styles, as it can make your plot cluttered and hard to read.
- Consider color-blind friendly color schemes when selecting colors for lines and markers.
- Use markers sparingly in dense datasets to avoid overcrowding the plot.
Troubleshooting Common Matplotlib Linestyle and Marker Issues
When working with matplotlib linestyle and marker options, you may encounter some common issues. Here are some troubleshooting tips:
Markers Not Showing Up
If your markers are not visible, check the following:
- Ensure that you've specified a valid marker style.
- Check if the marker size is appropriate for your plot scale.
- Verify that the marker color is different from the background color.
Inconsistent Linestyles
If your linestyles appear inconsistent, consider these points:
- Make sure you're using the correct linestyle string or tuple.
- Check if the line width is appropriate for the chosen linestyle.
- Ensure that the plot resolution is high enough to render the linestyle accurately.
Marker and Line Misalignment
If markers and lines don't align properly, try the following:
- Use the
markeveryparameter to control marker placement. - Adjust the
drawstyleparameter to change how lines connect between points. - Consider using
plt.plot()with separate calls for lines and markers.
Matplotlib linestyle and marker Conclusion
Mastering matplotlib linestyle and marker options is crucial for creating effective and visually appealing data visualizations. By understanding the various options available and how to combine them, you can create plots that effectively communicate your data and insights.
Remember to experiment with different combinations of linestyles and markers to find the best representation for your specific dataset and visualization goals. With practice and attention to detail, you'll be able to create professional-looking plots that effectively convey your message.