How to Master Matplotlib Grid: A Comprehensive Guide for Data Visualization
Matplotlib grid is an essential feature in data visualization that helps improve the readability and interpretation of plots. In this comprehensive guide, we’ll explore everything you need to know about using matplotlib grid effectively. From basic grid setup to advanced customization techniques, we’ll cover it all with practical examples and easy-to-understand explanations.
Matplotlib grid Recommended Articles
Understanding the Basics of Matplotlib Grid
Matplotlib grid is a powerful tool that adds horizontal and vertical lines to your plots, creating a grid-like structure. This grid helps viewers easily compare data points and understand the scale of the visualization. Let’s start with a simple example of how to add a basic grid to a matplotlib plot:
import matplotlib.pyplot as plt
import numpy as np

x = np.linspace(0, 10, 100)
y = np.sin(x)

plt.plot(x, y, label='Sine wave')
plt.title('Basic Matplotlib Grid Example - how2matplotlib.com')
plt.xlabel('X-axis')
plt.ylabel('Y-axis')
plt.grid(True)
plt.legend()
plt.show()
Output:
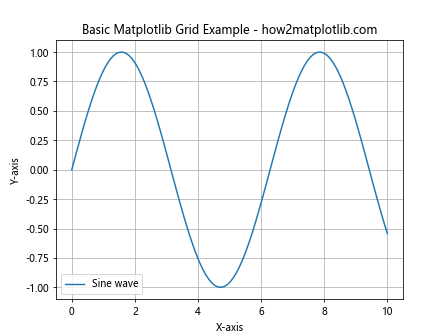
In this example, we’ve created a simple sine wave plot and added a basic grid using plt.grid(True). This command turns on the grid for both x and y axes.
Customizing Matplotlib Grid Appearance
Matplotlib grid offers various customization options to make your plots more visually appealing and informative. Let’s explore some of these options:
Changing Grid Line Style
You can modify the style of grid lines using the linestyle parameter:
import matplotlib.pyplot as plt
import numpy as np

x = np.linspace(0, 10, 100)
y = np.cos(x)

plt.plot(x, y, label='Cosine wave')
plt.title('Custom Grid Line Style - how2matplotlib.com')
plt.xlabel('X-axis')
plt.ylabel('Y-axis')
plt.grid(True, linestyle='--')
plt.legend()
plt.show()
Output:
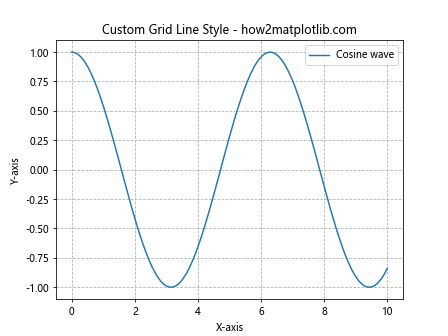
In this example, we’ve set the grid line style to dashed using linestyle='--'. You can experiment with other styles like ‘:’ for dotted lines or ‘-.’ for dash-dot lines.
Adjusting Grid Line Color and Transparency
Changing the color and transparency of grid lines can help them blend better with your plot:
import matplotlib.pyplot as plt
import numpy as np

x = np.linspace(0, 10, 100)
y = np.exp(x)

plt.plot(x, y, label='Exponential function')
plt.title('Custom Grid Color and Transparency - how2matplotlib.com')
plt.xlabel('X-axis')
plt.ylabel('Y-axis')
plt.grid(True, color='red', alpha=0.3)
plt.legend()
plt.show()
Output:
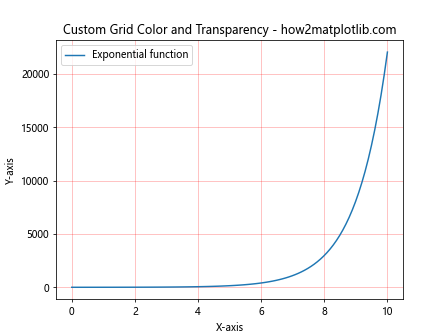
Here, we’ve set the grid color to red and reduced its opacity to 30% using alpha=0.3.
Controlling Matplotlib Grid Density
Sometimes, you may want to adjust the density of your grid lines. Matplotlib grid allows you to control this aspect easily:
Changing Major Grid Line Interval
To change the interval of major grid lines, you can use the locator parameter:
import matplotlib.pyplot as plt
import numpy as np
from matplotlib.ticker import MultipleLocator

x = np.linspace(0, 20, 200)
y = np.log(x)

fig, ax = plt.subplots()
ax.plot(x, y, label='Logarithmic function')
ax.set_title('Custom Major Grid Interval - how2matplotlib.com')
ax.set_xlabel('X-axis')
ax.set_ylabel('Y-axis')
ax.grid(True)
ax.xaxis.set_major_locator(MultipleLocator(5))
ax.yaxis.set_major_locator(MultipleLocator(1))
ax.legend()
plt.show()
Output:
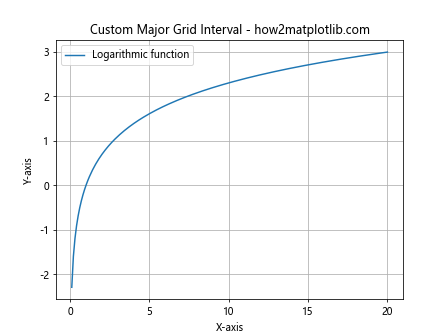
In this example, we’ve set the major grid lines to appear every 5 units on the x-axis and every 1 unit on the y-axis using MultipleLocator.
Adding Minor Grid Lines
To add minor grid lines between major grid lines, you can use the which parameter:
import matplotlib.pyplot as plt
import numpy as np

x = np.linspace(0, 10, 100)
y = x**2

fig, ax = plt.subplots()
ax.plot(x, y, label='Quadratic function')
ax.set_title('Major and Minor Grid Lines - how2matplotlib.com')
ax.set_xlabel('X-axis')
ax.set_ylabel('Y-axis')
ax.grid(True, which='both', linestyle='--', color='gray', alpha=0.5)
ax.minorticks_on()
ax.legend()
plt.show()
Output:
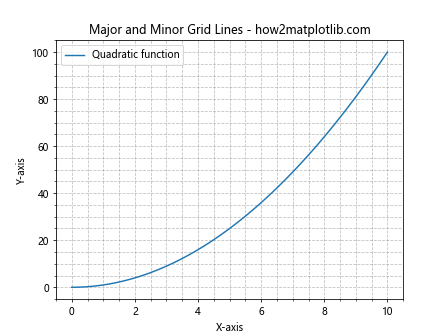
This example shows both major and minor grid lines. We’ve set which='both' to display both types of grid lines and used ax.minorticks_on() to enable minor ticks.
Matplotlib Grid in Subplots
When working with multiple subplots, you might want to apply grid settings to all or specific subplots. Let’s see how to do this:
Applying Grid to All Subplots
import matplotlib.pyplot as plt
import numpy as np

x = np.linspace(0, 10, 100)

fig, (ax1, ax2) = plt.subplots(2, 1, figsize=(8, 8))
fig.suptitle('Grid in Multiple Subplots - how2matplotlib.com')

ax1.plot(x, np.sin(x))
ax1.set_title('Sine Wave')
ax1.set_ylabel('Amplitude')

ax2.plot(x, np.cos(x))
ax2.set_title('Cosine Wave')
ax2.set_xlabel('X-axis')
ax2.set_ylabel('Amplitude')

for ax in (ax1, ax2):
    ax.grid(True, linestyle=':', color='blue', alpha=0.6)

plt.tight_layout()
plt.show()
Output:
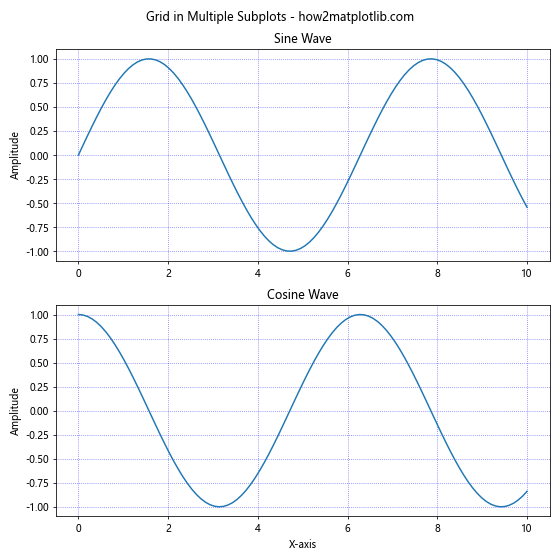
In this example, we’ve created two subplots and applied the same grid settings to both using a loop.
Customizing Grid for Individual Subplots
You can also apply different grid settings to each subplot:
import matplotlib.pyplot as plt
import numpy as np

x = np.linspace(0, 10, 100)

fig, (ax1, ax2) = plt.subplots(1, 2, figsize=(12, 5))
fig.suptitle('Custom Grid for Each Subplot - how2matplotlib.com')

ax1.plot(x, x**2)
ax1.set_title('Quadratic Function')
ax1.set_xlabel('X-axis')
ax1.set_ylabel('Y-axis')
ax1.grid(True, linestyle='-', color='red', alpha=0.3)

ax2.plot(x, np.sqrt(x))
ax2.set_title('Square Root Function')
ax2.set_xlabel('X-axis')
ax2.set_ylabel('Y-axis')
ax2.grid(True, linestyle='--', color='green', alpha=0.5)

plt.tight_layout()
plt.show()
Output:
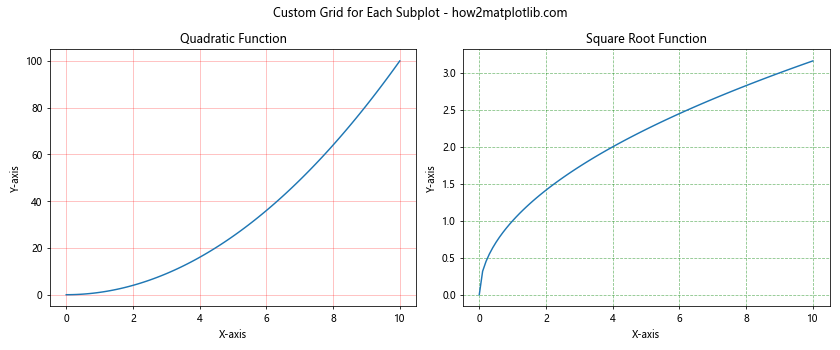
Here, we’ve applied different grid styles and colors to each subplot.
Advanced Matplotlib Grid Techniques
Now that we’ve covered the basics, let’s explore some advanced techniques for using matplotlib grid effectively:
Combining Major and Minor Grids with Different Styles
You can create a more detailed grid by combining major and minor grid lines with different styles:
import matplotlib.pyplot as plt
import numpy as np

x = np.linspace(0, 10, 100)
y = np.tan(x)

fig, ax = plt.subplots(figsize=(10, 6))
ax.plot(x, y, label='Tangent function')
ax.set_title('Advanced Grid Styling - how2matplotlib.com')
ax.set_xlabel('X-axis')
ax.set_ylabel('Y-axis')

ax.grid(which='major', color='#666666', linestyle='-')
ax.grid(which='minor', color='#999999', linestyle=':', alpha=0.2)
ax.minorticks_on()

ax.set_ylim(-10, 10)
ax.legend()
plt.show()
Output:
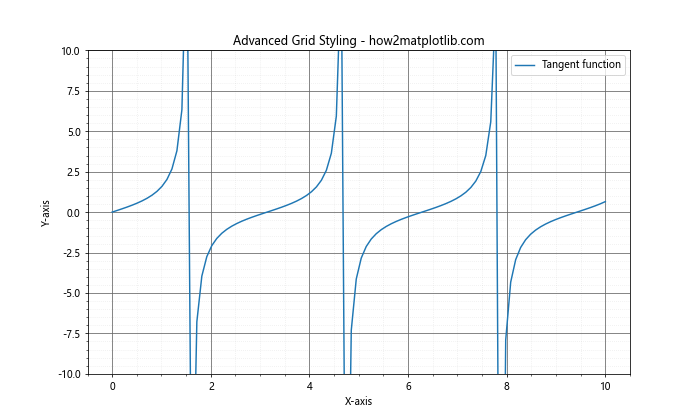
In this example, we’ve used different colors and styles for major and minor grid lines, creating a more detailed and visually appealing grid.
Creating a Polar Grid
Matplotlib grid can also be applied to polar plots:
import matplotlib.pyplot as plt
import numpy as np

r = np.arange(0, 2, 0.01)
theta = 2 * np.pi * r

fig, ax = plt.subplots(subplot_kw=dict(projection='polar'))
ax.plot(theta, r)
ax.set_title('Polar Plot with Grid - how2matplotlib.com')
ax.grid(True)
plt.show()
Output:
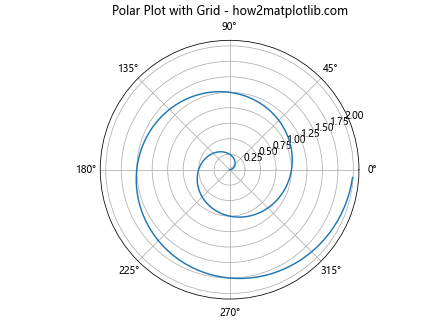
This example demonstrates how to create a polar plot with a radial grid.
Using Matplotlib Grid with Logarithmic Scales
When working with logarithmic scales, you might want to adjust your grid accordingly:
import matplotlib.pyplot as plt
import numpy as np

x = np.logspace(0, 5, 100)
y = x**2

fig, ax = plt.subplots()
ax.loglog(x, y, label='y = x^2')
ax.set_title('Logarithmic Plot with Grid - how2matplotlib.com')
ax.set_xlabel('X-axis (log scale)')
ax.set_ylabel('Y-axis (log scale)')
ax.grid(True, which="both", ls="-", alpha=0.5)
ax.legend()
plt.show()
Output:
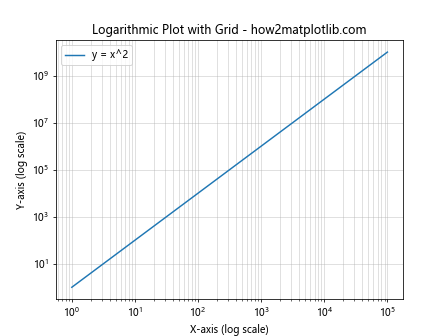
This example shows how to create a log-log plot with an appropriate grid.
Matplotlib Grid in 3D Plots
Matplotlib grid can also be applied to 3D plots, adding depth and clarity to your visualizations:
import matplotlib.pyplot as plt
import numpy as np
from mpl_toolkits.mplot3d import Axes3D

fig = plt.figure(figsize=(10, 7))
ax = fig.add_subplot(111, projection='3d')

x = np.arange(-5, 5, 0.25)
y = np.arange(-5, 5, 0.25)
X, Y = np.meshgrid(x, y)
Z = np.sin(np.sqrt(X**2 + Y**2))

surf = ax.plot_surface(X, Y, Z, cmap='viridis')
ax.set_title('3D Surface Plot with Grid - how2matplotlib.com')
ax.set_xlabel('X-axis')
ax.set_ylabel('Y-axis')
ax.set_zlabel('Z-axis')

ax.grid(True)
fig.colorbar(surf, shrink=0.5, aspect=5)
plt.show()
Output:
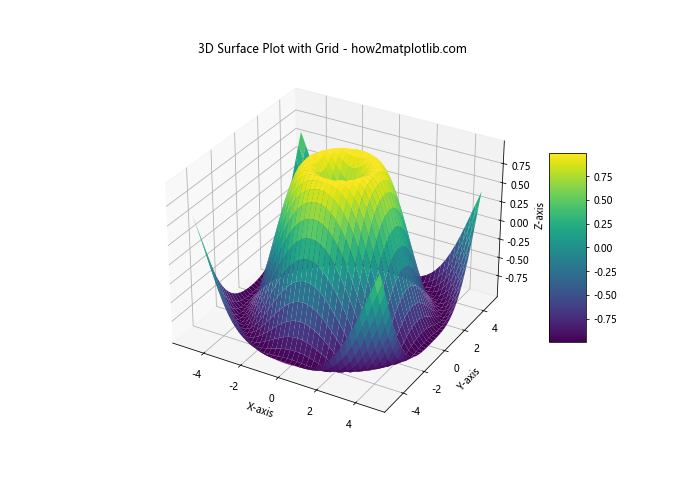
This example demonstrates how to add a grid to a 3D surface plot, enhancing the perception of depth and scale.
Customizing Matplotlib Grid for Specific Plot Types
Different types of plots may benefit from specific grid configurations. Let’s explore some examples:
Bar Plot with Custom Grid
For bar plots, you might want to emphasize the y-axis grid:
import matplotlib.pyplot as plt
import numpy as np

categories = ['A', 'B', 'C', 'D', 'E']
values = np.random.randint(1, 100, 5)

fig, ax = plt.subplots(figsize=(10, 6))
ax.bar(categories, values)
ax.set_title('Bar Plot with Custom Y-axis Grid - how2matplotlib.com')
ax.set_xlabel('Categories')
ax.set_ylabel('Values')

ax.grid(axis='y', linestyle='--', alpha=0.7)
plt.show()
Output:
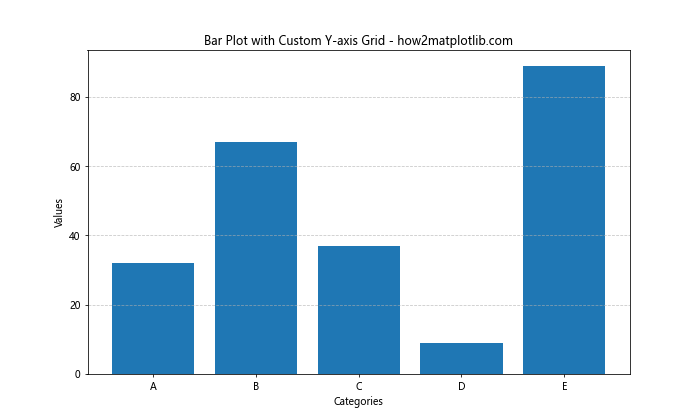
In this example, we’ve added a grid only to the y-axis, which helps in reading the values of each bar.
Scatter Plot with Grid
For scatter plots, a grid can help in identifying clusters and trends:
import matplotlib.pyplot as plt
import numpy as np

np.random.seed(42)
x = np.random.rand(50)
y = np.random.rand(50)
colors = np.random.rand(50)
sizes = 1000 * np.random.rand(50)

fig, ax = plt.subplots(figsize=(10, 8))
scatter = ax.scatter(x, y, c=colors, s=sizes, alpha=0.5)
ax.set_title('Scatter Plot with Grid - how2matplotlib.com')
ax.set_xlabel('X-axis')
ax.set_ylabel('Y-axis')

ax.grid(True, linestyle=':', color='gray', alpha=0.5)
fig.colorbar(scatter)
plt.show()
Output:
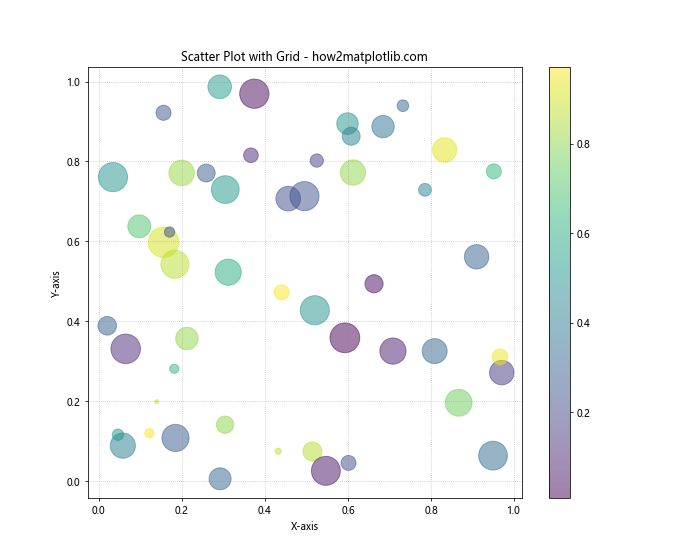
This scatter plot example uses a light grid to help viewers estimate the position of points without obscuring the data.
Matplotlib Grid in Heatmaps
Heatmaps can benefit from a grid to clearly delineate cells:
import matplotlib.pyplot as plt
import numpy as np

data = np.random.rand(10, 10)
fig, ax = plt.subplots(figsize=(10, 8))
im = ax.imshow(data, cmap='viridis')

ax.set_title('Heatmap with Grid - how2matplotlib.com')
ax.set_xticks(np.arange(data.shape[1]))
ax.set_yticks(np.arange(data.shape[0]))
ax.set_xticklabels([f'X{i+1}' for i in range(data.shape[1])])
ax.set_yticklabels([f'Y{i+1}' for i in range(data.shape[0])])

plt.setp(ax.get_xticklabels(), rotation=45, ha="right", rotation_mode="anchor")

for i in range(data.shape[0]):
    for j in range(data.shape[1]):
        ax.text(j, i, f"{data[i, j]:.2f}", ha="center", va="center", color="w")

ax.grid(which="minor", color="w", linestyle='-', linewidth=3)
ax.tick_params(which="minor", bottom=False, left=False)

fig.colorbar(im)
plt.tight_layout()
plt.show()
Output:
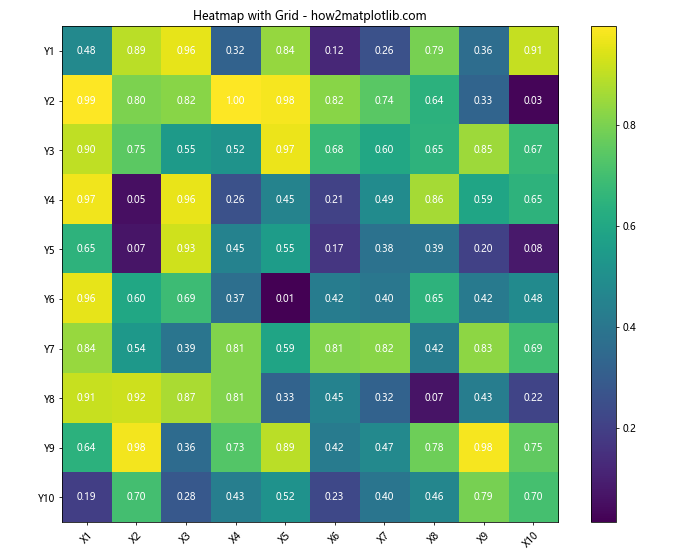
This heatmap example uses a white grid to clearly separate each cell, making it easier to read individual values.
Best Practices for Using Matplotlib Grid
When working with matplotlib grid, keep these best practices in mind:
- Use grids sparingly: While grids can enhance readability, too many grid lines can clutter your plot.
- Adjust opacity: Lower the opacity of grid lines to make them less prominent but still useful.
- Choose appropriate colors: Select grid colors that complement your data and don’t clash with your plot elements.
- Customize for plot type: Different types of plots may benefit from different grid configurations.
- Consider your audience: Adjust grid density and style based on who will be viewing your plots.
Let’s explore some examples that demonstrate these best practices:
Minimalist Grid for Line Plots
import matplotlib.pyplot as plt
import numpy as np

x = np.linspace(0, 10, 100)
y1 = np.sin(x)
y2 = np.cos(x)

fig, ax = plt.subplots(figsize=(10, 6))
ax.plot(x, y1, label='Sine')
ax.plot(x, y2, label='Cosine')
ax.set_title('Minimalist Grid for Line Plots - how2matplotlib.com')
ax.set_xlabel('X-axis')
ax.set_ylabel('Y-axis')

ax.grid(True, linestyle=':', color='gray', alpha=0.3)
ax.legend()
plt.show()
Output:
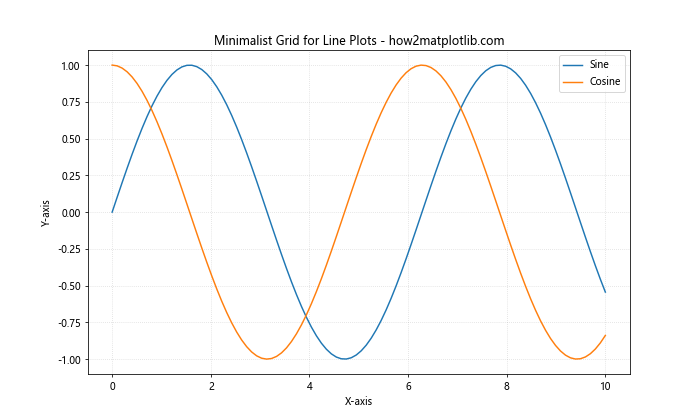
This example uses a light, dotted grid that provides reference lines without overwhelming the data.
Emphasizing Data Ranges with Grid
import matplotlib.pyplot as plt
import numpy as np

np.random.seed(42)
data = np.random.normal(0, 1, 1000)

fig, ax = plt.subplots(figsize=(10, 6))
ax.hist(data, bins=30, edgecolor='black')
ax.set_title('Histogram with Emphasized Grid - how2matplotlib.com')
ax.set_xlabel('Value')
ax.set_ylabel('Frequency')

ax.grid(True, axis='y', linestyle='--', color='gray', alpha=0.7)
ax.set_axisbelow(True)
plt.show()
Output:
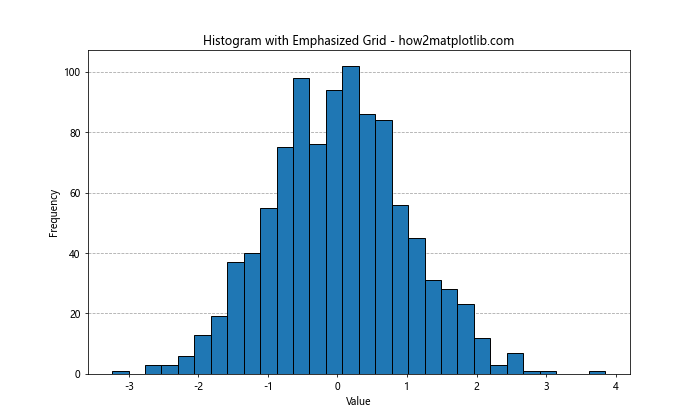
In this histogram, we’ve emphasized the y-axis grid to make it easier to read frequency values.
Troubleshooting Common Matplotlib Grid Issues
When working with matplotlib grid, you might encounter some common issues. Let’s address a few of them:
Grid Lines Not Showing
If your grid lines aren’t visible, make sure you’re calling plt.grid() or ax.grid() before plt.show(). Also, check if your grid color contrasts with your background:
import matplotlib.pyplot as plt
import numpy as np

x = np.linspace(0, 10, 100)
y = np.exp(-x/10) * np.cos(np.pi * x)

fig, ax = plt.subplots(figsize=(10, 6))
ax.plot(x, y)
ax.set_title('Ensuring Grid Visibility - how2matplotlib.com')
ax.set_xlabel('X-axis')
ax.set_ylabel('Y-axis')

ax.set_facecolor('#f0f0f0')  # Light gray background
ax.grid(True, color='white', linestyle='-', linewidth=1.5)
ax.grid(True, color='gray', linestyle=':', linewidth=0.5)

plt.show()
Output:
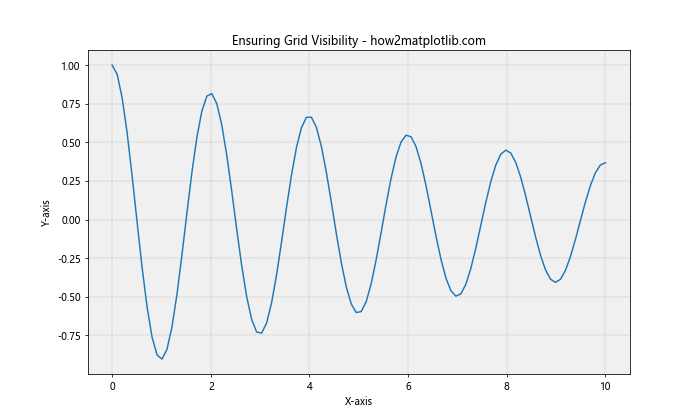
This example uses a double grid technique to ensure visibility against both light and dark backgrounds.
Grid Not Aligning with Ticks
If your grid doesn’t align with your ticks, you might need to adjust your locators:
import matplotlib.pyplot as plt
import numpy as np
from matplotlib.ticker import MultipleLocator

x = np.linspace(0, 10, 100)
y = np.sin(x) * np.exp(-x/10)

fig, ax = plt.subplots(figsize=(10, 6))
ax.plot(x, y)
ax.set_title('Aligning Grid with Ticks - how2matplotlib.com')
ax.set_xlabel('X-axis')
ax.set_ylabel('Y-axis')

ax.xaxis.set_major_locator(MultipleLocator(1))
ax.yaxis.set_major_locator(MultipleLocator(0.1))
ax.grid(True, which='both', linestyle='--', color='gray', alpha=0.5)

plt.show()
Output:
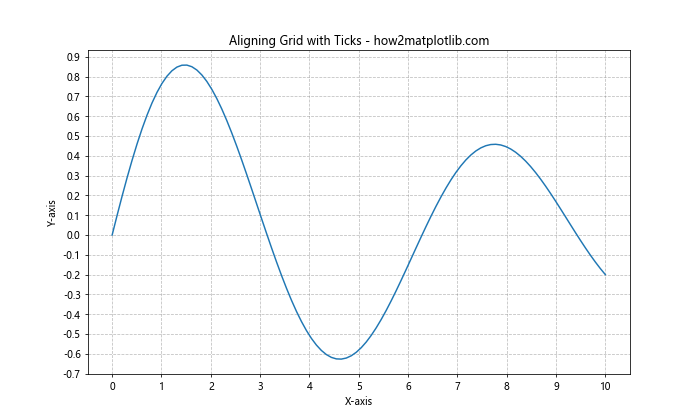
This example uses MultipleLocator to ensure that grid lines align perfectly with tick marks.
Advanced Matplotlib Grid Customization
For those looking to push the boundaries of matplotlib grid customization, here are some advanced techniques:
Creating a Custom Grid Pattern
You can create unique grid patterns by combining multiple grid calls:
import matplotlib.pyplot as plt
import numpy as np

x = np.linspace(0, 10, 100)
y = np.sin(x) * np.cos(x)

fig, ax = plt.subplots(figsize=(10, 6))
ax.plot(x, y)
ax.set_title('Custom Grid Pattern - how2matplotlib.com')
ax.set_xlabel('X-axis')
ax.set_ylabel('Y-axis')

# Vertical lines
ax.grid(True, axis='x', linestyle='-', color='blue', alpha=0.2)
# Horizontal lines
ax.grid(True, axis='y', linestyle=':', color='red', alpha=0.2)
# Additional vertical lines
ax.vlines(np.arange(0, 11, 2), ymin=ax.get_ylim()[0], ymax=ax.get_ylim()[1],
          colors='green', linestyles='--', alpha=0.3)

plt.show()
Output:
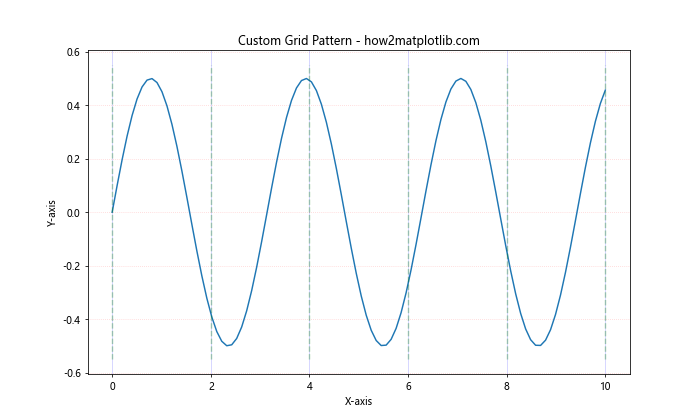
This example creates a unique grid pattern by combining different styles of vertical and horizontal lines.
Using Curved Grid Lines
For certain types of plots, curved grid lines might be more appropriate:
import matplotlib.pyplot as plt
import numpy as np

theta = np.linspace(0, 2*np.pi, 100)
r = 2 * np.cos(4*theta)

fig, ax = plt.subplots(figsize=(10, 10), subplot_kw=dict(projection='polar'))
ax.plot(theta, r)
ax.set_title('Polar Plot with Curved Grid - how2matplotlib.com')

ax.grid(True)
ax.set_rmax(2)
ax.set_rticks([0.5, 1, 1.5, 2])
ax.set_rlabel_position(-22.5)

plt.show()
Output:
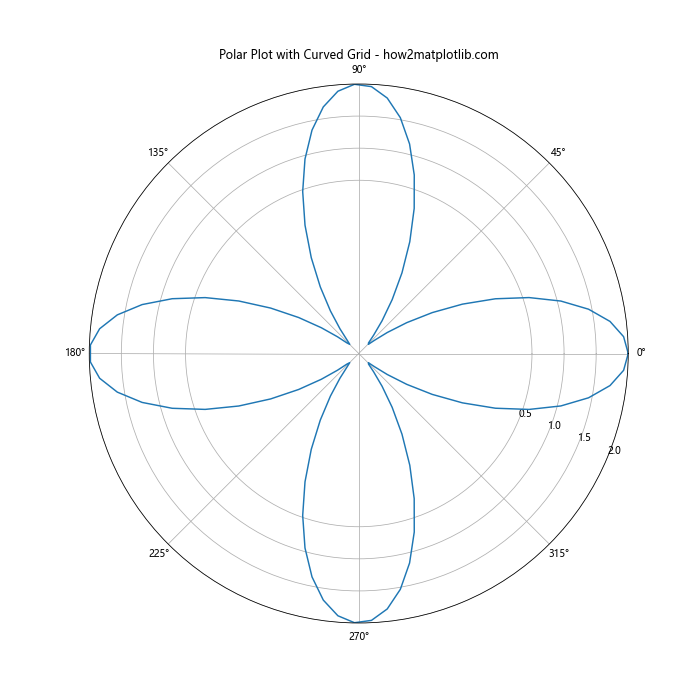
This polar plot example demonstrates how curved grid lines can be used effectively in certain visualizations.
Integrating Matplotlib Grid with Other Matplotlib Features
Matplotlib grid can be effectively combined with other matplotlib features to create more informative visualizations:
Combining Grid with Annotations
import matplotlib.pyplot as plt
import numpy as np

x = np.linspace(0, 10, 100)
y = np.sin(x)

fig, ax = plt.subplots(figsize=(10, 6))
ax.plot(x, y)
ax.set_title('Grid with Annotations - how2matplotlib.com')
ax.set_xlabel('X-axis')
ax.set_ylabel('Y-axis')

ax.grid(True, linestyle='--', alpha=0.7)
ax.annotate('Maximum', xy=(np.pi/2, 1), xytext=(np.pi/2, 1.2),
            arrowprops=dict(facecolor='black', shrink=0.05))
ax.annotate('Minimum', xy=(3*np.pi/2, -1), xytext=(3*np.pi/2, -1.2),
            arrowprops=dict(facecolor='black', shrink=0.05))

plt.show()
Output:
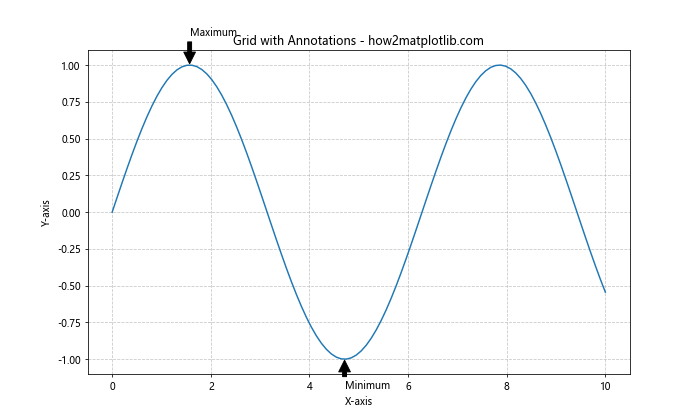
This example shows how grid lines can be combined with annotations to highlight specific points of interest.
Using Grid with Twin Axes
When working with plots that have different scales, you can use grid with twin axes:
import matplotlib.pyplot as plt
import numpy as np

x = np.linspace(0, 10, 100)
y1 = np.sin(x)
y2 = np.exp(x/10)

fig, ax1 = plt.subplots(figsize=(10, 6))
ax1.set_title('Grid with Twin Axes - how2matplotlib.com')
ax1.set_xlabel('X-axis')
ax1.set_ylabel('Sine', color='blue')
ax1.plot(x, y1, color='blue')
ax1.tick_params(axis='y', labelcolor='blue')

ax2 = ax1.twinx()
ax2.set_ylabel('Exponential', color='red')
ax2.plot(x, y2, color='red')
ax2.tick_params(axis='y', labelcolor='red')

ax1.grid(True, linestyle='-', alpha=0.7)
ax2.grid(True, linestyle=':', alpha=0.7)

plt.show()
Output:
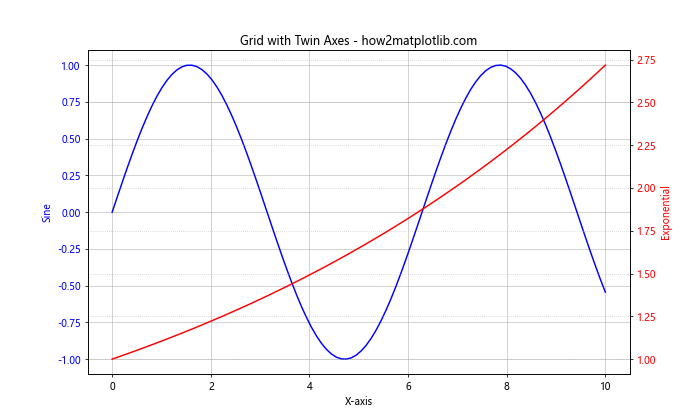
This example demonstrates how to use grid lines effectively with twin axes, helping to distinguish between two different scales.
Matplotlib grid Conclusion
Matplotlib grid is a powerful tool that can significantly enhance the readability and interpretability of your plots. From basic usage to advanced customization techniques, we’ve covered a wide range of topics to help you master matplotlib grid. Remember to use grid lines judiciously and always consider your data and audience when deciding on grid styles and density.
By following the examples and best practices outlined in this guide, you’ll be well-equipped to create clear, informative, and visually appealing plots using matplotlib grid. Whether you’re working on simple line plots or complex 3D visualizations, the right use of grid lines can make a significant difference in how your data is perceived and understood.