How to Master Matplotlib Grid Lines: A Comprehensive Guide
Matplotlib grid lines are an essential feature for creating clear and informative visualizations. Grid lines help to improve the readability of plots by providing reference points for data values. In this comprehensive guide, we’ll explore various aspects of matplotlib grid lines, from basic usage to advanced customization techniques. By the end of this article, you’ll have a thorough understanding of how to effectively use grid lines in your matplotlib plots.
Understanding the Basics of Matplotlib Grid Lines
Matplotlib grid lines are horizontal and vertical lines that divide the plot area into smaller sections. These lines serve as visual aids, making it easier for viewers to estimate data values and compare different points on the plot. By default, matplotlib doesn’t display grid lines, but they can be easily added to enhance the clarity of your visualizations.
Let’s start with a simple example of how to add grid lines to a basic plot:
import matplotlib.pyplot as plt
import numpy as np

x = np.linspace(0, 10, 100)
y = np.sin(x)

plt.plot(x, y)
plt.title('Sine Wave with Grid Lines - how2matplotlib.com')
plt.xlabel('X-axis')
plt.ylabel('Y-axis')
plt.grid(True)
plt.show()
Output:
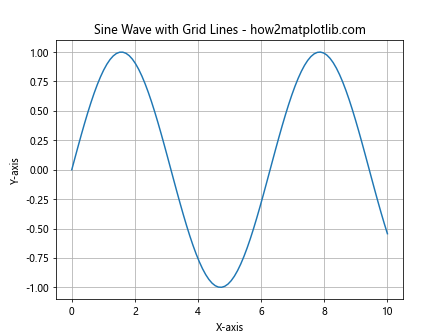
In this example, we create a simple sine wave plot and add grid lines using the plt.grid(True) function. This adds both horizontal and vertical grid lines to the plot, making it easier to read the values along both axes.
Customizing Matplotlib Grid Lines
While the default grid lines are useful, matplotlib offers numerous options for customizing their appearance. You can adjust properties such as line style, color, and thickness to match your visualization needs.
Here’s an example of how to customize the grid lines:
import matplotlib.pyplot as plt
import numpy as np

x = np.linspace(0, 10, 100)
y = np.cos(x)

plt.plot(x, y)
plt.title('Cosine Wave with Custom Grid Lines - how2matplotlib.com')
plt.xlabel('X-axis')
plt.ylabel('Y-axis')
plt.grid(True, linestyle='--', color='gray', alpha=0.7)
plt.show()
Output:
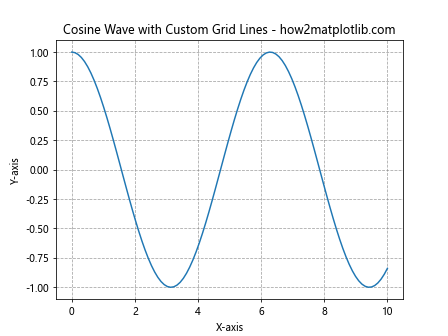
In this example, we’ve customized the grid lines to be dashed (linestyle='--'), gray in color (color='gray'), and slightly transparent (alpha=0.7). These modifications can help the grid lines blend better with the plot while still providing clear reference points.
Adding Major and Minor Grid Lines
Matplotlib allows you to add both major and minor grid lines to your plots. Major grid lines correspond to the major tick marks on the axes, while minor grid lines provide additional subdivisions between the major lines.
Here’s how you can add both major and minor grid lines:
import matplotlib.pyplot as plt
import numpy as np

x = np.linspace(0, 5, 100)
y = x ** 2

plt.plot(x, y)
plt.title('Quadratic Function with Major and Minor Grid Lines - how2matplotlib.com')
plt.xlabel('X-axis')
plt.ylabel('Y-axis')
plt.grid(True, which='major', linestyle='-', color='black', alpha=0.5)
plt.grid(True, which='minor', linestyle=':', color='gray', alpha=0.3)
plt.minorticks_on()
plt.show()
Output:
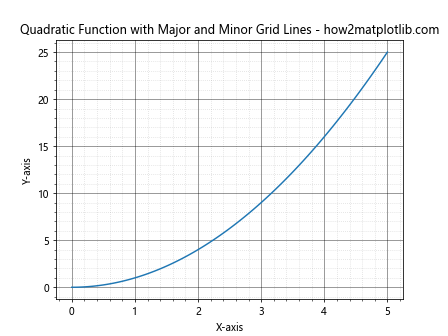
In this example, we’ve added both major and minor grid lines. The major grid lines are solid black lines with 50% opacity, while the minor grid lines are dotted gray lines with 30% opacity. The plt.minorticks_on() function is used to display minor tick marks, which correspond to the minor grid lines.
Controlling Grid Lines for Specific Axes
Sometimes you may want to display grid lines for only one axis or customize the grid lines differently for each axis. Matplotlib provides methods to control grid lines for specific axes.
Here’s an example of how to add grid lines only to the y-axis:
import matplotlib.pyplot as plt
import numpy as np

x = np.linspace(0, 10, 100)
y = np.exp(x)

plt.plot(x, y)
plt.title('Exponential Function with Y-axis Grid Lines - how2matplotlib.com')
plt.xlabel('X-axis')
plt.ylabel('Y-axis')
plt.gca().yaxis.grid(True)
plt.show()
Output:
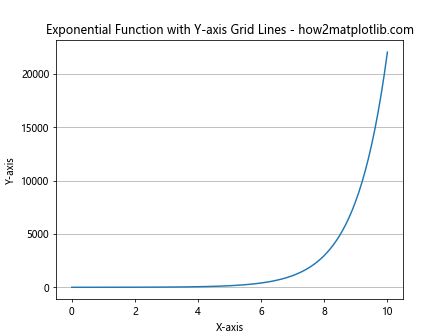
In this example, we use plt.gca().yaxis.grid(True) to add grid lines only to the y-axis. This can be useful when you want to emphasize vertical alignment in your plot.
Using Matplotlib Grid Lines in Subplots
When working with multiple subplots, you may want to control grid lines for each subplot individually. Matplotlib allows you to customize grid lines for each subplot separately.
Here’s an example of how to add different grid lines to multiple subplots:
import matplotlib.pyplot as plt
import numpy as np

x = np.linspace(0, 10, 100)
y1 = np.sin(x)
y2 = np.cos(x)

fig, (ax1, ax2) = plt.subplots(2, 1, figsize=(8, 8))

ax1.plot(x, y1)
ax1.set_title('Sine Wave - how2matplotlib.com')
ax1.grid(True, linestyle='-', color='blue', alpha=0.3)

ax2.plot(x, y2)
ax2.set_title('Cosine Wave - how2matplotlib.com')
ax2.grid(True, linestyle='--', color='red', alpha=0.3)

plt.tight_layout()
plt.show()
Output:
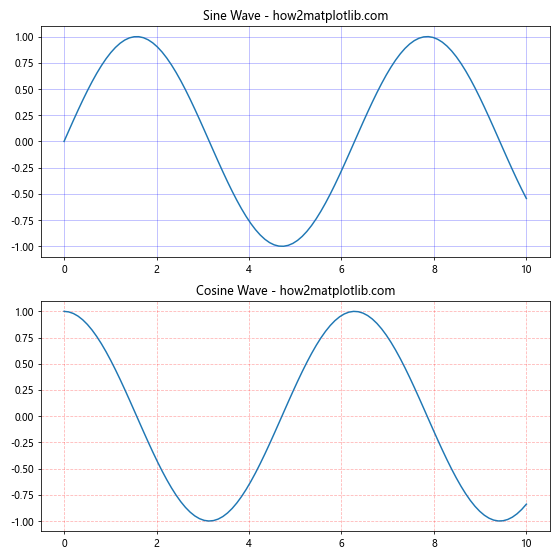
In this example, we create two subplots with different grid line styles. The top subplot has solid blue grid lines, while the bottom subplot has dashed red grid lines.
Adjusting Grid Line Spacing
By default, matplotlib places grid lines at major tick locations. However, you can adjust the spacing of grid lines to better suit your data visualization needs.
Here’s an example of how to customize grid line spacing:
import matplotlib.pyplot as plt
import numpy as np

x = np.linspace(0, 20, 200)
y = np.sin(x) * np.exp(-0.1 * x)

plt.plot(x, y)
plt.title('Damped Sine Wave with Custom Grid Spacing - how2matplotlib.com')
plt.xlabel('X-axis')
plt.ylabel('Y-axis')
plt.grid(True)
plt.xticks(np.arange(0, 21, 2))
plt.yticks(np.arange(-1, 1.1, 0.2))
plt.show()
Output:
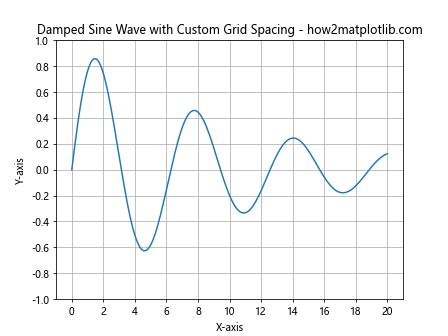
In this example, we use plt.xticks() and plt.yticks() to set custom tick locations. The grid lines will automatically align with these custom tick marks, allowing you to control the spacing of the grid.
Creating Polar Plots with Grid Lines
Matplotlib grid lines are not limited to Cartesian plots. You can also add grid lines to polar plots, which can be particularly useful for visualizing circular or periodic data.
Here’s an example of how to create a polar plot with grid lines:
import matplotlib.pyplot as plt
import numpy as np

theta = np.linspace(0, 2*np.pi, 100)
r = np.cos(4*theta)

plt.polar(theta, r)
plt.title('Polar Plot with Grid Lines - how2matplotlib.com')
plt.grid(True)
plt.show()
Output:
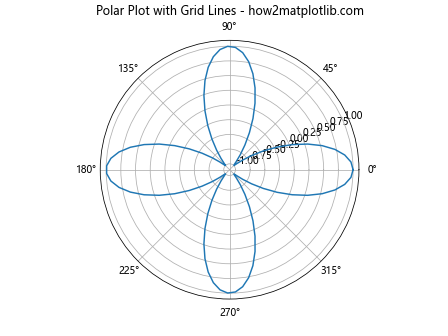
In this example, we create a polar plot using plt.polar() and add grid lines with plt.grid(True). The resulting plot will have both radial and angular grid lines, making it easier to read values in polar coordinates.
Using Matplotlib Grid Lines with Logarithmic Scales
When working with data that spans multiple orders of magnitude, logarithmic scales can be useful. Matplotlib grid lines can be adapted to work with logarithmic scales, providing clear reference points across different orders of magnitude.
Here’s an example of how to use grid lines with logarithmic scales:
import matplotlib.pyplot as plt
import numpy as np

x = np.logspace(0, 5, 100)
y = x ** 2

plt.loglog(x, y)
plt.title('Log-Log Plot with Grid Lines - how2matplotlib.com')
plt.xlabel('X-axis (log scale)')
plt.ylabel('Y-axis (log scale)')
plt.grid(True, which='both', linestyle='--', color='gray', alpha=0.7)
plt.show()
Output:
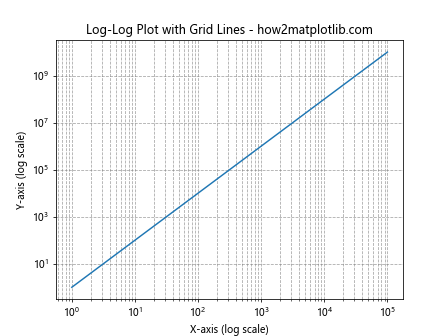
In this example, we create a log-log plot using plt.loglog() and add grid lines that correspond to both major and minor tick marks on the logarithmic scales.
Customizing Grid Line Appearance with Matplotlib Styles
Matplotlib provides various built-in styles that can affect the appearance of grid lines along with other plot elements. You can use these styles to quickly change the overall look of your plots, including the grid lines.
Here’s an example of how to use a built-in style that affects grid lines:
import matplotlib.pyplot as plt
import numpy as np

plt.style.use('ggplot')

x = np.linspace(0, 10, 100)
y = np.sin(x) * np.exp(-0.1 * x)

plt.plot(x, y)
plt.title('Plot with ggplot Style - how2matplotlib.com')
plt.xlabel('X-axis')
plt.ylabel('Y-axis')
plt.grid(True)
plt.show()
Output:
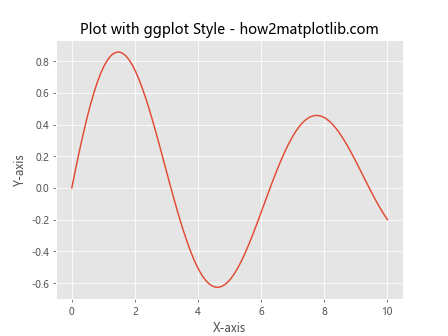
In this example, we use the ‘ggplot’ style, which changes the overall appearance of the plot, including the grid lines. This can be a quick way to achieve a consistent look across multiple plots.
Using Matplotlib Grid Lines in 3D Plots
Matplotlib’s grid lines functionality extends to 3D plots as well. Adding grid lines to 3D plots can significantly improve the readability of the visualization by providing reference planes.
Here’s an example of how to add grid lines to a 3D plot:
import matplotlib.pyplot as plt
import numpy as np
from mpl_toolkits.mplot3d import Axes3D

fig = plt.figure()
ax = fig.add_subplot(111, projection='3d')

x = np.linspace(-5, 5, 100)
y = np.linspace(-5, 5, 100)
X, Y = np.meshgrid(x, y)
Z = np.sin(np.sqrt(X**2 + Y**2))

ax.plot_surface(X, Y, Z, cmap='viridis')
ax.set_title('3D Surface Plot with Grid Lines - how2matplotlib.com')
ax.set_xlabel('X-axis')
ax.set_ylabel('Y-axis')
ax.set_zlabel('Z-axis')
ax.grid(True)
plt.show()
Output:
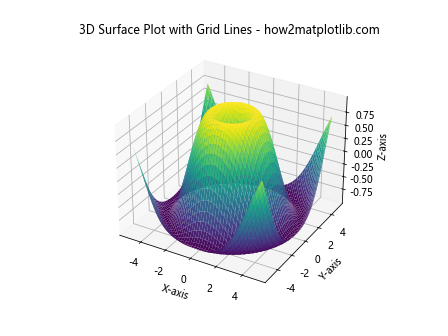
In this example, we create a 3D surface plot and add grid lines using ax.grid(True). The grid lines appear on all three planes of the 3D plot, helping to provide spatial reference for the surface.
Combining Matplotlib Grid Lines with Other Plot Elements
Grid lines can be effectively combined with other plot elements to create more informative visualizations. For example, you can use grid lines in combination with error bars, filled regions, or multiple data series.
Here’s an example of how to combine grid lines with error bars:
import matplotlib.pyplot as plt
import numpy as np

x = np.linspace(0, 10, 10)
y = np.sin(x)
error = 0.1 + 0.2 * np.random.random(len(x))

plt.errorbar(x, y, yerr=error, fmt='o', capsize=5)
plt.title('Error Bar Plot with Grid Lines - how2matplotlib.com')
plt.xlabel('X-axis')
plt.ylabel('Y-axis')
plt.grid(True, linestyle='--', alpha=0.7)
plt.show()
Output:
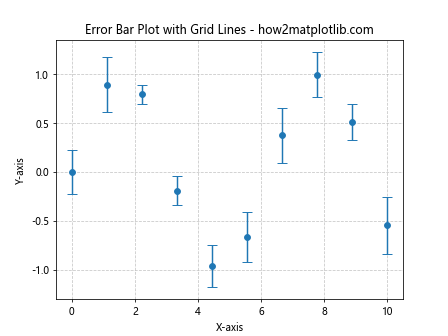
In this example, we create an error bar plot and add dashed grid lines with 70% opacity. The combination of error bars and grid lines provides a clear view of both the data points and their associated uncertainties.
Using Matplotlib Grid Lines in Heatmaps
Grid lines can be particularly useful in heatmaps to delineate individual cells. Matplotlib allows you to add grid lines to heatmaps to improve their readability.
Here’s an example of how to add grid lines to a heatmap:
import matplotlib.pyplot as plt
import numpy as np

data = np.random.rand(10, 10)

plt.imshow(data, cmap='viridis')
plt.title('Heatmap with Grid Lines - how2matplotlib.com')
plt.colorbar()
plt.grid(True, color='white', linestyle='-', linewidth=0.5)
plt.xticks(np.arange(-.5, 10, 1), [])
plt.yticks(np.arange(-.5, 10, 1), [])
plt.show()
Output:
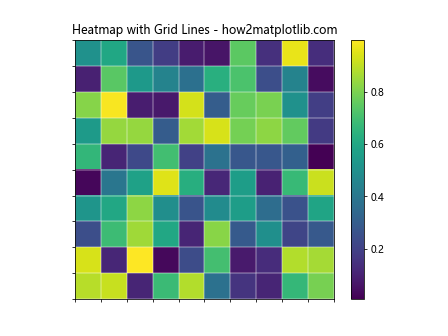
In this example, we create a heatmap using plt.imshow() and add white grid lines to separate the cells. The plt.xticks() and plt.yticks() functions are used to align the grid lines with the cell boundaries.
Customizing Matplotlib Grid Lines for Specific Data Ranges
Sometimes you may want to highlight specific ranges of your data by customizing the grid lines within those ranges. Matplotlib allows you to add custom grid lines at specific positions.
Here’s an example of how to add custom grid lines for specific data ranges:
import matplotlib.pyplot as plt
import numpy as np

x = np.linspace(0, 10, 100)
y = np.sin(x)

plt.plot(x, y)
plt.title('Sine Wave with Custom Grid Lines - how2matplotlib.com')
plt.xlabel('X-axis')
plt.ylabel('Y-axis')
plt.grid(True, linestyle='--', alpha=0.5)

# Add custom vertical grid lines
for i in range(1, 10, 2):
    plt.axvline(x=i, color='red', linestyle=':', alpha=0.5)

# Add custom horizontal grid lines
for i in np.arange(-1, 1.1, 0.5):
    plt.axhline(y=i, color='green', linestyle=':', alpha=0.5)

plt.show()
Output:
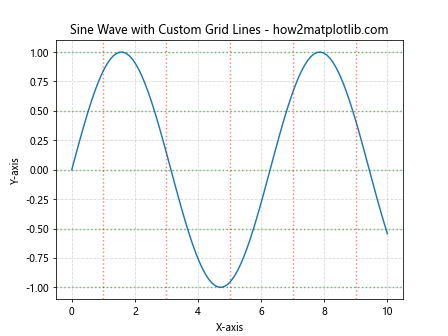
In this example, we add custom vertical grid lines at odd x-values and custom horizontal grid lines at specific y-values. This can be useful for highlighting particular regions or values in your plot.
Using Matplotlib Grid Lines in Categorical Plots
Grid lines can also be useful in categorical plots, such as bar charts or box plots. They can help in comparing values across different categories.
Here’s an example of how to add grid lines to a bar chart:
import matplotlib.pyplot as plt
import numpy as np

categories = ['A', 'B', 'C', 'D', 'E']
values = np.random.randint(1, 100, size=5)

plt.bar(categories, values)
plt.title('Bar Chart with Grid Lines - how2matplotlib.com')
plt.xlabel('Categories')
plt.ylabel('Values')
plt.grid(True, axis='y', linestyle='--', alpha=0.7)
plt.show()
Output:
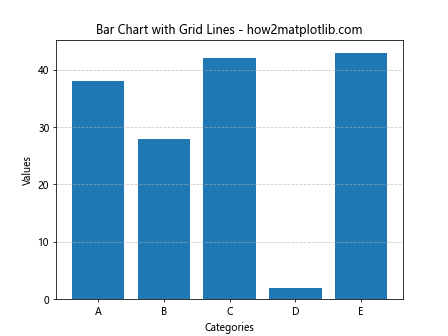
In this example, we create a bar chart and add horizontal grid lines. This can help in comparing the heights of different bars more accurately.
Adjusting Matplotlib Grid Lines for Different Plot Sizes
When creating plots of different sizes, you may need to adjust the grid line properties to ensure they remain visible and effective. Matplotlib allows you to scale grid line properties based on the figure size.
Here’s an example of how to adjust grid lines for different plot sizes:
import matplotlib.pyplot as plt
import numpy as np

x = np.linspace(0, 10, 100)
y = np.sin(x)

fig, (ax1, ax2) = plt.subplots(1, 2, figsize=(12, 4))

ax1.plot(x, y)
ax1.set_title('Small Plot - how2matplotlib.com')
ax1.grid(True, linewidth=0.5, alpha=0.7)

ax2.plot(x, y)
ax2.set_title('Large Plot - how2matplotlib.com')
ax2.grid(True, linewidth=1, alpha=0.7)

plt.tight_layout()
plt.show()
Output:
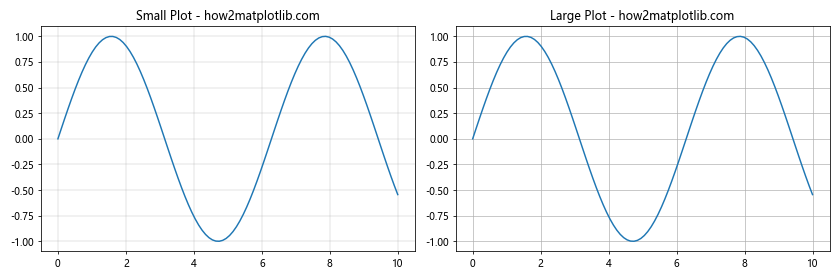
In this example, we create two subplots of different sizes and adjust the grid line width accordingly. The smaller plot uses thinner grid lines, while the larger plot uses thicker grid lines to maintain visibility.
Combining Matplotlib Grid Lines with Annotations
Grid lines can be effectively combined with annotations to create more informative plots. Annotations can be used to highlight specific points or regions of interest, while grid lines provide overall context.
Here’s an example of how to combine grid lines with annotations:
import matplotlib.pyplot as plt
import numpy as np

x = np.linspace(0, 10, 100)
y = np.sin(x)

plt.figure(figsize=(10, 6))
plt.plot(x, y)
plt.title('Sine Wave with Grid Lines and Annotations - how2matplotlib.com')
plt.xlabel('X-axis')
plt.ylabel('Y-axis')
plt.grid(True, linestyle='--', alpha=0.7)

plt.annotate('Peak', xy=(np.pi/2, 1), xytext=(np.pi/2, 1.2),
             arrowprops=dict(facecolor='black', shrink=0.05))
plt.annotate('Trough', xy=(3*np.pi/2, -1), xytext=(3*np.pi/2, -1.2),
             arrowprops=dict(facecolor='black', shrink=0.05))

plt.show()
Output:
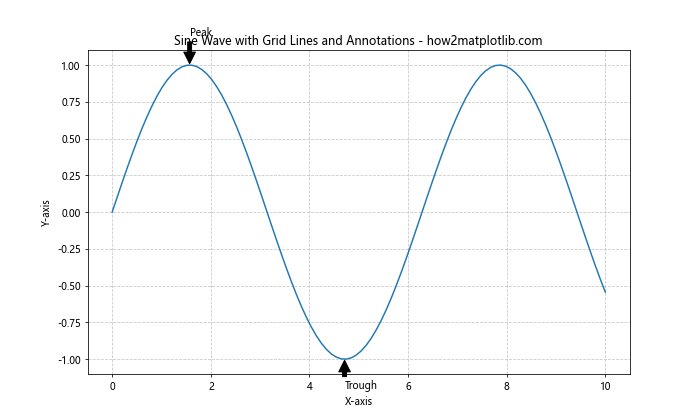
In this example, we create a sine wave plot with grid lines and add annotations to highlight the peak and trough of the wave. The grid lines provide a reference for the overall shape of the wave, while the annotations draw attention to specific points of interest.
Using Matplotlib Grid Lines in Polar Histograms
Grid lines can be particularly useful in polar histograms, also known as rose plots. These plots are used to visualize the distribution of a variable in a circular format, and grid lines can help in reading the values more accurately.
Here’s an example of how to create a polar histogram with grid lines:
import matplotlib.pyplot as plt
import numpy as np

angles = np.random.uniform(0, 2*np.pi, 1000)
plt.figure(figsize=(8, 8))
plt.subplot(111, projection='polar')
plt.hist(angles, bins=16, bottom=0)
plt.title('Polar Histogram with Grid Lines - how2matplotlib.com')
plt.grid(True)
plt.show()
Output:
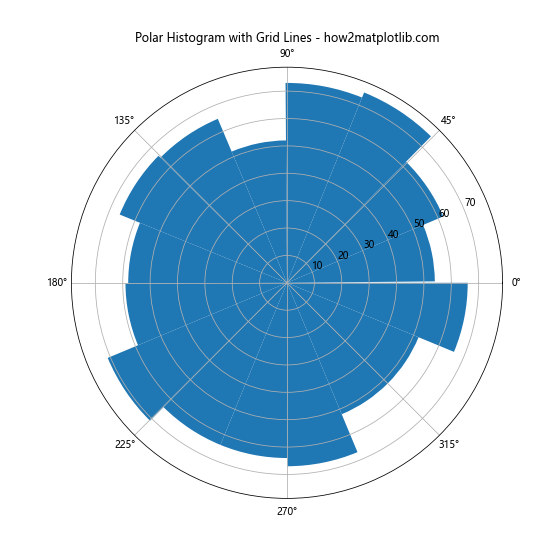
In this example, we create a polar histogram of randomly generated angles and add grid lines. The radial grid lines help in reading the frequency values, while the angular grid lines help in identifying the angle ranges.
Customizing Matplotlib Grid Lines for Different Plot Types
Different types of plots may benefit from different grid line configurations. Matplotlib allows you to customize grid lines based on the specific requirements of each plot type.
Here’s an example of how to customize grid lines for different plot types:
import matplotlib.pyplot as plt
import numpy as np

fig, (ax1, ax2) = plt.subplots(1, 2, figsize=(12, 5))

# Scatter plot with grid lines
x = np.random.rand(50)
y = np.random.rand(50)
ax1.scatter(x, y)
ax1.set_title('Scatter Plot - how2matplotlib.com')
ax1.grid(True, linestyle='--', alpha=0.7)

# Step plot with grid lines
x = np.arange(10)
y = np.random.randint(0, 10, 10)
ax2.step(x, y, where='mid')
ax2.set_title('Step Plot - how2matplotlib.com')
ax2.grid(True, axis='y', linestyle='-', alpha=0.7)

plt.tight_layout()
plt.show()
Output:
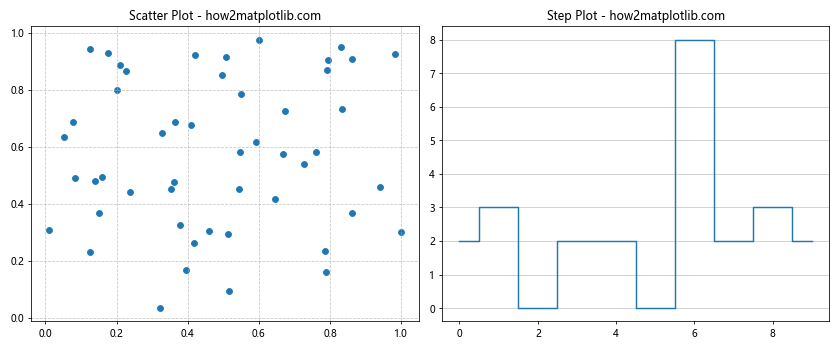
In this example, we create two different types of plots: a scatter plot and a step plot. For the scatter plot, we use dashed grid lines on both axes to provide a reference grid. For the step plot, we use solid grid lines only on the y-axis to emphasize the discrete steps.
Matplotlib grid lines Conclusion
Matplotlib grid lines are a powerful tool for enhancing the readability and interpretability of your plots. From basic usage to advanced customization techniques, grid lines can be adapted to suit a wide range of visualization needs. By mastering the use of matplotlib grid lines, you can create more informative and visually appealing plots that effectively communicate your data insights.
Remember to experiment with different grid line styles, colors, and configurations to find the best approach for your specific data and visualization goals. With the techniques covered in this comprehensive guide, you’re now well-equipped to leverage matplotlib grid lines to their full potential in your data visualization projects.
Whether you’re working with simple line plots, complex 3D visualizations, or specialized chart types, matplotlib grid lines can help you create clear, professional-looking plots that effectively convey your data stories. Keep practicing and exploring new ways to use grid lines in your matplotlib plots, and you’ll continue to improve your data visualization skills.