How to Master Matplotlib Axhline: A Comprehensive Guide for Data Visualization
Matplotlib axhline is a powerful tool for adding horizontal lines to your plots in Python. This article will provide an in-depth exploration of the matplotlib axhline function, its various uses, and how to leverage it effectively in your data visualization projects. We’ll cover everything from basic usage to advanced techniques, ensuring you have a thorough understanding of this essential matplotlib feature.
Matplotlib axhline Recommended Articles
- matplotlib axhline dashed
- matplotlib axhline label
- matplotlib axhline linestyles
- matplotlib axhline text
Understanding the Basics of Matplotlib Axhline
Matplotlib axhline is a function that allows you to add horizontal lines to your plots. These lines can span the entire width of the plot or be limited to specific x-axis ranges. The axhline function is particularly useful for highlighting specific y-values, such as averages, thresholds, or reference points in your data.
Let’s start with a simple example to demonstrate the basic usage of matplotlib axhline:
import matplotlib.pyplot as plt

plt.figure(figsize=(8, 6))
plt.axhline(y=0.5, color='r', linestyle='--')
plt.title('Basic Matplotlib Axhline Example - how2matplotlib.com')
plt.xlabel('X-axis')
plt.ylabel('Y-axis')
plt.text(0.5, 0.6, 'Horizontal line at y=0.5', horizontalalignment='center')
plt.show()
Output:
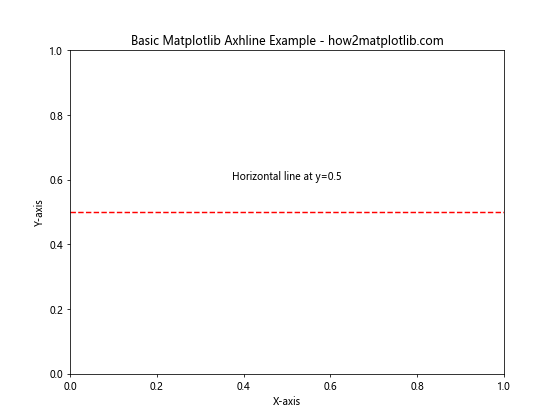
In this example, we use matplotlib axhline to draw a horizontal red dashed line at y=0.5. The axhline function is called with the y-coordinate as its first argument, followed by optional parameters for color and line style.
Customizing Matplotlib Axhline Appearance
One of the strengths of matplotlib axhline is its flexibility in terms of customization. You can adjust various properties of the line to suit your visualization needs. Let’s explore some of these customization options:
Line Color and Style
You can easily change the color and style of the matplotlib axhline:
import matplotlib.pyplot as plt

plt.figure(figsize=(10, 6))
plt.axhline(y=0.3, color='blue', linestyle='-', linewidth=2)
plt.axhline(y=0.6, color='green', linestyle='--', linewidth=1.5)
plt.axhline(y=0.9, color='red', linestyle=':', linewidth=3)
plt.title('Customized Matplotlib Axhline Styles - how2matplotlib.com')
plt.xlabel('X-axis')
plt.ylabel('Y-axis')
plt.show()
Output:
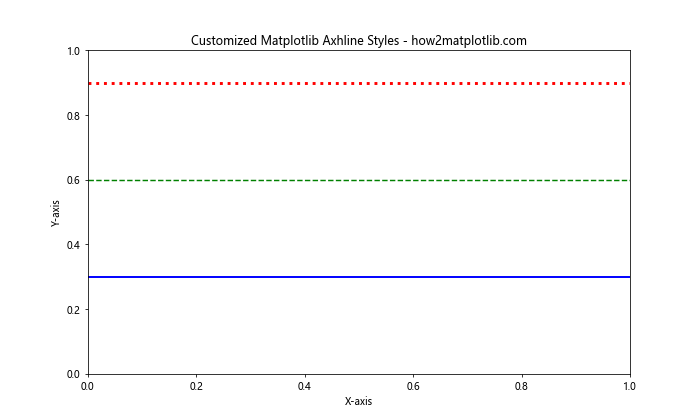
This example demonstrates three different matplotlib axhline styles: solid, dashed, and dotted lines with varying colors and line widths.
Line Transparency
You can also adjust the transparency of the matplotlib axhline using the alpha parameter:
import matplotlib.pyplot as plt
import numpy as np

x = np.linspace(0, 10, 100)
y = np.sin(x)

plt.figure(figsize=(10, 6))
plt.plot(x, y)
plt.axhline(y=0, color='r', linestyle='--', alpha=0.5)
plt.title('Matplotlib Axhline with Transparency - how2matplotlib.com')
plt.xlabel('X-axis')
plt.ylabel('Y-axis')
plt.show()
Output:
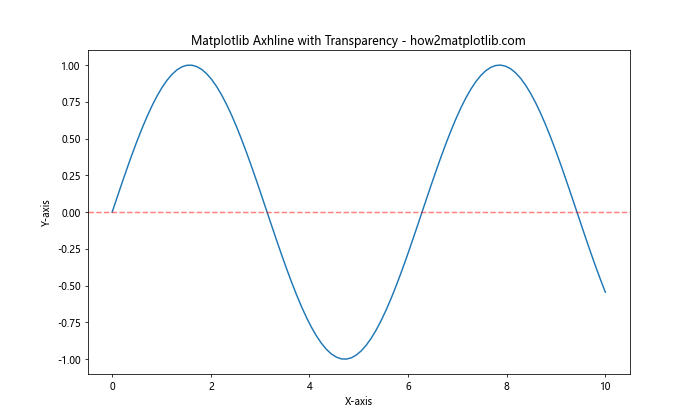
In this example, we plot a sine wave and add a semi-transparent red dashed line at y=0 using matplotlib axhline.
Using Matplotlib Axhline with Data Analysis
Matplotlib axhline is particularly useful when analyzing data and highlighting important values. Let’s look at some practical applications:
Highlighting Mean Values
You can use matplotlib axhline to highlight the mean value of a dataset:
import matplotlib.pyplot as plt
import numpy as np

data = np.random.randn(1000)
mean = np.mean(data)

plt.figure(figsize=(10, 6))
plt.hist(data, bins=30, alpha=0.7)
plt.axhline(y=mean, color='r', linestyle='--', label=f'Mean: {mean:.2f}')
plt.title('Histogram with Mean Line - how2matplotlib.com')
plt.xlabel('Value')
plt.ylabel('Frequency')
plt.legend()
plt.show()
Output:
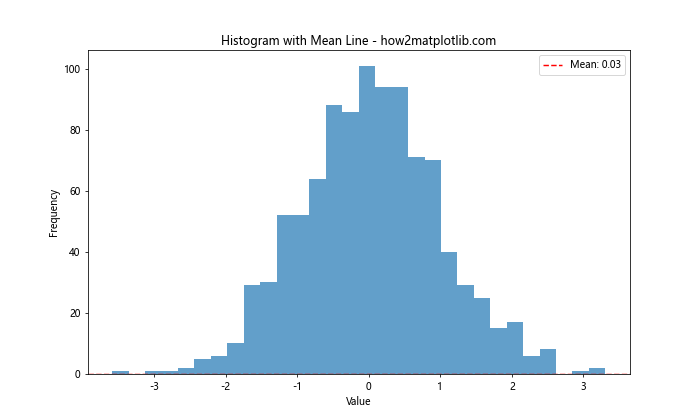
This example creates a histogram of random data and uses matplotlib axhline to draw a line at the mean value.
Visualizing Thresholds
Matplotlib axhline can be used to visualize thresholds in time series data:
import matplotlib.pyplot as plt
import numpy as np

np.random.seed(42)
x = np.linspace(0, 10, 100)
y = np.cumsum(np.random.randn(100))

plt.figure(figsize=(10, 6))
plt.plot(x, y)
plt.axhline(y=5, color='g', linestyle='--', label='Upper Threshold')
plt.axhline(y=-5, color='r', linestyle='--', label='Lower Threshold')
plt.title('Time Series with Thresholds - how2matplotlib.com')
plt.xlabel('Time')
plt.ylabel('Value')
plt.legend()
plt.show()
Output:
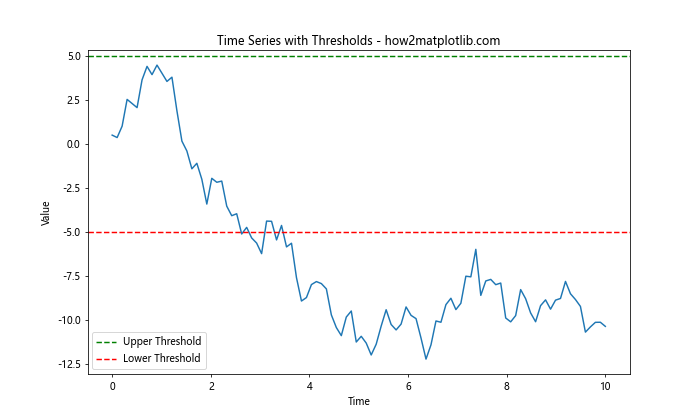
In this example, we plot a random walk and use matplotlib axhline to add upper and lower threshold lines.
Advanced Techniques with Matplotlib Axhline
Now that we’ve covered the basics, let’s explore some more advanced techniques using matplotlib axhline.
Multiple Axhlines in Subplots
You can use matplotlib axhline in multiple subplots to compare different datasets:
import matplotlib.pyplot as plt
import numpy as np

np.random.seed(42)
data1 = np.random.randn(1000)
data2 = np.random.randn(1000) + 2

fig, (ax1, ax2) = plt.subplots(2, 1, figsize=(10, 10))

ax1.hist(data1, bins=30, alpha=0.7)
ax1.axhline(y=np.mean(data1), color='r', linestyle='--', label=f'Mean: {np.mean(data1):.2f}')
ax1.set_title('Dataset 1 - how2matplotlib.com')
ax1.legend()

ax2.hist(data2, bins=30, alpha=0.7)
ax2.axhline(y=np.mean(data2), color='g', linestyle='--', label=f'Mean: {np.mean(data2):.2f}')
ax2.set_title('Dataset 2 - how2matplotlib.com')
ax2.legend()

plt.tight_layout()
plt.show()
Output:
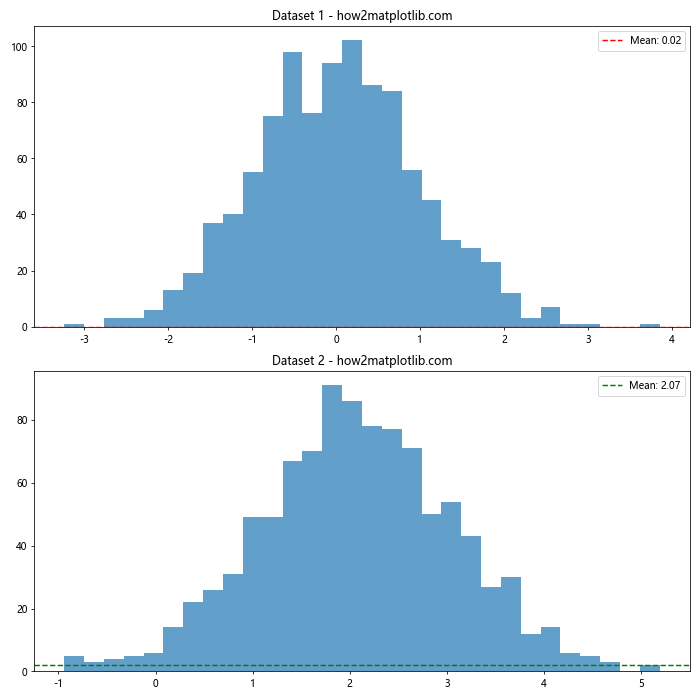
This example creates two subplots, each with a histogram and a matplotlib axhline showing the mean value.
Combining Axhline with Other Plot Types
Matplotlib axhline can be combined with other plot types to create more informative visualizations:
import matplotlib.pyplot as plt
import numpy as np

x = np.linspace(0, 10, 100)
y1 = np.sin(x)
y2 = np.cos(x)

plt.figure(figsize=(10, 6))
plt.plot(x, y1, label='sin(x)')
plt.plot(x, y2, label='cos(x)')
plt.axhline(y=0, color='k', linestyle='--', alpha=0.5)
plt.axhline(y=1, color='r', linestyle=':', alpha=0.5)
plt.axhline(y=-1, color='r', linestyle=':', alpha=0.5)
plt.title('Sine and Cosine with Reference Lines - how2matplotlib.com')
plt.xlabel('X-axis')
plt.ylabel('Y-axis')
plt.legend()
plt.grid(True, alpha=0.3)
plt.show()
Output:
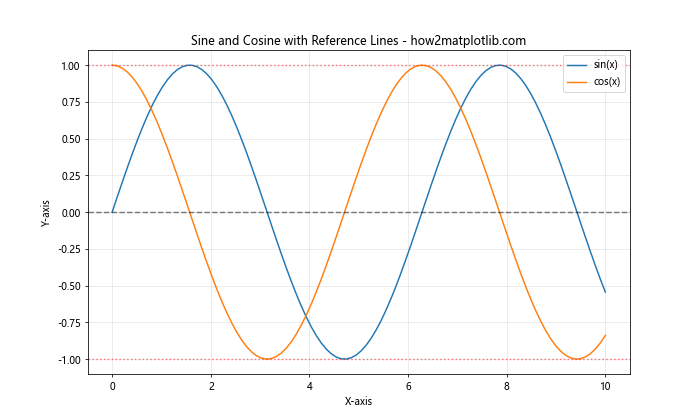
In this example, we plot sine and cosine functions and use matplotlib axhline to add reference lines at y=0, y=1, and y=-1.
Matplotlib Axhline in Statistical Visualizations
Matplotlib axhline is particularly useful in statistical visualizations. Let’s explore some examples:
Box Plots with Reference Lines
You can use matplotlib axhline to add reference lines to box plots:
import matplotlib.pyplot as plt
import numpy as np

np.random.seed(42)
data = [np.random.normal(0, std, 100) for std in range(1, 4)]

fig, ax = plt.subplots(figsize=(10, 6))
ax.boxplot(data)
ax.axhline(y=0, color='r', linestyle='--', label='Reference Line')
ax.set_title('Box Plot with Reference Line - how2matplotlib.com')
ax.set_xlabel('Group')
ax.set_ylabel('Value')
ax.legend()
plt.show()
Output:
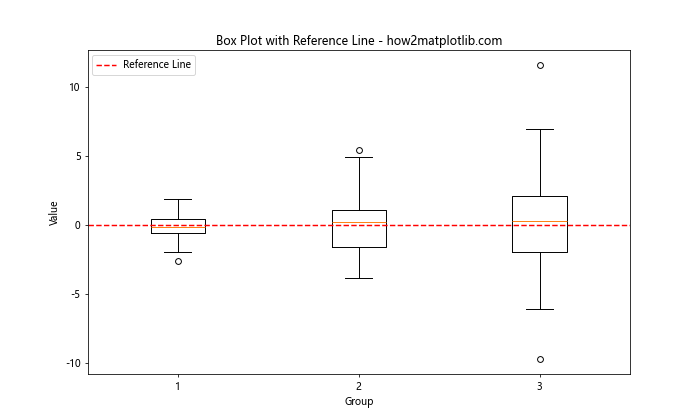
This example creates a box plot of three datasets and adds a reference line at y=0 using matplotlib axhline.
Scatter Plots with Regression Line
Matplotlib axhline can be used to highlight the y-intercept in regression analysis:
import matplotlib.pyplot as plt
import numpy as np
from scipy import stats

np.random.seed(42)
x = np.random.rand(50)
y = 2 + 3 * x + np.random.randn(50) * 0.5

slope, intercept, r_value, p_value, std_err = stats.linregress(x, y)

plt.figure(figsize=(10, 6))
plt.scatter(x, y, alpha=0.7)
plt.plot(x, intercept + slope * x, color='r', label='Regression Line')
plt.axhline(y=intercept, color='g', linestyle='--', label=f'Y-intercept: {intercept:.2f}')
plt.title('Scatter Plot with Regression Line and Y-intercept - how2matplotlib.com')
plt.xlabel('X-axis')
plt.ylabel('Y-axis')
plt.legend()
plt.show()
Output:
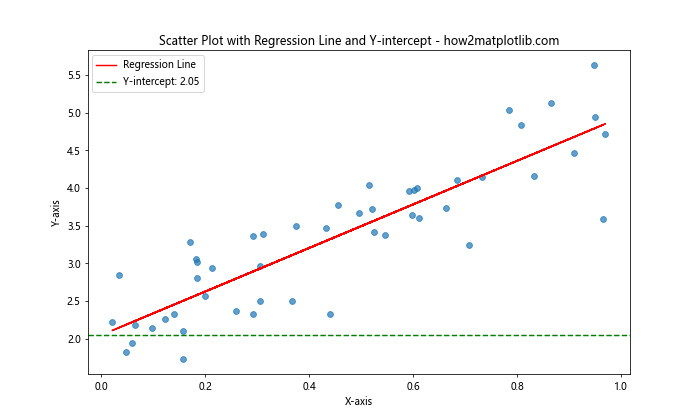
In this example, we create a scatter plot with a regression line and use matplotlib axhline to highlight the y-intercept.
Matplotlib Axhline in Time Series Analysis
Time series analysis is another area where matplotlib axhline can be particularly useful. Let’s look at some examples:
Highlighting Seasonal Patterns
You can use matplotlib axhline to highlight seasonal patterns in time series data:
import matplotlib.pyplot as plt
import numpy as np
import pandas as pd

np.random.seed(42)
dates = pd.date_range(start='2020-01-01', end='2022-12-31', freq='D')
values = np.cumsum(np.random.randn(len(dates))) + np.sin(np.arange(len(dates)) * 2 * np.pi / 365) * 10

plt.figure(figsize=(12, 6))
plt.plot(dates, values)
plt.axhline(y=values.mean(), color='r', linestyle='--', label='Mean')
plt.title('Time Series with Seasonal Pattern - how2matplotlib.com')
plt.xlabel('Date')
plt.ylabel('Value')
plt.legend()
plt.show()
Output:
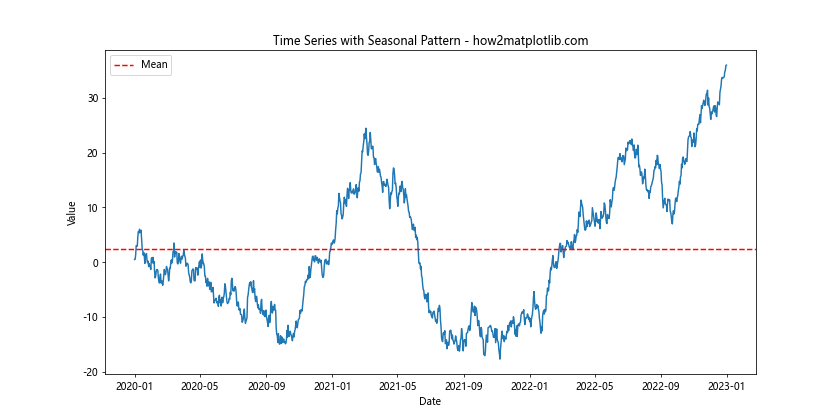
This example creates a time series with a seasonal pattern and uses matplotlib axhline to show the mean value.
Visualizing Trading Signals
Matplotlib axhline can be used to visualize trading signals in financial time series:
import matplotlib.pyplot as plt
import numpy as np
import pandas as pd

np.random.seed(42)
dates = pd.date_range(start='2022-01-01', end='2022-12-31', freq='D')
prices = np.cumsum(np.random.randn(len(dates))) + 100

plt.figure(figsize=(12, 6))
plt.plot(dates, prices)
plt.axhline(y=prices.mean(), color='r', linestyle='--', label='Mean Price')
plt.axhline(y=prices.mean() + prices.std(), color='g', linestyle=':', label='Upper Band')
plt.axhline(y=prices.mean() - prices.std(), color='g', linestyle=':', label='Lower Band')
plt.title('Stock Price with Trading Bands - how2matplotlib.com')
plt.xlabel('Date')
plt.ylabel('Price')
plt.legend()
plt.show()
Output:
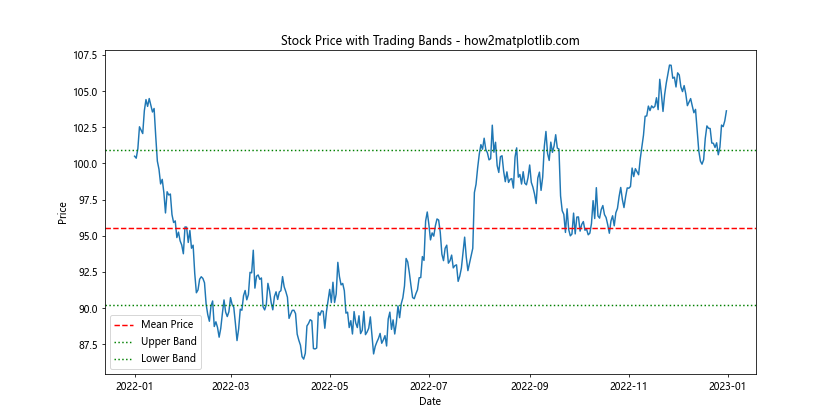
In this example, we simulate a stock price series and use matplotlib axhline to add mean price and trading bands.
Combining Matplotlib Axhline with Other Axis Functions
Matplotlib axhline can be combined with other axis functions to create more complex visualizations. Let’s explore some examples:
Using Axhline with Axvline
You can combine matplotlib axhline with axvline to create a coordinate system:
import matplotlib.pyplot as plt
import numpy as np

x = np.linspace(-5, 5, 100)
y = x**2

plt.figure(figsize=(10, 8))
plt.plot(x, y)
plt.axhline(y=0, color='k', linestyle='-', linewidth=0.5)
plt.axvline(x=0, color='k', linestyle='-', linewidth=0.5)
plt.title('Parabola with Coordinate Axes - how2matplotlib.com')
plt.xlabel('X-axis')
plt.ylabel('Y-axis')
plt.grid(True, alpha=0.3)
plt.show()
Output:
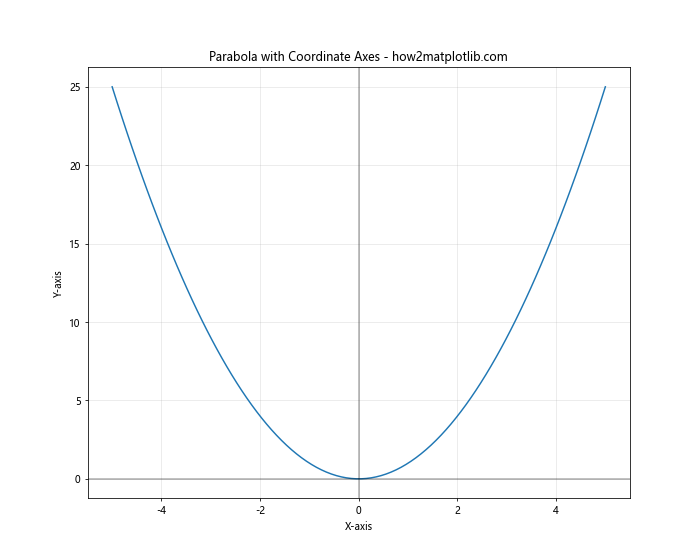
This example plots a parabola and uses matplotlib axhline and axvline to create x and y axes.
Combining Axhline with Fill_between
You can use matplotlib axhline in combination with fill_between to highlight specific regions:
import matplotlib.pyplot as plt
import numpy as np

x = np.linspace(0, 10, 100)
y = np.sin(x)

plt.figure(figsize=(10, 6))
plt.plot(x, y)
plt.axhline(y=0.5, color='r', linestyle='--', label='Threshold')
plt.fill_between(x, y, 0.5, where=(y > 0.5), alpha=0.3, color='g', label='Above Threshold')
plt.title('Sine Wave with Highlighted Region - how2matplotlib.com')
plt.xlabel('X-axis')
plt.ylabel('Y-axis')
plt.legend()
plt.show()
Output:
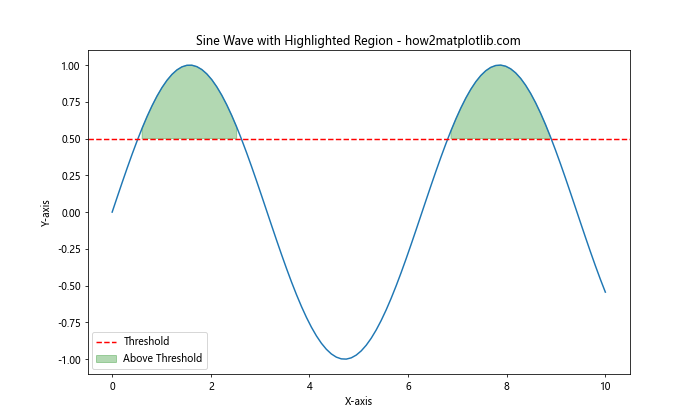
In this example, we plot a sine wave, use matplotlib axhline to add a threshold line, and fill the region above the threshold.
Matplotlib Axhline in 3D Plots
While matplotlib axhline is primarily used in 2D plots, it can also be adapted for use in 3D visualizations. Let’s look at an example:
import matplotlib.pyplot as plt
import numpy as np
from mpl_toolkits.mplot3d import Axes3D

fig = plt.figure(figsize=(10, 8))
ax = fig.add_subplot(111, projection='3d')

x = np.linspace(-5, 5, 100)
y = np.linspace(-5, 5, 100)
X, Y = np.meshgrid(x, y)
Z = np.sin(np.sqrt(X**2 + Y**2))

ax.plot_surface(X, Y, Z, cmap='viridis', alpha=0.8)

# Adding a horizontal plane
ax.plot_surface(X, Y, np.full_like(Z, -0.5), alpha=0.3, color='r')

ax.set_title('3D Surface Plot with Horizontal Plane - how2matplotlib.com')
ax.set_xlabel('X-axis')
ax.set_ylabel('Y-axis')
ax.set_zlabel('Z-axis')

plt.show()
Output:
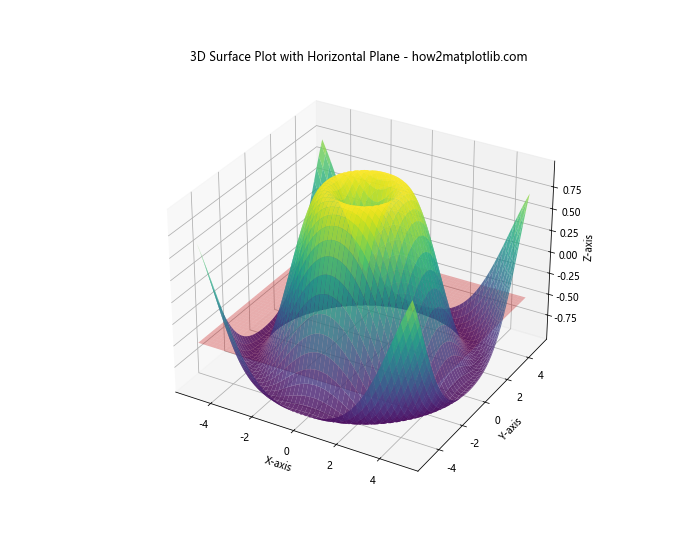
In this 3D example, we create a surface plot and add a horizontal plane using a technique similar to matplotlib axhline.
Best Practices for Using Matplotlib Axhline
To make the most of matplotlib axhline in your visualizations, consider the following best practices:
- Use appropriate line styles and colors to distinguish axhlines from data.
- Add labels or annotations to explain the significance of the lines.
- Combine axhlines with other plot elements to create继续输出剩余内容: more informative visualizations.
- Use transparency (alpha) to prevent axhlines from obscuring important data points.
- Consider using multiple axhlines to show different reference points or thresholds.
Let’s look at an example that incorporates these best practices: