How to Use Matplotlib Axhline with Labels: A Comprehensive Guide
Matplotlib axhline label is a powerful feature in the Matplotlib library that allows you to add horizontal lines to your plots with custom labels. This article will explore the various aspects of using matplotlib axhline label, providing detailed explanations and examples to help you master this essential plotting technique.
Understanding Matplotlib Axhline Label
Matplotlib axhline label is a combination of two important functions in Matplotlib: axhline() and label. The axhline() function is used to draw horizontal lines across the axes, while the label parameter allows you to add descriptive text to these lines. This combination is particularly useful for highlighting specific values, thresholds, or reference points in your plots.
Let’s start with a simple example to illustrate the basic usage of matplotlib axhline label:
import matplotlib.pyplot as plt

fig, ax = plt.subplots()
ax.plot([1, 2, 3, 4], [1, 4, 2, 3], label='Data')
ax.axhline(y=2.5, color='r', linestyle='--', label='Threshold')
ax.set_title('How to use matplotlib axhline label - how2matplotlib.com')
ax.legend()
plt.show()
Output:
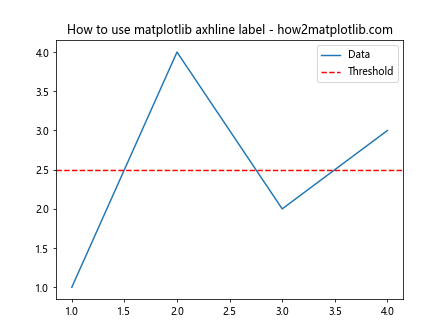
In this example, we create a simple line plot and add a horizontal line using axhline(). The label parameter is used to give the line a descriptive name, which will appear in the legend.
Customizing Matplotlib Axhline Label
One of the strengths of matplotlib axhline label is its flexibility in customization. You can adjust various properties of the horizontal line and its label to suit your specific needs.
Changing Line Style and Color
You can modify the appearance of the horizontal line by changing its style and color. Here’s an example:
import matplotlib.pyplot as plt

fig, ax = plt.subplots()
ax.plot([1, 2, 3, 4], [1, 4, 2, 3], label='Data')
ax.axhline(y=2.5, color='g', linestyle=':', linewidth=2, label='Green Dotted Line')
ax.set_title('Customized matplotlib axhline label - how2matplotlib.com')
ax.legend()
plt.show()
Output:
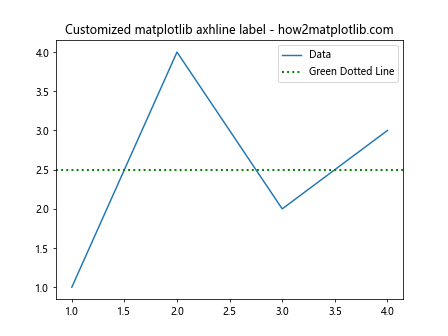
In this example, we’ve changed the color to green, the line style to dotted, and increased the line width. The label has also been updated to reflect these changes.
Adjusting Label Position
By default, the label for the axhline appears in the legend. However, you can also position the label directly on the line itself:
import matplotlib.pyplot as plt

fig, ax = plt.subplots()
ax.plot([1, 2, 3, 4], [1, 4, 2, 3], label='Data')
ax.axhline(y=2.5, color='r', linestyle='--')
ax.text(0.5, 2.5, 'Threshold', color='r', va='center', ha='center',
        transform=ax.get_yaxis_transform())
ax.set_title('Matplotlib axhline label positioning - how2matplotlib.com')
ax.legend()
plt.show()
Output:
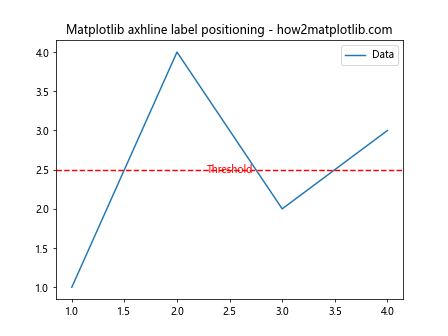
In this example, we’ve used the text() function to place the label directly on the horizontal line. The transform parameter ensures that the text position is relative to the y-axis.
Multiple Matplotlib Axhline Labels
You can add multiple horizontal lines with labels to your plot. This is particularly useful when you want to highlight different thresholds or reference points:
import matplotlib.pyplot as plt

fig, ax = plt.subplots()
ax.plot([1, 2, 3, 4], [1, 4, 2, 3], label='Data')
ax.axhline(y=1.5, color='r', linestyle='--', label='Lower Threshold')
ax.axhline(y=3.5, color='g', linestyle='--', label='Upper Threshold')
ax.set_title('Multiple matplotlib axhline labels - how2matplotlib.com')
ax.legend()
plt.show()
Output:
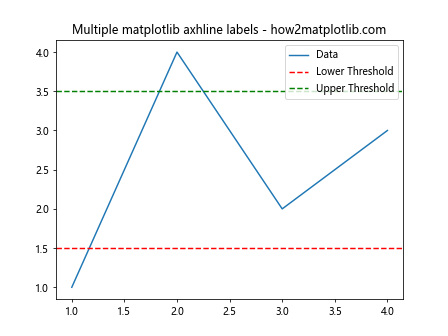
This example demonstrates how to add two horizontal lines with different colors and labels to represent lower and upper thresholds.
Matplotlib Axhline Label in Subplots
Matplotlib axhline label can be used effectively in subplots to highlight important values across multiple charts:
import matplotlib.pyplot as plt

fig, (ax1, ax2) = plt.subplots(2, 1, figsize=(8, 8))

ax1.plot([1, 2, 3, 4], [1, 4, 2, 3])
ax1.axhline(y=2.5, color='r', linestyle='--', label='Threshold')
ax1.set_title('Subplot 1 - how2matplotlib.com')
ax1.legend()

ax2.plot([1, 2, 3, 4], [3, 1, 4, 2])
ax2.axhline(y=2.5, color='r', linestyle='--', label='Threshold')
ax2.set_title('Subplot 2 - how2matplotlib.com')
ax2.legend()

plt.tight_layout()
plt.show()
Output:
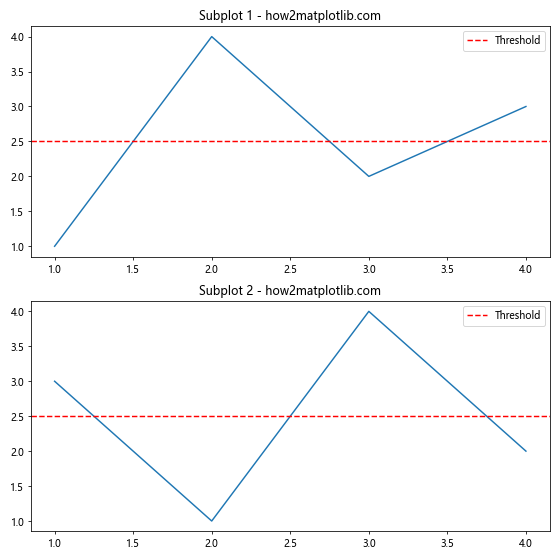
In this example, we’ve created two subplots and added the same horizontal line with a label to both of them. This can be useful for comparing data across different plots while maintaining a consistent reference point.
Using Matplotlib Axhline Label with Different Plot Types
Matplotlib axhline label can be used with various types of plots. Let’s explore how to use it with some common plot types.
Bar Plot
import matplotlib.pyplot as plt
import numpy as np

categories = ['A', 'B', 'C', 'D']
values = [3, 7, 2, 5]

fig, ax = plt.subplots()
ax.bar(categories, values)
ax.axhline(y=4, color='r', linestyle='--', label='Average')
ax.set_title('Bar plot with matplotlib axhline label - how2matplotlib.com')
ax.legend()
plt.show()
Output:
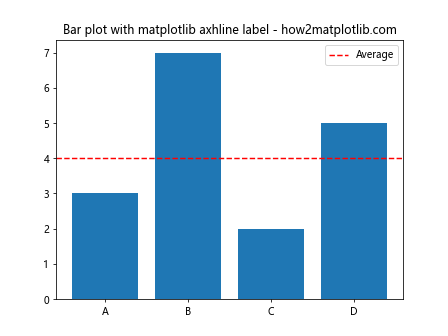
In this example, we’ve added a horizontal line to a bar plot to represent an average or threshold value.
Scatter Plot
import matplotlib.pyplot as plt
import numpy as np

x = np.random.rand(50)
y = np.random.rand(50)

fig, ax = plt.subplots()
ax.scatter(x, y)
ax.axhline(y=0.5, color='g', linestyle=':', label='Median')
ax.set_title('Scatter plot with matplotlib axhline label - how2matplotlib.com')
ax.legend()
plt.show()
Output:
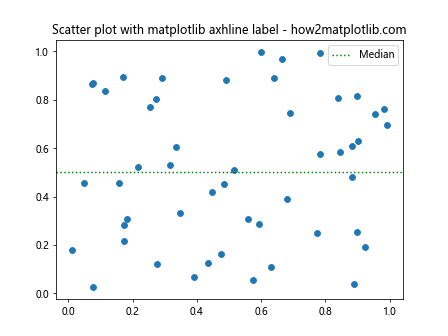
Here, we’ve added a horizontal line to a scatter plot to represent a median or reference value.
Advanced Techniques with Matplotlib Axhline Label
Let’s explore some more advanced techniques for using matplotlib axhline label.
Using Axhline with Date Axes
When working with time series data, you might want to use matplotlib axhline label to highlight specific dates:
import matplotlib.pyplot as plt
import numpy as np
from datetime import datetime, timedelta

dates = [datetime(2023, 1, 1) + timedelta(days=i) for i in range(100)]
values = np.cumsum(np.random.randn(100))

fig, ax = plt.subplots(figsize=(10, 6))
ax.plot(dates, values)
ax.axhline(y=0, color='r', linestyle='--', label='Baseline')
ax.set_title('Time series with matplotlib axhline label - how2matplotlib.com')
ax.legend()
plt.show()
Output:
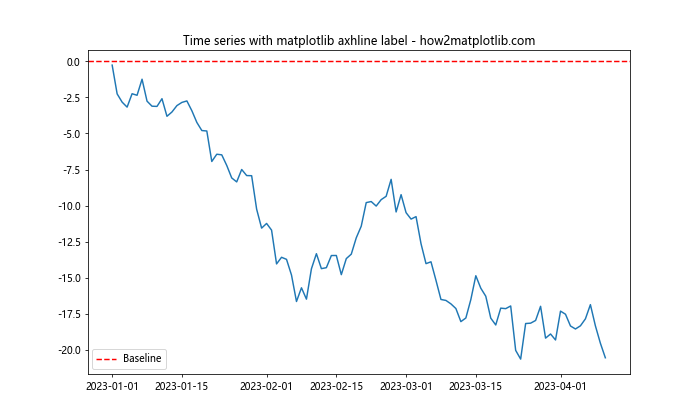
In this example, we’ve created a time series plot and added a horizontal line at y=0 to represent a baseline.
Combining Axhline with Axvline
You can combine horizontal and vertical lines to create a grid or highlight specific points:
import matplotlib.pyplot as plt
import numpy as np

x = np.linspace(0, 10, 100)
y = np.sin(x)

fig, ax = plt.subplots()
ax.plot(x, y)
ax.axhline(y=0, color='r', linestyle='--', label='y=0')
ax.axvline(x=np.pi, color='g', linestyle=':', label='x=π')
ax.set_title('Combining axhline and axvline - how2matplotlib.com')
ax.legend()
plt.show()
Output:
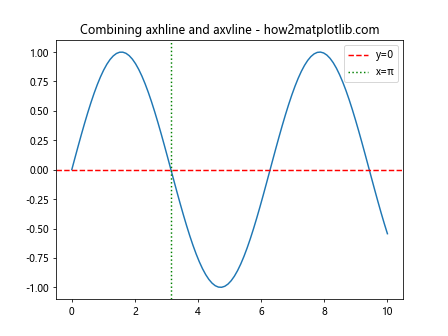
This example shows how to use both axhline() and axvline() to create a cross-hair effect on a sine wave plot.
Matplotlib Axhline Label in 3D Plots
While axhline() is primarily used in 2D plots, you can achieve similar effects in 3D plots using plot() with constant z-values:
import matplotlib.pyplot as plt
import numpy as np

fig = plt.figure()
ax = fig.add_subplot(111, projection='3d')

x = np.linspace(-5, 5, 100)
y = np.linspace(-5, 5, 100)
X, Y = np.meshgrid(x, y)
Z = np.sin(np.sqrt(X**2 + Y**2))

ax.plot_surface(X, Y, Z, cmap='viridis')
ax.plot([-5, 5], [0, 0], [0, 0], 'r--', label='x-axis')
ax.plot([0, 0], [-5, 5], [0, 0], 'g--', label='y-axis')
ax.set_title('3D plot with "axhline" effect - how2matplotlib.com')
ax.legend()
plt.show()
Output:
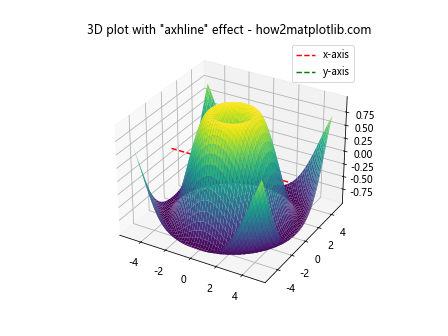
In this 3D plot example, we’ve used plot() to create line effects similar to axhline() along the x and y axes.
Matplotlib Axhline Label with Filled Areas
You can combine matplotlib axhline label with filled areas to create more informative visualizations:
import matplotlib.pyplot as plt
import numpy as np

x = np.linspace(0, 10, 100)
y1 = np.sin(x)
y2 = np.cos(x)

fig, ax = plt.subplots()
ax.plot(x, y1, label='sin(x)')
ax.plot(x, y2, label='cos(x)')
ax.axhline(y=0.5, color='r', linestyle='--', label='Upper Threshold')
ax.axhline(y=-0.5, color='g', linestyle='--', label='Lower Threshold')
ax.fill_between(x, -0.5, 0.5, alpha=0.2, color='yellow', label='Safe Zone')
ax.set_title('Matplotlib axhline label with filled area - how2matplotlib.com')
ax.legend()
plt.show()
Output:
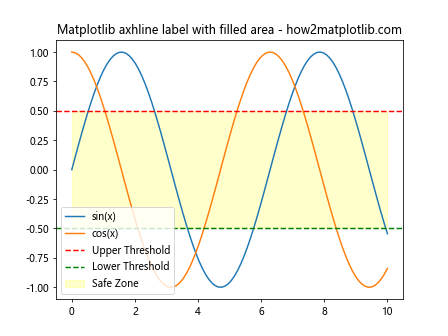
In this example, we’ve added two horizontal lines to represent thresholds and filled the area between them to indicate a “safe zone”.
Using Matplotlib Axhline Label for Statistical Visualization
Matplotlib axhline label is particularly useful for statistical visualizations, such as box plots or violin plots:
import matplotlib.pyplot as plt
import numpy as np

data = [np.random.normal(0, std, 100) for std in range(1, 4)]

fig, ax = plt.subplots()
ax.boxplot(data)
ax.axhline(y=0, color='r', linestyle='--', label='Mean')
ax.set_title('Box plot with matplotlib axhline label - how2matplotlib.com')
ax.legend()
plt.show()
Output:
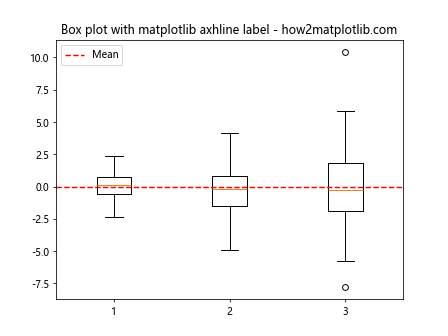
In this box plot example, we’ve added a horizontal line to represent the mean across all datasets.
Matplotlib Axhline Label in Logarithmic Scales
When working with logarithmic scales, matplotlib axhline label can be used to highlight order-of-magnitude differences:
import matplotlib.pyplot as plt
import numpy as np

x = np.logspace(0, 3, 100)
y = x**2

fig, ax = plt.subplots()
ax.loglog(x, y)
ax.axhline(y=1e3, color='r', linestyle='--', label='y=1000')
ax.axhline(y=1e6, color='g', linestyle='--', label='y=1,000,000')
ax.set_title('Log-log plot with matplotlib axhline label - how2matplotlib.com')
ax.legend()
plt.show()
Output:
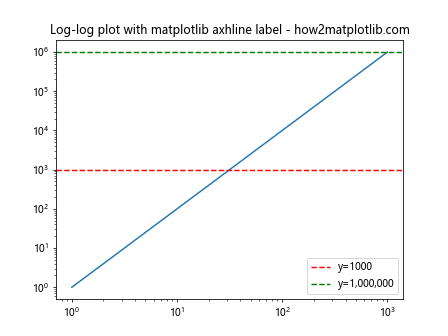
This example demonstrates how to use matplotlib axhline label in a log-log plot to highlight specific values.
Customizing Matplotlib Axhline Label Text
You can further customize the appearance of the label text using various text properties:
import matplotlib.pyplot as plt

fig, ax = plt.subplots()
ax.plot([1, 2, 3, 4], [1, 4, 2, 3])
ax.axhline(y=2.5, color='r', linestyle='--')
ax.text(0.5, 2.5, 'Threshold', color='r', va='center', ha='center',
        transform=ax.get_yaxis_transform(), fontsize=14, fontweight='bold',
        bbox=dict(facecolor='white', edgecolor='none', alpha=0.7))
ax.set_title('Customized matplotlib axhline label text - how2matplotlib.com')
plt.show()
Output:
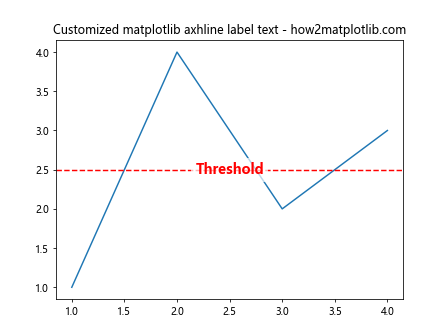
In this example, we’ve customized the label text by changing its size, weight, and adding a background box.
Using Matplotlib Axhline Label with Annotations
You can combine matplotlib axhline label with annotations to provide more detailed information about specific points:
import matplotlib.pyplot as plt
import numpy as np

x = np.linspace(0, 10, 100)
y = np.sin(x)

fig, ax = plt.subplots()
ax.plot(x, y)
ax.axhline(y=0.5, color='r', linestyle='--', label='Threshold')
ax.annotate('Peak', xy=(np.pi/2, 1), xytext=(np.pi/2, 1.2),
            arrowprops=dict(facecolor='black', shrink=0.05))
ax.set_title('Matplotlib axhline label with annotation - how2matplotlib.com')
ax.legend()
plt.show()
Output:
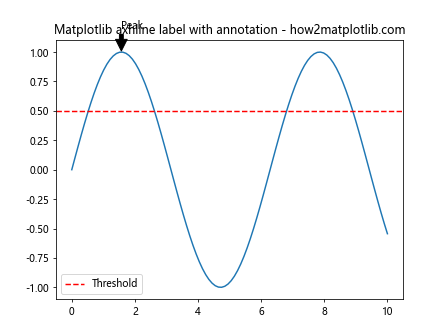
This example shows how to use matplotlib axhline label along with an annotation to highlight a specific point of interest.
Matplotlib Axhline Label in Polar Plots
While axhline() is not directly applicable to polar plots, you can achieve similar effects using axhline() in combination with polar projections:
import matplotlib.pyplot as plt
import numpy as np

r = np.arange(0, 2, 0.01)
theta = 2 * np.pi * r

fig, ax = plt.subplots(subplot_kw={'projection': 'polar'})
ax.plot(theta, r)
ax.axhline(y=1, color='r', linestyle='--', label='r=1')
ax.set_title('Polar plot with "axhline" effect - how2matplotlib.com')
ax.legend()
plt.show()
Output:
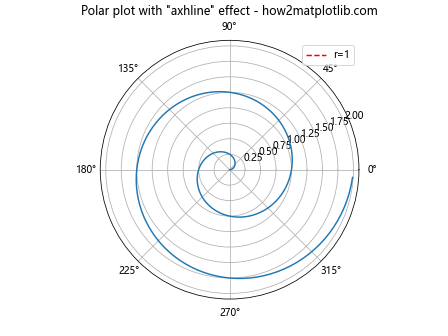
In this polar plot example, we’ve used axhline() to create a circular line at r=1.
Frequently Asked Questions about Matplotlib Axhline Label
To further enhance your understanding of matplotlib axhline label, let’s address some common questions:
Q1: Can I use matplotlib axhline label with subplots?
Yes, you can use matplotlib axhline label with subplots. Here’s an example:
import matplotlib.pyplot as plt
import numpy as np

fig, (ax1, ax2) = plt.subplots(1, 2, figsize=(12, 5))

x = np.linspace(0, 10, 100)
y1 = np.sin(x)
y2 = np.cos(x)

ax1.plot(x, y1)
ax1.axhline(y=0, color='r', linestyle='--', label='Zero Line')
ax1.set_title('Sine Wave - how2matplotlib.com')
ax1.legend()

ax2.plot(x, y2)
ax2.axhline(y=0, color='g', linestyle='--', label='Zero Line')
ax2.set_title('Cosine Wave - how2matplotlib.com')
ax2.legend()

plt.tight_layout()
plt.show()
Output:
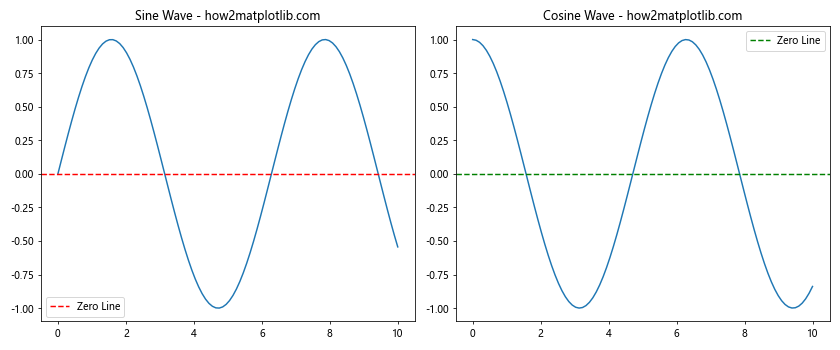
This example demonstrates how to add horizontal lines with labels to two separate subplots.
Q2: How can I add multiple horizontal lines with different styles?
You can add multiple horizontal lines with different styles by calling axhline() multiple times. Here’s an example:
import matplotlib.pyplot as plt
import numpy as np

x = np.linspace(0, 10, 100)
y = np.sin(x)

fig, ax = plt.subplots()
ax.plot(x, y)
ax.axhline(y=0.5, color='r', linestyle='--', label='Upper Threshold')
ax.axhline(y=-0.5, color='g', linestyle=':', label='Lower Threshold')
ax.axhline(y=0, color='b', linestyle='-', label='Zero Line')
ax.set_title('Multiple horizontal lines - how2matplotlib.com')
ax.legend()
plt.show()
Output:
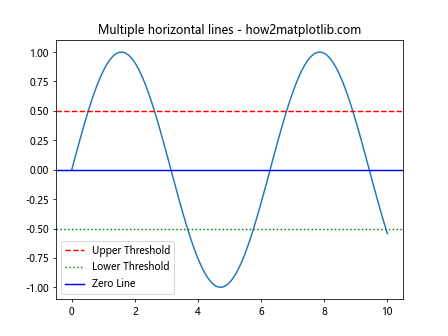
This example shows how to add three horizontal lines with different colors, styles, and labels.
Q3: Can I use matplotlib axhline label with histograms?
Absolutely! Matplotlib axhline label can be very useful with histograms to highlight specific values or thresholds. Here’s an example:
import matplotlib.pyplot as plt
import numpy as np

data = np.random.normal(0, 1, 1000)

fig, ax = plt.subplots()
ax.hist(data, bins=30, edgecolor='black')
ax.axhline(y=100, color='r', linestyle='--', label='Threshold')
ax.set_title('Histogram with matplotlib axhline label - how2matplotlib.com')
ax.legend()
plt.show()
Output:
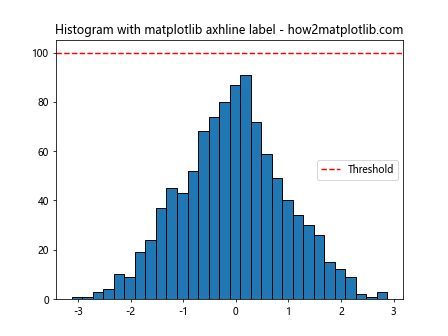
In this example, we’ve added a horizontal line to a histogram to represent a threshold value.
Q4: How can I make the matplotlib axhline label span only part of the plot?
By default, axhline() spans the entire width of the plot. If you want it to cover only a portion, you can use the xmin and xmax parameters. Here’s an example:
import matplotlib.pyplot as plt
import numpy as np

x = np.linspace(0, 10, 100)
y = np.sin(x)

fig, ax = plt.subplots()
ax.plot(x, y)
ax.axhline(y=0.5, xmin=0.25, xmax=0.75, color='r', linestyle='--', label='Partial Line')
ax.set_title('Partial matplotlib axhline label - how2matplotlib.com')
ax.legend()
plt.show()
Output:
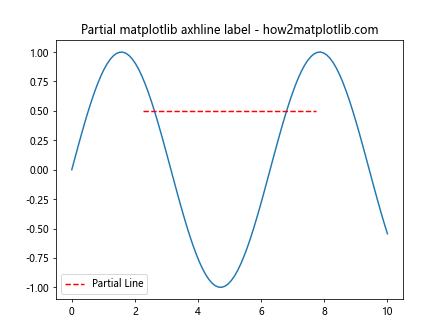
In this example, the horizontal line only spans from 25% to 75% of the x-axis.
Q5: Can I use matplotlib axhline label with categorical data?
Yes, you can use matplotlib axhline label with categorical data. It’s particularly useful for highlighting thresholds or averages in bar plots or box plots with categorical data. Here’s an example:
import matplotlib.pyplot as plt
import numpy as np

categories = ['A', 'B', 'C', 'D', 'E']
values = [3, 7, 2, 5, 4]

fig, ax = plt.subplots()
ax.bar(categories, values)
ax.axhline(y=np.mean(values), color='r', linestyle='--', label='Mean')
ax.set_title('Categorical data with matplotlib axhline label - how2matplotlib.com')
ax.legend()
plt.show()
Output:
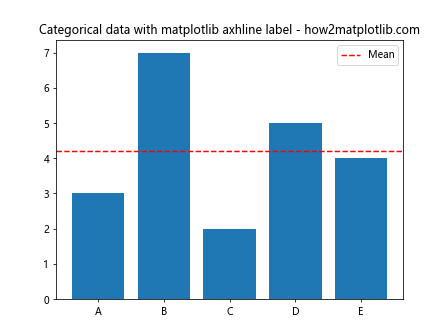
This example shows how to add a horizontal line representing the mean value in a bar plot with categorical data.
Best Practices for Using Matplotlib Axhline Label
To make the most of matplotlib axhline label in your visualizations, consider the following best practices:
- Purposeful Use: Only add horizontal lines when they provide meaningful information or highlight important thresholds.
Clear Labeling: Always provide clear, concise labels for your horizontal lines to explain their significance.
Consistent Styling: Use consistent colors and line styles for similar types of horizontal lines across your visualizations.
Avoid Clutter: Be mindful of the number of horizontal lines you add to a plot. Too many can make the visualization difficult to read.
Combine with Other Elements: Use matplotlib axhline label in combination with other plot elements like annotations, text, or filled areas to create more informative visualizations.
Consider Color Contrast: Choose colors for your horizontal lines that contrast well with the main plot elements and background.
Use Appropriate Line Styles: Different line styles (solid, dashed, dotted) can convey different levels of importance or types of information.
Adjust for Plot Type: Adapt your use of matplotlib axhline label based on the type of plot you’re creating (e.g., line plots, scatter plots, histograms).
Legend Placement: Carefully consider the placement of your legend to ensure it doesn’t obscure important parts of the plot or the horizontal lines.
Scale Appropriately: When using matplotlib axhline label with different scales (e.g., log scale), ensure the values and positioning make sense in the context of the plot.
Advanced Matplotlib Axhline Label Techniques
Let’s explore some more advanced techniques for using matplotlib axhline label: