How to Use Matplotlib Axhline with Dashed Lines: A Comprehensive Guide
Matplotlib axhline dashed is a powerful combination for creating horizontal lines in plots. This article will explore the various aspects of using matplotlib axhline with dashed lines, providing detailed explanations and examples to help you master this feature.
Introduction to Matplotlib Axhline Dashed
Matplotlib axhline dashed is a technique used to add horizontal lines to plots with a dashed style. The axhline function in matplotlib is specifically designed to draw horizontal lines across the axes, and when combined with the dashed line style, it creates visually appealing and informative plots. This combination is particularly useful for highlighting specific y-values, thresholds, or reference points in your data visualizations.
Let’s start with a basic example of how to use matplotlib axhline with a dashed line:
import matplotlib.pyplot as plt

fig, ax = plt.subplots()
ax.set_title('Basic Matplotlib Axhline Dashed Example - how2matplotlib.com')
ax.axhline(y=0.5, linestyle='--', color='r')
plt.show()
Output:
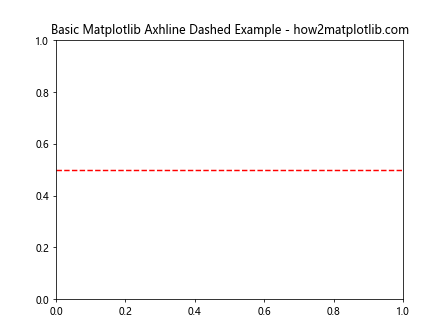
In this example, we create a simple plot and add a dashed horizontal line at y=0.5 using the axhline function. The linestyle=’–‘ parameter sets the line style to dashed, and color=’r’ makes the line red.
Understanding the Matplotlib Axhline Function
The matplotlib axhline function is a versatile tool for adding horizontal lines to plots. It’s part of the Axes class and can be called using ax.axhline(). The function takes several parameters that allow you to customize the appearance and position of the line.
Here’s a more detailed example showcasing some of the key parameters of matplotlib axhline:
import matplotlib.pyplot as plt

fig, ax = plt.subplots()
ax.set_title('Customized Matplotlib Axhline Dashed - how2matplotlib.com')
ax.axhline(y=0.5, xmin=0.25, xmax=0.75, linestyle='--', color='g', linewidth=2)
plt.show()
Output:
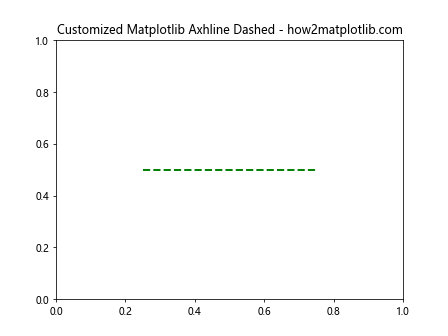
In this example, we use additional parameters:
- y=0.5: Sets the y-coordinate of the line
- xmin=0.25 and xmax=0.75: Limit the line to the middle half of the x-axis
- linestyle=’–‘: Sets the line style to dashed
- color=’g’: Makes the line green
- linewidth=2: Increases the thickness of the line
Exploring Dashed Line Styles in Matplotlib
Matplotlib offers various dashed line styles that can be used with axhline. These styles allow you to create different visual effects and distinguish between multiple lines in your plots. Let’s explore some of these styles:
import matplotlib.pyplot as plt

fig, ax = plt.subplots()
ax.set_title('Different Dashed Styles with Matplotlib Axhline - how2matplotlib.com')
ax.axhline(y=0.2, linestyle='--', label='Dashed')
ax.axhline(y=0.4, linestyle=':', label='Dotted')
ax.axhline(y=0.6, linestyle='-.', label='Dash-dot')
ax.axhline(y=0.8, linestyle=(0, (5, 10)), label='Custom dashed')
ax.legend()
plt.show()
Output:
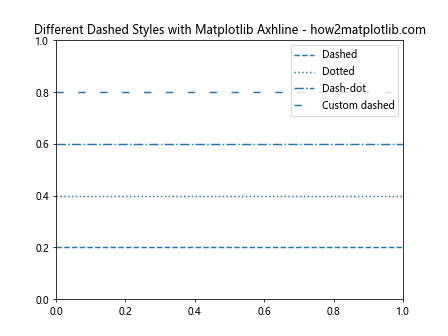
This example demonstrates four different line styles:
- ‘–‘: Standard dashed line
- ‘:’: Dotted line
- ‘-.’: Dash-dot line
- (0, (5, 10)): Custom dashed line with 5 pixels on, 10 pixels off
Each line is labeled and a legend is added to help identify the different styles.
Combining Matplotlib Axhline Dashed with Data Plots
One of the most common uses of matplotlib axhline dashed is to highlight specific values or thresholds in data plots. Let’s see how we can combine axhline with a scatter plot:
import matplotlib.pyplot as plt
import numpy as np

x = np.linspace(0, 10, 100)
y = np.sin(x)

fig, ax = plt.subplots()
ax.set_title('Scatter Plot with Matplotlib Axhline Dashed - how2matplotlib.com')
ax.scatter(x, y, alpha=0.5)
ax.axhline(y=0, linestyle='--', color='r', label='y=0')
ax.axhline(y=1, linestyle='--', color='g', label='y=1')
ax.axhline(y=-1, linestyle='--', color='b', label='y=-1')
ax.legend()
plt.show()
Output:
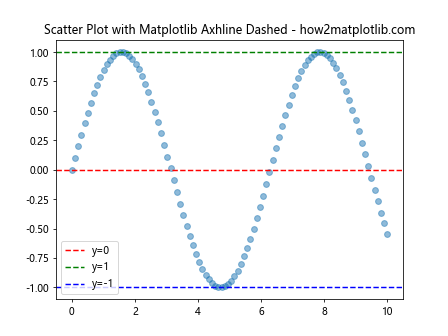
In this example, we create a scatter plot of a sine wave and add three dashed horizontal lines at y=0, y=1, and y=-1. These lines help to highlight the amplitude of the sine wave.
Using Matplotlib Axhline Dashed in Subplots
Matplotlib axhline dashed can be used effectively in subplots to create consistent reference lines across multiple plots. Here’s an example:
import matplotlib.pyplot as plt
import numpy as np

fig, (ax1, ax2) = plt.subplots(2, 1, figsize=(8, 8))
fig.suptitle('Subplots with Matplotlib Axhline Dashed - how2matplotlib.com')

x = np.linspace(0, 10, 100)
y1 = np.sin(x)
y2 = np.cos(x)

ax1.plot(x, y1)
ax1.axhline(y=0, linestyle='--', color='r')
ax1.set_title('Sine Wave')

ax2.plot(x, y2)
ax2.axhline(y=0, linestyle='--', color='r')
ax2.set_title('Cosine Wave')

plt.tight_layout()
plt.show()
Output:
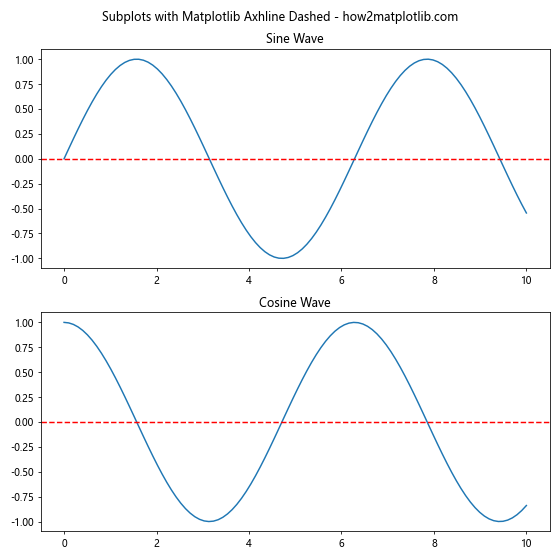
This example creates two subplots, one with a sine wave and another with a cosine wave. We add a dashed horizontal line at y=0 to both subplots, creating a consistent reference point.
Customizing Matplotlib Axhline Dashed with Zorder
The zorder parameter in matplotlib axhline dashed allows you to control the layering of plot elements. This is particularly useful when you want to ensure that your dashed lines are visible above or below other plot elements.
import matplotlib.pyplot as plt
import numpy as np

x = np.linspace(0, 10, 100)
y = np.sin(x)

fig, ax = plt.subplots()
ax.set_title('Matplotlib Axhline Dashed with Zorder - how2matplotlib.com')
ax.fill_between(x, y, alpha=0.3)
ax.axhline(y=0, linestyle='--', color='r', zorder=5)
ax.plot(x, y, zorder=10)
plt.show()
Output:
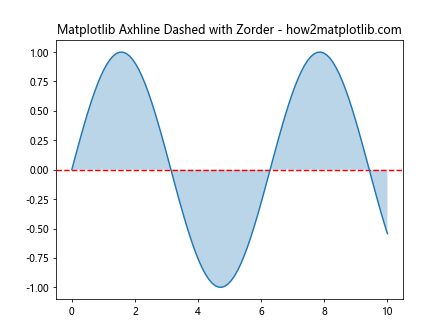
In this example, we create a filled area plot of a sine wave. We add a dashed horizontal line at y=0 with zorder=5, which places it above the filled area but below the line plot of the sine wave.
Adding Text to Matplotlib Axhline Dashed
Combining text annotations with matplotlib axhline dashed can provide additional context to your plots. Here’s how you can add text to your dashed horizontal lines:
import matplotlib.pyplot as plt

fig, ax = plt.subplots()
ax.set_title('Matplotlib Axhline Dashed with Text - how2matplotlib.com')
ax.axhline(y=0.5, linestyle='--', color='r')
ax.text(0.5, 0.52, 'Threshold', ha='center', va='bottom')
plt.show()
Output:
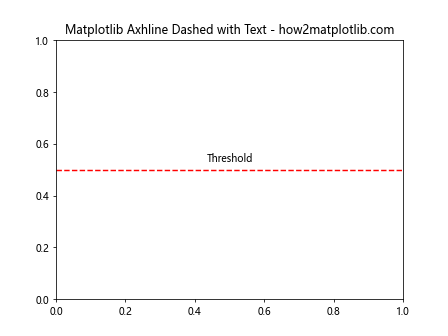
This example adds a text annotation just above the dashed horizontal line. The ha=’center’ and va=’bottom’ parameters align the text horizontally and vertically relative to the specified position.
Using Matplotlib Axhline Dashed in Time Series Plots
Matplotlib axhline dashed is particularly useful in time series plots to highlight specific dates or values. Here’s an example:
import matplotlib.pyplot as plt
import pandas as pd
import numpy as np

dates = pd.date_range(start='2023-01-01', end='2023-12-31', freq='D')
values = np.cumsum(np.random.randn(len(dates)))

fig, ax = plt.subplots(figsize=(10, 6))
ax.set_title('Time Series with Matplotlib Axhline Dashed - how2matplotlib.com')
ax.plot(dates, values)
ax.axhline(y=0, linestyle='--', color='r', label='Baseline')
ax.axhline(y=values.max(), linestyle='--', color='g', label='Max Value')
ax.axhline(y=values.min(), linestyle='--', color='b', label='Min Value')
ax.legend()
plt.show()
Output:
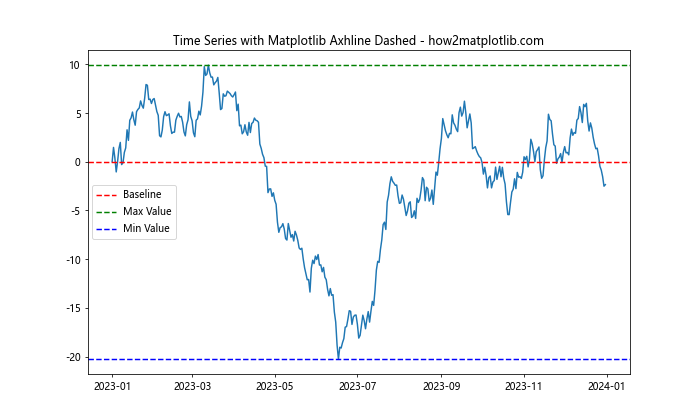
This example creates a time series plot and adds dashed horizontal lines to indicate the baseline (y=0), maximum value, and minimum value of the series.
Combining Matplotlib Axhline Dashed with Axvline
While axhline creates horizontal lines, axvline creates vertical lines. Combining these can create a grid-like structure in your plots:
import matplotlib.pyplot as plt

fig, ax = plt.subplots()
ax.set_title('Combining Axhline and Axvline - how2matplotlib.com')
ax.axhline(y=0.5, linestyle='--', color='r')
ax.axvline(x=0.5, linestyle='--', color='b')
plt.show()
Output:
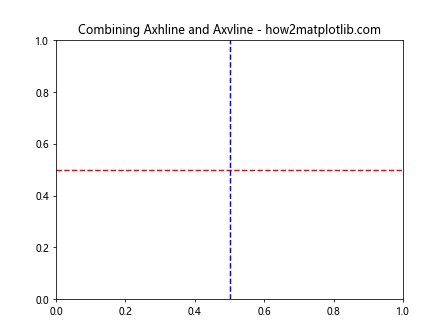
This example creates a dashed horizontal line at y=0.5 and a dashed vertical line at x=0.5, forming a cross in the middle of the plot.
Using Matplotlib Axhline Dashed in Histograms
Matplotlib axhline dashed can be used effectively in histograms to highlight specific values or thresholds:
import matplotlib.pyplot as plt
import numpy as np

data = np.random.normal(0, 1, 1000)

fig, ax = plt.subplots()
ax.set_title('Histogram with Matplotlib Axhline Dashed - how2matplotlib.com')
ax.hist(data, bins=30, alpha=0.7)
ax.axhline(y=50, linestyle='--', color='r', label='Threshold')
ax.legend()
plt.show()
Output:
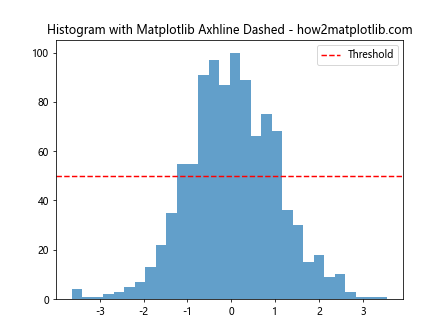
In this example, we create a histogram of normally distributed data and add a dashed horizontal line to indicate a threshold value.
Animating Matplotlib Axhline Dashed
You can create animated plots with matplotlib axhline dashed to show changing thresholds or reference lines:
import matplotlib.pyplot as plt
import matplotlib.animation as animation
import numpy as np

fig, ax = plt.subplots()
ax.set_title('Animated Matplotlib Axhline Dashed - how2matplotlib.com')
line, = ax.plot([], [])
hline = ax.axhline(y=0, linestyle='--', color='r')

def init():
    line.set_data([], [])
    return line, hline

def animate(i):
    x = np.linspace(0, 10, 100)
    y = np.sin(x + i/10)
    line.set_data(x, y)
    hline.set_ydata(np.sin(i/10))
    return line, hline

ani = animation.FuncAnimation(fig, animate, init_func=init, frames=100, blit=True)
plt.show()
Output:
This example creates an animated plot where a sine wave moves and the dashed horizontal line follows its peak.
Using Matplotlib Axhline Dashed in 3D Plots
While axhline is typically used in 2D plots, you can use similar concepts in 3D plots:
import matplotlib.pyplot as plt
import numpy as np

fig = plt.figure()
ax = fig.add_subplot(111, projection='3d')
ax.set_title('3D Plot with Horizontal Plane - how2matplotlib.com')

x = np.linspace(-5, 5, 100)
y = np.linspace(-5, 5, 100)
X, Y = np.meshgrid(x, y)
Z = np.sin(np.sqrt(X**2 + Y**2))

ax.plot_surface(X, Y, Z, alpha=0.5)
ax.plot_surface(X, Y, np.zeros_like(Z), alpha=0.2)
plt.show()
Output:
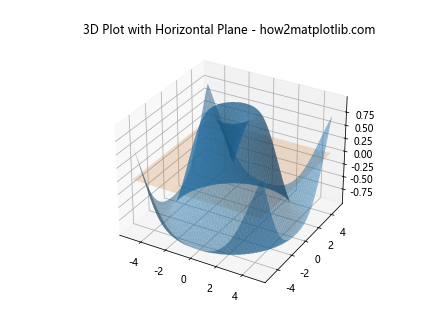
In this 3D example, we create a surface plot and add a transparent horizontal plane at z=0, which serves a similar purpose to axhline in 2D plots.
Matplotlib axhline dashed Conclusion
Matplotlib axhline dashed is a versatile tool for adding reference lines to your plots. Whether you’re working with simple line plots, scatter plots, histograms, or more complex visualizations, the combination of axhline and dashed line styles can greatly enhance the clarity and information content of your graphs.
By mastering the various parameters and techniques discussed in this article, you can create more informative and visually appealing plots. Remember to experiment with different line styles, colors, and positions to find the best way to highlight important aspects of your data.