Comprehensive Guide to Using Matplotlib.figure.Figure.set_edgecolor() in Python for Data Visualization
Matplotlib.figure.Figure.set_edgecolor() in Python is a powerful method used to customize the edge color of a figure in Matplotlib, one of the most popular data visualization libraries in Python. This function allows you to enhance the visual appeal of your plots by modifying the color of the figure’s border. In this comprehensive guide, we’ll explore the various aspects of Matplotlib.figure.Figure.set_edgecolor(), its usage, and provide numerous examples to help you master this essential feature of Matplotlib.
Understanding Matplotlib.figure.Figure.set_edgecolor()
Matplotlib.figure.Figure.set_edgecolor() is a method that belongs to the Figure class in Matplotlib. It is used to set the edge color of a figure, which is the color of the border surrounding the entire plot area. This method is particularly useful when you want to customize the appearance of your plots and make them visually appealing or consistent with a specific color scheme.
The basic syntax of Matplotlib.figure.Figure.set_edgecolor() is as follows:
import matplotlib.pyplot as plt

fig = plt.figure()
fig.set_edgecolor('color')
In this syntax, ‘color’ can be specified using various formats, including color names, hex codes, or RGB values.
Let’s dive into some examples to better understand how to use Matplotlib.figure.Figure.set_edgecolor() in Python.
Example 1: Setting a Basic Edge Color
import matplotlib.pyplot as plt

fig = plt.figure(figsize=(8, 6))
fig.set_edgecolor('red')
plt.plot([1, 2, 3, 4], [1, 4, 2, 3])
plt.title('How to use set_edgecolor() - how2matplotlib.com')
plt.show()
Output:
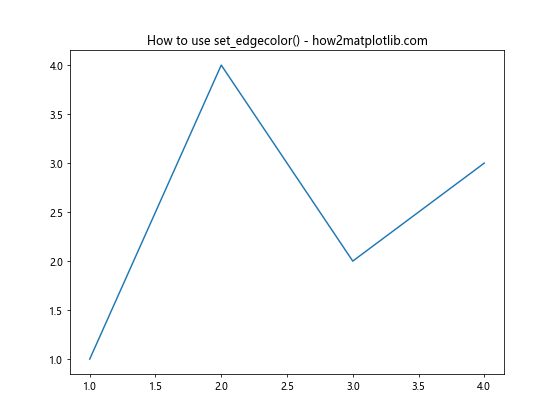
In this example, we create a figure and set its edge color to red using Matplotlib.figure.Figure.set_edgecolor(). The plot shows a simple line graph with a red border around the entire figure.
Example 2: Using Hex Color Codes
import matplotlib.pyplot as plt

fig = plt.figure(figsize=(8, 6))
fig.set_edgecolor('#00FF00')  # Bright green
plt.bar(['A', 'B', 'C', 'D'], [3, 7, 2, 5])
plt.title('Bar Chart with Green Edge - how2matplotlib.com')
plt.show()
Output:
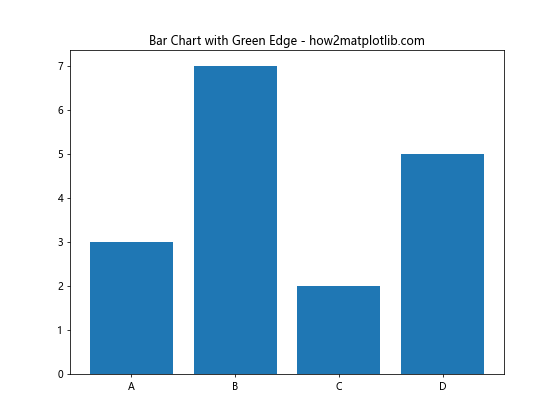
This example demonstrates how to use a hex color code with Matplotlib.figure.Figure.set_edgecolor(). We set the edge color to bright green (#00FF00) for a bar chart.
Advanced Usage of Matplotlib.figure.Figure.set_edgecolor()
While the basic usage of Matplotlib.figure.Figure.set_edgecolor() is straightforward, there are several advanced techniques and considerations to keep in mind when working with this method.
Example 3: Using RGB Values
import matplotlib.pyplot as plt

fig = plt.figure(figsize=(8, 6))
fig.set_edgecolor((0.5, 0.1, 0.5))  # Purple-ish color
plt.scatter([1, 2, 3, 4, 5], [2, 4, 6, 8, 10])
plt.title('Scatter Plot with RGB Edge Color - how2matplotlib.com')
plt.show()
Output:
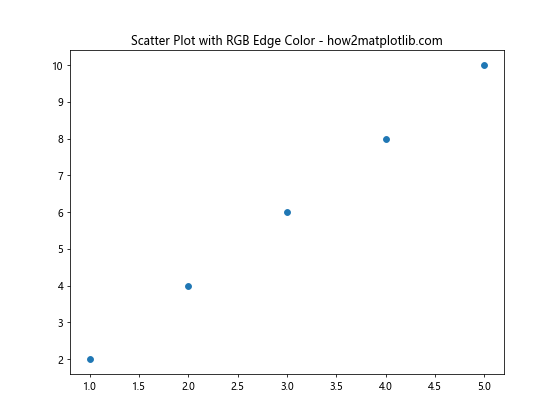
In this example, we use RGB values to set the edge color to a purple-ish hue. RGB values in Matplotlib are specified as tuples with values between 0 and 1.
Example 4: Combining set_edgecolor() with set_linewidth()
import matplotlib.pyplot as plt

fig = plt.figure(figsize=(8, 6))
fig.set_edgecolor('blue')
fig.set_linewidth(5)  # Set the edge width to 5 points
plt.plot([1, 2, 3, 4], [1, 4, 2, 3], 'ro-')
plt.title('Plot with Blue Thick Edge - how2matplotlib.com')
plt.show()
Output:
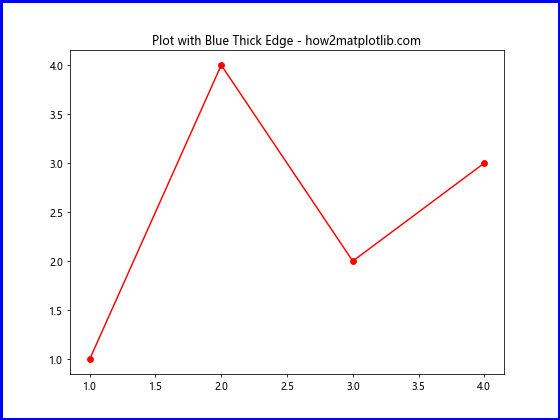
This example shows how to combine Matplotlib.figure.Figure.set_edgecolor() with set_linewidth() to create a thicker, more prominent edge around the figure.
Customizing Multiple Subplots with set_edgecolor()
Matplotlib.figure.Figure.set_edgecolor() can also be used effectively when working with multiple subplots. Let’s explore some examples to see how this works.
Example 5: Setting Edge Color for Multiple Subplots
import matplotlib.pyplot as plt

fig, (ax1, ax2) = plt.subplots(1, 2, figsize=(12, 5))
fig.set_edgecolor('orange')
fig.set_linewidth(3)

ax1.plot([1, 2, 3, 4], [1, 4, 2, 3])
ax1.set_title('Subplot 1 - how2matplotlib.com')

ax2.scatter([1, 2, 3, 4], [4, 3, 2, 1])
ax2.set_title('Subplot 2 - how2matplotlib.com')

plt.tight_layout()
plt.show()
Output:
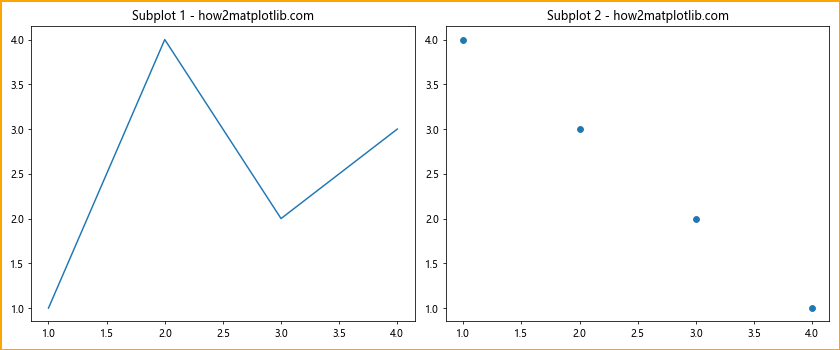
In this example, we create a figure with two subplots and set an orange edge color for the entire figure using Matplotlib.figure.Figure.set_edgecolor().
Example 6: Different Edge Colors for Subplots
import matplotlib.pyplot as plt

fig, (ax1, ax2) = plt.subplots(1, 2, figsize=(12, 5))
fig.set_edgecolor('green')
fig.set_linewidth(2)

ax1.plot([1, 2, 3, 4], [1, 4, 2, 3])
ax1.set_title('Subplot 1 - how2matplotlib.com')
ax1.set_facecolor('lightblue')

ax2.scatter([1, 2, 3, 4], [4, 3, 2, 1])
ax2.set_title('Subplot 2 - how2matplotlib.com')
ax2.set_facecolor('lightyellow')

plt.tight_layout()
plt.show()
Output:
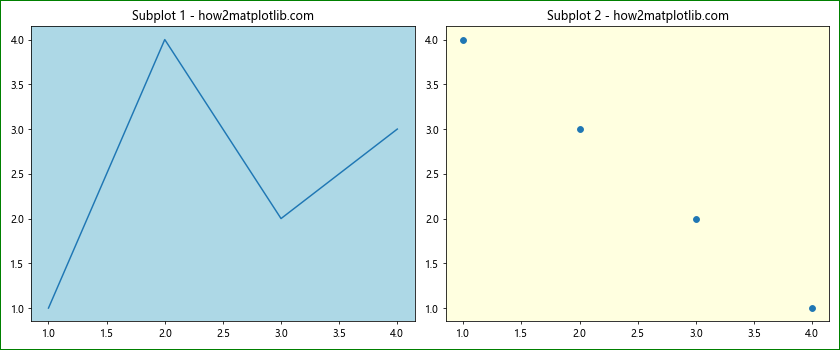
This example demonstrates how to set different background colors for subplots while maintaining a consistent edge color for the entire figure using Matplotlib.figure.Figure.set_edgecolor().
Using set_edgecolor() with Different Plot Types
Matplotlib.figure.Figure.set_edgecolor() can be applied to various types of plots. Let’s explore some examples with different plot types.
Example 7: Pie Chart with Custom Edge Color
import matplotlib.pyplot as plt

fig = plt.figure(figsize=(8, 8))
fig.set_edgecolor('purple')
fig.set_linewidth(4)

sizes = [30, 25, 20, 15, 10]
labels = ['A', 'B', 'C', 'D', 'E']
plt.pie(sizes, labels=labels, autopct='%1.1f%%')
plt.title('Pie Chart with Purple Edge - how2matplotlib.com')
plt.show()
Output:

This example shows how to apply a custom edge color to a pie chart using Matplotlib.figure.Figure.set_edgecolor().
Example 8: Histogram with Custom Edge Color
import matplotlib.pyplot as plt
import numpy as np

fig = plt.figure(figsize=(10, 6))
fig.set_edgecolor('brown')
fig.set_linewidth(3)

data = np.random.normal(100, 20, 1000)
plt.hist(data, bins=30, edgecolor='black')
plt.title('Histogram with Brown Edge - how2matplotlib.com')
plt.xlabel('Value')
plt.ylabel('Frequency')
plt.show()
Output:

In this example, we create a histogram and set a brown edge color for the figure using Matplotlib.figure.Figure.set_edgecolor().
Combining set_edgecolor() with Other Styling Options
To create more visually appealing plots, you can combine Matplotlib.figure.Figure.set_edgecolor() with other styling options available in Matplotlib.
Example 9: Customizing Plot Style with set_edgecolor()
import matplotlib.pyplot as plt

plt.style.use('seaborn')
fig = plt.figure(figsize=(10, 6))
fig.set_edgecolor('red')
fig.set_linewidth(2)

x = [1, 2, 3, 4, 5]
y = [2, 4, 6, 8, 10]

plt.plot(x, y, marker='o', linestyle='--', color='blue', linewidth=2, markersize=10)
plt.title('Customized Plot Style - how2matplotlib.com', fontsize=16)
plt.xlabel('X-axis', fontsize=12)
plt.ylabel('Y-axis', fontsize=12)
plt.grid(True, linestyle=':', alpha=0.7)
plt.show()
This example demonstrates how to combine Matplotlib.figure.Figure.set_edgecolor() with other styling options like custom markers, line styles, and grid properties to create a visually appealing plot.
Example 10: 3D Plot with Custom Edge Color
import matplotlib.pyplot as plt
import numpy as np
from mpl_toolkits.mplot3d import Axes3D

fig = plt.figure(figsize=(10, 8))
fig.set_edgecolor('cyan')
fig.set_linewidth(3)

ax = fig.add_subplot(111, projection='3d')

x = np.linspace(-5, 5, 100)
y = np.linspace(-5, 5, 100)
X, Y = np.meshgrid(x, y)
Z = np.sin(np.sqrt(X**2 + Y**2))

surf = ax.plot_surface(X, Y, Z, cmap='viridis')
ax.set_title('3D Surface Plot with Cyan Edge - how2matplotlib.com')
plt.colorbar(surf)
plt.show()
Output:
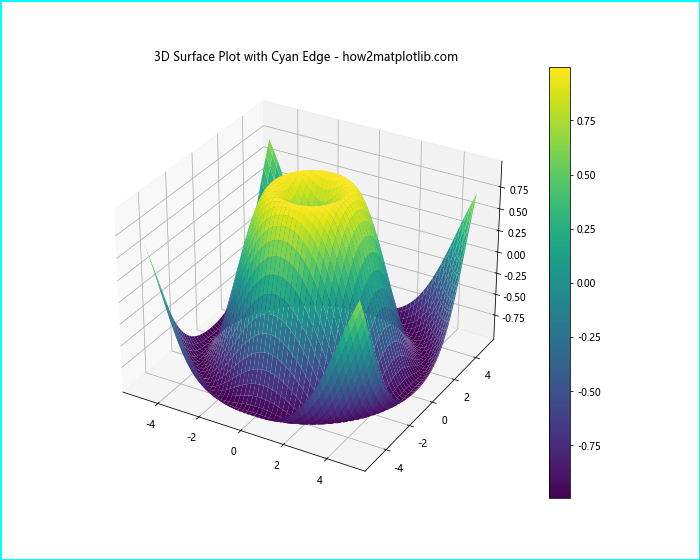
This example shows how to apply a custom edge color to a 3D surface plot using Matplotlib.figure.Figure.set_edgecolor().
Best Practices for Using set_edgecolor()
When working with Matplotlib.figure.Figure.set_edgecolor(), it’s important to keep some best practices in mind to ensure your plots are both visually appealing and effective in conveying information.
- Choose colors that complement your data and overall plot design.
- Consider color accessibility for viewers with color vision deficiencies.
- Use consistent edge colors across related plots for better visual coherence.
- Combine edge colors with appropriate line widths for optimal visibility.
- Test your plots on different backgrounds to ensure the edge color remains visible.
Example 11: Color-Blind Friendly Edge Colors
import matplotlib.pyplot as plt
import matplotlib.colors as mcolors

fig, (ax1, ax2) = plt.subplots(1, 2, figsize=(12, 5))
fig.set_edgecolor(mcolors.to_rgba('blue', alpha=0.5))
fig.set_linewidth(3)

x = [1, 2, 3, 4, 5]
y1 = [2, 4, 6, 8, 10]
y2 = [1, 3, 5, 7, 9]

ax1.plot(x, y1, color='#0072B2', label='Series 1')  # Blue
ax1.plot(x, y2, color='#D55E00', label='Series 2')  # Vermilion
ax1.set_title('Color-Blind Friendly Plot 1 - how2matplotlib.com')
ax1.legend()

ax2.bar(x, y1, color='#009E73', label='Series 1')  # Green
ax2.bar(x, y2, color='#CC79A7', bottom=y1, label='Series 2')  # Pink
ax2.set_title('Color-Blind Friendly Plot 2 - how2matplotlib.com')
ax2.legend()

plt.tight_layout()
plt.show()
Output:
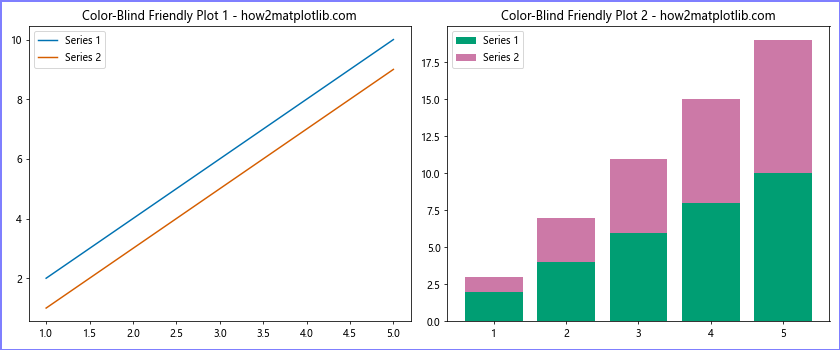
This example demonstrates the use of color-blind friendly colors for both the plot elements and the figure edge color using Matplotlib.figure.Figure.set_edgecolor().
Troubleshooting Common Issues with set_edgecolor()
When using Matplotlib.figure.Figure.set_edgecolor(), you might encounter some common issues. Let’s address these and provide solutions.
Issue 1: Edge Color Not Visible
If the edge color is not visible, it might be due to the figure’s background color or the edge width being too small.
Example 12: Ensuring Visible Edge Color
import matplotlib.pyplot as plt

fig = plt.figure(figsize=(8, 6))
fig.set_facecolor('white')  # Set a white background
fig.set_edgecolor('red')
fig.set_linewidth(5)  # Increase line width for visibility

plt.plot([1, 2, 3, 4], [1, 4, 2, 3])
plt.title('Plot with Visible Edge - how2matplotlib.com')
plt.show()
Output:

This example ensures that the edge color is visible by setting a contrasting background color and increasing the line width.
Issue 2: Edge Color Affecting Plot Elements
Sometimes, the edge color might affect other elements of your plot unintentionally.
Example 13: Isolating Edge Color Effect
import matplotlib.pyplot as plt

fig, ax = plt.subplots(figsize=(8, 6))
fig.set_edgecolor('green')
fig.set_linewidth(3)

# Add padding to prevent edge color from affecting plot elements
fig.tight_layout(pad=3.0)

ax.plot([1, 2, 3, 4], [1, 4, 2, 3], color='blue')
ax.set_title('Plot with Isolated Edge Color - how2matplotlib.com')
plt.show()
Output:
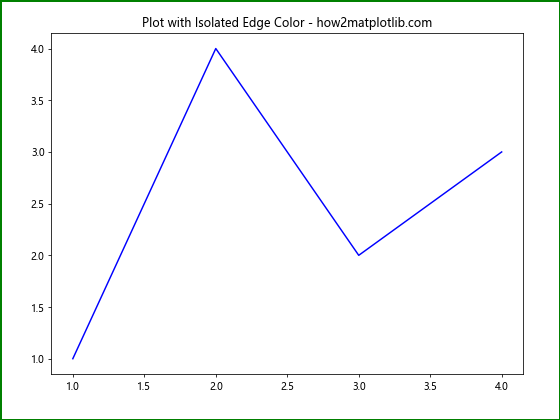
This example demonstrates how to isolate the edge color effect by adding padding to the figure layout.
Advanced Techniques with set_edgecolor()
Let’s explore some advanced techniques using Matplotlib.figure.Figure.set_edgecolor() to create more complex and visually appealing plots.
Example 14: Gradient Edge Color
import matplotlib.pyplot as plt
import matplotlib.colors as mcolors
import numpy as np

def gradient_edge(ax, start_color, end_color, linewidth=3):
    phi = np.linspace(0, 2*np.pi, 100)
    x = np.cos(phi)
    y = np.sin(phi)

    for i in range(99):
        color = mcolors.to_rgba(start_color, alpha=1-i/99) + mcolors.to_rgba(end_color, alpha=i/99)
        ax.plot(x[i:i+2], y[i:i+2], color=color, linewidth=linewidth, transform=ax.transAxes, clip_on=False)

fig, ax = plt.subplots(figsize=(8, 8))
gradient_edge(ax, 'blue', 'red')

ax.set_aspect('equal')
ax.axis('off')
ax.text(0.5, 0.5, 'Gradient Edge\nhow2matplotlib.com', ha='center', va='center', fontsize=16)

plt.show()
This advanced example creates a circular plot with a gradient edge color transitioning from blue to red.
Example 15: Animated Edge Color
import matplotlib.pyplot as plt
import matplotlib.animation as animation
import numpy as np

fig, ax = plt.subplots(figsize=(8, 6))

x = np.linspace(0, 2*np.pi, 100)
line, = ax.plot(x, np.sin(x))

ax.set_title('Animated Edge Color - how2matplotlib.com')

def animate(frame):
    color = plt.cm.hsv(frame / 100)
    fig.set_edgecolor(color)
    return line,

ani = animation.FuncAnimation(fig, animate, frames=100, interval=50, blit=True)
plt.show()
Output:
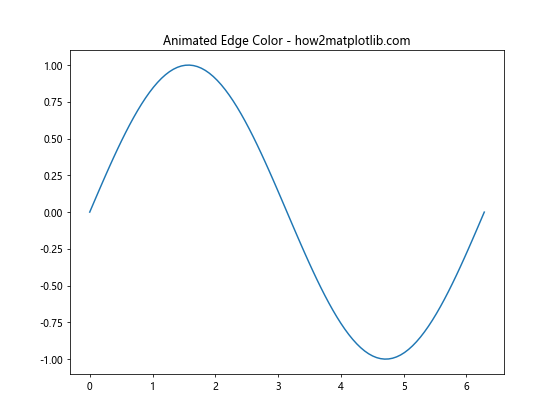
This example creates an animated plot where the edge color of the figure changes continuously, creating a dynamic visual effect.
Integrating set_edgecolor() with Data Analysis
Matplotlib.figure.Figure.set_edgecolor() can be effectively used in data analysis workflows to enhance the presentation of results. Let’s look at some examples that demonstrate this integration.
Example 16: Visualizing Time Series Data with Custom Edge
import matplotlib.pyplot as plt
import pandas as pd
import numpy as np

# Generate sample time series data
dates = pd.date_range(start='2023-01-01', end='2023-12-31', freq='D')
values = np.cumsum(np.random.randn(len(dates))) + 100

fig, ax = plt.subplots(figsize=(12, 6))
fig.set_edgecolor('navy')
fig.set_linewidth(3)

ax.plot(dates, values)
ax.set_title('Time Series Analysis - how2matplotlib.com')
ax.set_xlabel('Date')
ax.set_ylabel('Value')

plt.xticks(rotation=45)
plt.tight_layout()
plt.show()
Output:
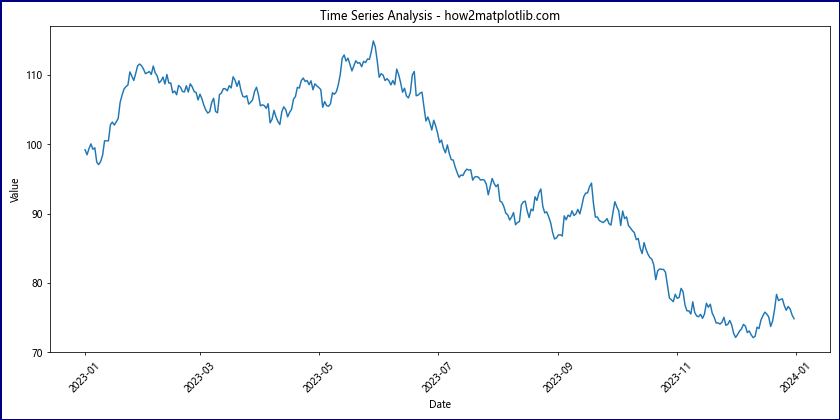
This example demonstrates how to use Matplotlib.figure.Figure.set_edgecolor() to enhance the presentation of time series data analysis results.
Example 17: Correlation Heatmap with Custom Edge
import matplotlib.pyplot as plt
import numpy as np
import seaborn as sns

# Generate sample correlation data
data = np.random.rand(5, 5)
corr_matrix = np.corrcoef(data)

fig, ax = plt.subplots(figsize=(10, 8))
fig.set_edgecolor('darkgreen')
fig.set_linewidth(4)

sns.heatmap(corr_matrix, annot=True, cmap='coolwarm', ax=ax)
ax.set_title('Correlation Heatmap - how2matplotlib.com')

plt.tight_layout()
plt.show()
Output:

This example shows how to apply a custom edge color to a correlation heatmap, which is a common visualization in data analysis.
Combining set_edgecolor() with Other Matplotlib Features
Matplotlib.figure.Figure.set_edgecolor() can be combined with other Matplotlib features to create more complex and informative visualizations.
Example 18: Subplots with Shared Edge Color and Custom Axes
import matplotlib.pyplot as plt
import numpy as np

fig = plt.figure(figsize=(12, 8))
fig.set_edgecolor('purple')
fig.set_linewidth(3)

# Create a 2x2 grid of subplots
gs = fig.add_gridspec(2, 2)

ax1 = fig.add_subplot(gs[0, 0])
ax2 = fig.add_subplot(gs[0, 1])
ax3 = fig.add_subplot(gs[1, :])

# Plot data in each subplot
x = np.linspace(0, 10, 100)
ax1.plot(x, np.sin(x))
ax1.set_title('Sine Wave - how2matplotlib.com')

ax2.plot(x, np.cos(x))
ax2.set_title('Cosine Wave - how2matplotlib.com')

ax3.plot(x, np.tan(x))
ax3.set_title('Tangent Wave - how2matplotlib.com')

plt.tight_layout()
plt.show()
Output:
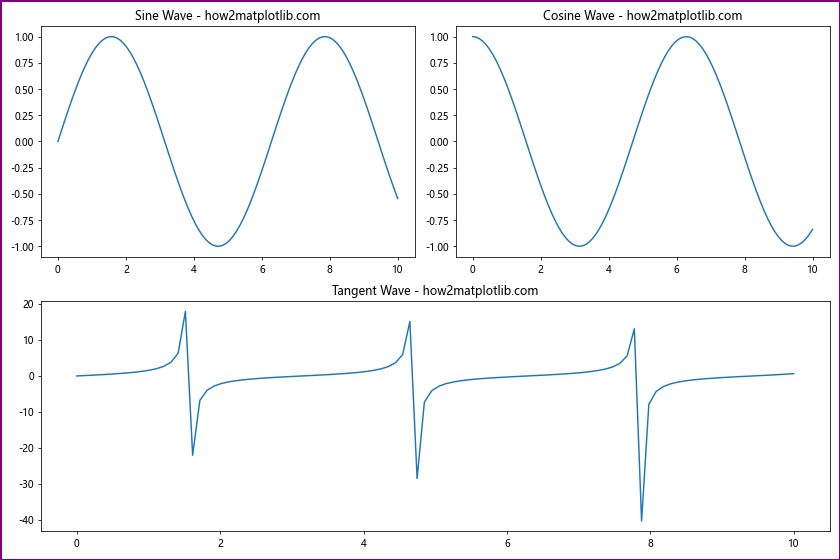
This example demonstrates how to create a complex layout with subplots while maintaining a consistent edge color using Matplotlib.figure.Figure.set_edgecolor().
Example 19: Polar Plot with Custom Edge Color
import matplotlib.pyplot as plt
import numpy as np

fig = plt.figure(figsize=(8, 8))
fig.set_edgecolor('orange')
fig.set_linewidth(3)

ax = fig.add_subplot(111, projection='polar')

r = np.arange(0, 2, 0.01)
theta = 2 * np.pi * r

ax.plot(theta, r)
ax.set_title('Polar Plot - how2matplotlib.com')

plt.tight_layout()
plt.show()
Output:
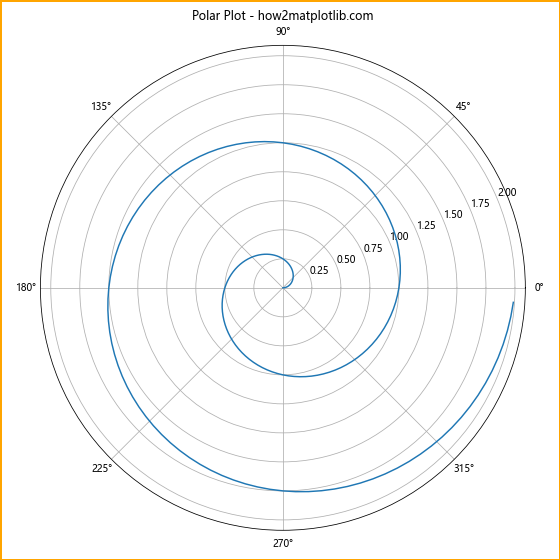
This example shows how to apply a custom edge color to a polar plot, demonstrating the versatility of Matplotlib.figure.Figure.set_edgecolor().
Best Practices for Color Selection in Data Visualization
When using Matplotlib.figure.Figure.set_edgecolor(), it’s important to consider color theory and best practices for data visualization. Here are some tips:
- Use contrasting colors for better visibility
- Consider color-blind friendly palettes
- Maintain consistency in color usage across related plots
- Use color to highlight important information
- Avoid using too many colors in a single visualization
Example 20: Color-Coded Scatter Plot with Custom Edge
import matplotlib.pyplot as plt
import numpy as np

fig, ax = plt.subplots(figsize=(10, 8))
fig.set_edgecolor('gray')
fig.set_linewidth(2)

# Generate sample data
np.random.seed(42)
x = np.random.rand(50)
y = np.random.rand(50)
colors = np.random.rand(50)
sizes = 1000 * np.random.rand(50)

scatter = ax.scatter(x, y, c=colors, s=sizes, alpha=0.6, cmap='viridis')
ax.set_title('Color-Coded Scatter Plot - how2matplotlib.com')
ax.set_xlabel('X-axis')
ax.set_ylabel('Y-axis')

plt.colorbar(scatter)
plt.tight_layout()
plt.show()
Output:
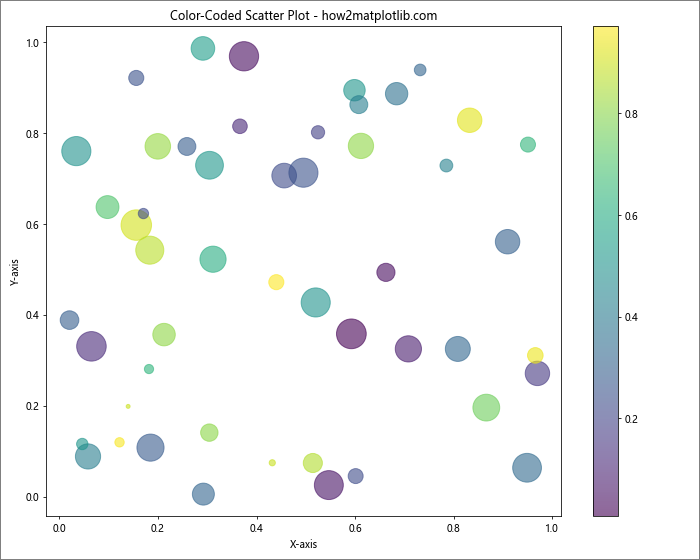
This example demonstrates how to create a color-coded scatter plot with a custom edge color, showcasing effective use of color in data visualization.
Conclusion
Matplotlib.figure.Figure.set_edgecolor() is a powerful tool for customizing the appearance of your plots in Python. By mastering this function, you can create visually appealing and professional-looking visualizations that effectively communicate your data insights. Remember to consider color theory, accessibility, and consistency when applying edge colors to your figures. With the examples and techniques provided in this guide, you’re now well-equipped to enhance your data visualization skills using Matplotlib.figure.Figure.set_edgecolor() in Python.