How to Create and Customize Matplotlib Heatmaps: A Comprehensive Guide
Matplotlib Heatmap is a powerful visualization tool that allows you to represent data in a two-dimensional grid using color-coded cells. Heatmaps are particularly useful for displaying patterns, correlations, and intensity variations in large datasets. In this comprehensive guide, we’ll explore various aspects of creating and customizing Matplotlib Heatmaps, providing detailed explanations and practical examples along the way.
Understanding Matplotlib Heatmaps
A Matplotlib Heatmap is a graphical representation of data where individual values are represented as colors. The data is typically organized in a matrix or table format, with each cell’s color corresponding to its value. Heatmaps are excellent for visualizing patterns, trends, and correlations in complex datasets.
Let’s start with a simple example to create a basic Matplotlib Heatmap:
import matplotlib.pyplot as plt
import numpy as np

# Create sample data
data = np.random.rand(10, 10)

# Create heatmap
plt.figure(figsize=(8, 6))
plt.imshow(data, cmap='viridis')
plt.colorbar(label='Values')
plt.title('Basic Matplotlib Heatmap - how2matplotlib.com')
plt.xlabel('X-axis')
plt.ylabel('Y-axis')
plt.show()
Output:
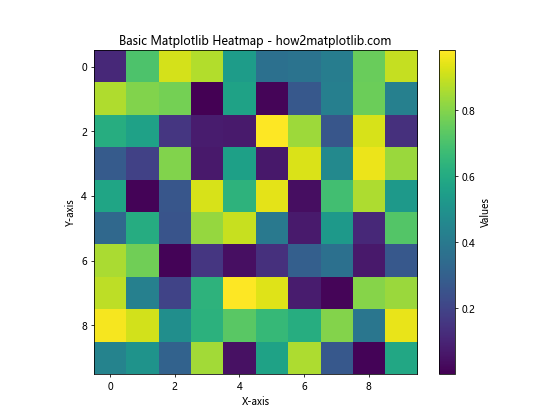
In this example, we create a 10×10 matrix of random values and use plt.imshow() to display it as a heatmap. The cmap parameter specifies the color scheme, and we add a colorbar to show the value range.
Creating Matplotlib Heatmaps with Different Data Types
Matplotlib Heatmaps can be created using various data types, including numpy arrays, pandas DataFrames, and lists. Let’s explore how to create heatmaps with different data structures.
Using Numpy Arrays
Numpy arrays are the most common data type used for creating Matplotlib Heatmaps. Here’s an example using a 2D numpy array:
import matplotlib.pyplot as plt
import numpy as np

# Create sample data
data = np.array([[1, 2, 3], [4, 5, 6], [7, 8, 9]])

# Create heatmap
plt.figure(figsize=(8, 6))
plt.imshow(data, cmap='coolwarm')
plt.colorbar(label='Values')
plt.title('Matplotlib Heatmap with Numpy Array - how2matplotlib.com')
plt.xticks(range(3), ['A', 'B', 'C'])
plt.yticks(range(3), ['X', 'Y', 'Z'])
plt.show()
Output:
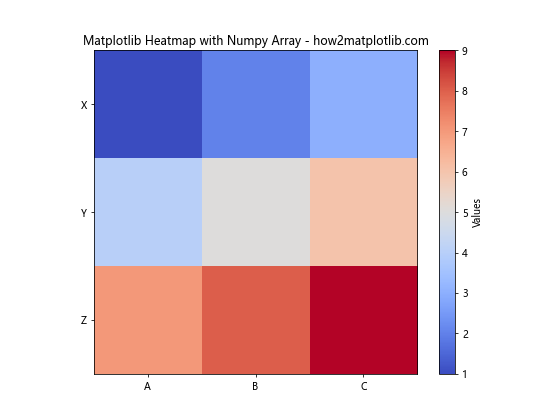
In this example, we create a 3×3 numpy array and use it to generate a heatmap. We also customize the x and y-axis labels using plt.xticks() and plt.yticks().
Using Pandas DataFrames
Pandas DataFrames are another popular data structure for creating Matplotlib Heatmaps. Here’s an example:
import matplotlib.pyplot as plt
import pandas as pd
import seaborn as sns

# Create sample data
data = pd.DataFrame({
    'A': [1, 2, 3],
    'B': [4, 5, 6],
    'C': [7, 8, 9]
}, index=['X', 'Y', 'Z'])

# Create heatmap
plt.figure(figsize=(8, 6))
sns.heatmap(data, annot=True, cmap='YlGnBu')
plt.title('Matplotlib Heatmap with Pandas DataFrame - how2matplotlib.com')
plt.show()
Output:
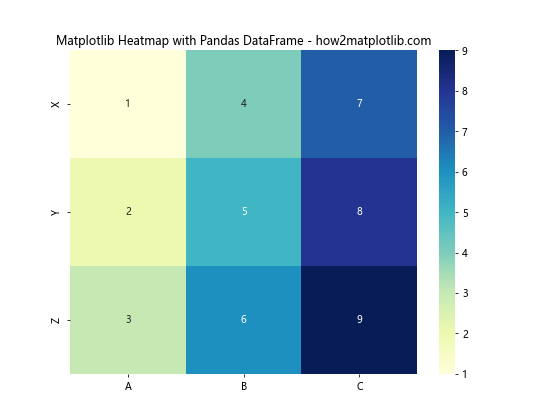
In this example, we use a pandas DataFrame to create the heatmap. We utilize the seaborn library, which provides a convenient heatmap() function that works well with pandas DataFrames. The annot=True parameter adds value annotations to each cell.
Customizing Matplotlib Heatmap Colors
One of the most important aspects of creating effective heatmaps is choosing the right color scheme. Matplotlib offers a wide range of color maps (cmaps) that can be used to represent data in heatmaps.
Using Built-in Matplotlib Colormaps
Matplotlib provides numerous built-in colormaps that can be used for heatmaps. Here’s an example showcasing different colormaps:
import matplotlib.pyplot as plt
import numpy as np

# Create sample data
data = np.random.rand(10, 10)

# Create heatmaps with different colormaps
fig, axes = plt.subplots(2, 2, figsize=(12, 10))
cmaps = ['viridis', 'plasma', 'inferno', 'magma']

for ax, cmap in zip(axes.flat, cmaps):
    im = ax.imshow(data, cmap=cmap)
    ax.set_title(f'{cmap.capitalize()} Colormap - how2matplotlib.com')
    plt.colorbar(im, ax=ax)

plt.tight_layout()
plt.show()
Output:
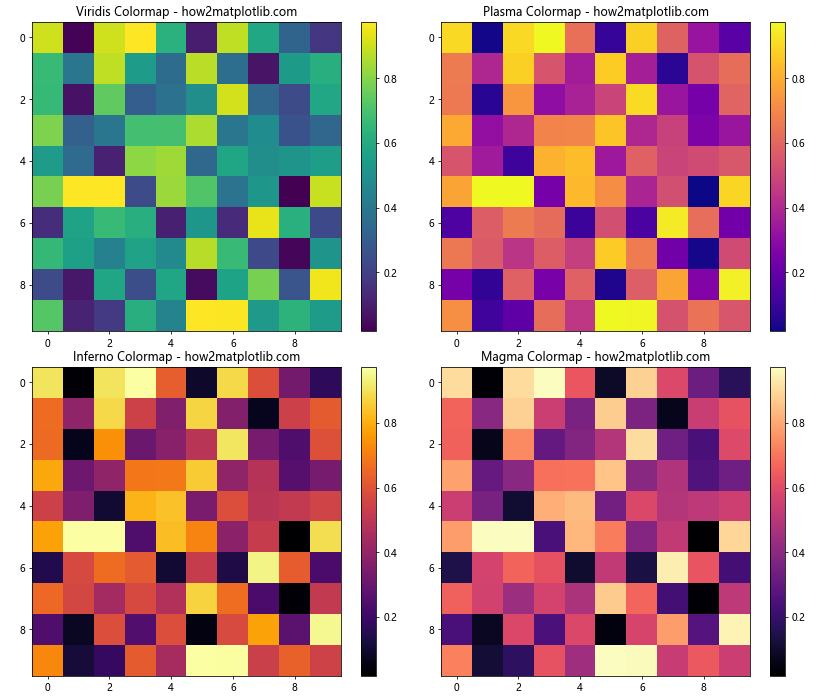
This example creates four heatmaps using different built-in colormaps: viridis, plasma, inferno, and magma. Each subplot demonstrates a different color scheme for the same dataset.
Creating Custom Matplotlib Colormaps
Sometimes, you may want to create a custom colormap tailored to your specific needs. Here’s an example of how to create and use a custom colormap:
import matplotlib.pyplot as plt
import numpy as np
from matplotlib.colors import LinearSegmentedColormap

# Create sample data
data = np.random.rand(10, 10)

# Define custom colors
colors = ['#FF0000', '#FFFF00', '#00FF00']  # Red, Yellow, Green
n_bins = 100  # Number of color gradations

# Create custom colormap
custom_cmap = LinearSegmentedColormap.from_list('custom_cmap', colors, N=n_bins)

# Create heatmap with custom colormap
plt.figure(figsize=(8, 6))
plt.imshow(data, cmap=custom_cmap)
plt.colorbar(label='Values')
plt.title('Matplotlib Heatmap with Custom Colormap - how2matplotlib.com')
plt.show()
Output:
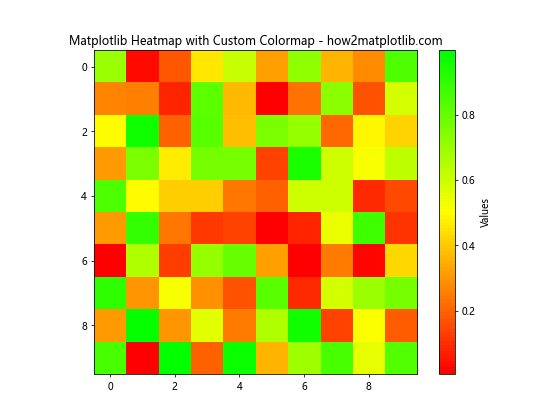
In this example, we create a custom colormap using LinearSegmentedColormap.from_list(). We define three colors (red, yellow, and green) and specify the number of color gradations. The resulting colormap is then applied to the heatmap.
Adding Annotations to Matplotlib Heatmaps
Annotations can greatly enhance the readability and interpretability of heatmaps. Let’s explore different ways to add annotations to Matplotlib Heatmaps.
Adding Value Annotations
One common way to annotate heatmaps is by adding the actual values to each cell. Here’s an example:
import matplotlib.pyplot as plt
import numpy as np

# Create sample data
data = np.random.randint(0, 100, size=(5, 5))

# Create heatmap with annotations
plt.figure(figsize=(8, 6))
im = plt.imshow(data, cmap='YlOrRd')

# Add colorbar
plt.colorbar(label='Values')

# Add annotations
for i in range(5):
    for j in range(5):
        text = plt.text(j, i, data[i, j], ha='center', va='center', color='black')

plt.title('Matplotlib Heatmap with Value Annotations - how2matplotlib.com')
plt.xlabel('X-axis')
plt.ylabel('Y-axis')
plt.show()
Output:
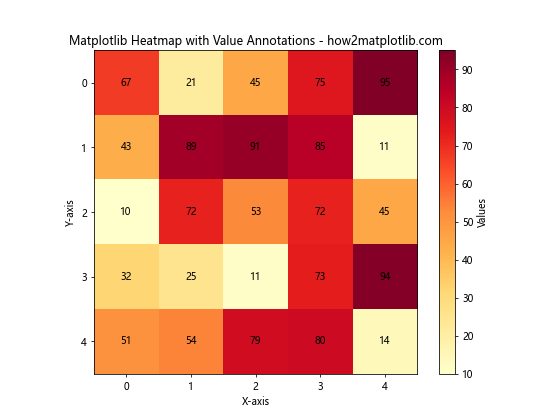
In this example, we use nested loops to add text annotations for each cell in the heatmap. The plt.text() function is used to place the values at the center of each cell.
Adding Custom Annotations
You can also add custom annotations to highlight specific areas or provide additional information. Here’s an example:
import matplotlib.pyplot as plt
import numpy as np

# Create sample data
data = np.random.rand(10, 10)

# Create heatmap
plt.figure(figsize=(10, 8))
im = plt.imshow(data, cmap='viridis')
plt.colorbar(label='Values')

# Add custom annotations
plt.annotate('Interesting Region', xy=(2, 3), xytext=(4, 5),
             arrowprops=dict(facecolor='white', shrink=0.05))

plt.title('Matplotlib Heatmap with Custom Annotations - how2matplotlib.com')
plt.xlabel('X-axis')
plt.ylabel('Y-axis')
plt.show()
Output:
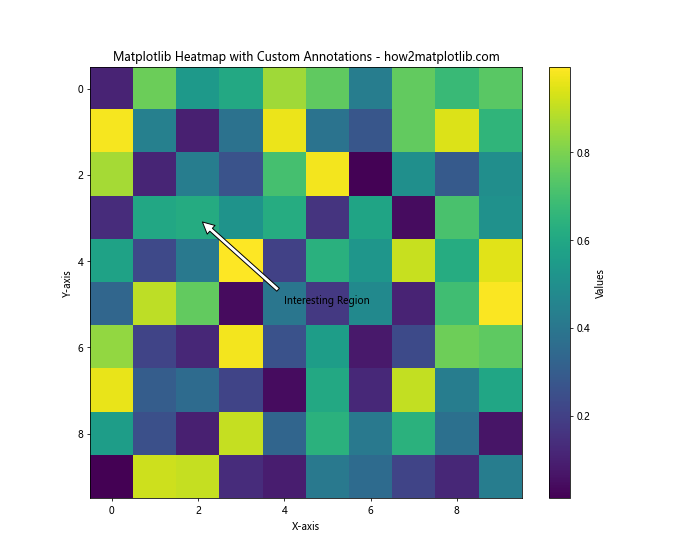
In this example, we use plt.annotate() to add a custom annotation with an arrow pointing to a specific region of interest in the heatmap.
Adjusting Matplotlib Heatmap Axes and Labels
Proper labeling and axis customization can significantly improve the clarity and interpretability of heatmaps. Let’s explore various ways to adjust axes and labels in Matplotlib Heatmaps.
Customizing Tick Labels
You can customize the tick labels on both axes to provide more meaningful information. Here’s an example:
import matplotlib.pyplot as plt
import numpy as np

# Create sample data
data = np.random.rand(5, 5)

# Create heatmap
plt.figure(figsize=(8, 6))
im = plt.imshow(data, cmap='coolwarm')

# Customize tick labels
x_labels = ['A', 'B', 'C', 'D', 'E']
y_labels = ['V', 'W', 'X', 'Y', 'Z']
plt.xticks(range(5), x_labels)
plt.yticks(range(5), y_labels)

plt.colorbar(label='Values')
plt.title('Matplotlib Heatmap with Custom Tick Labels - how2matplotlib.com')
plt.xlabel('Categories')
plt.ylabel('Groups')
plt.show()
Output:
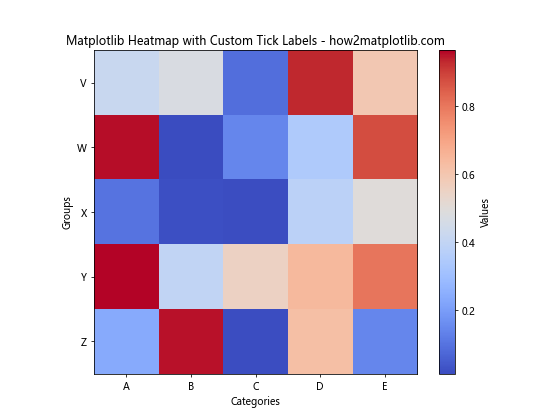
In this example, we use plt.xticks() and plt.yticks() to set custom labels for the x and y axes, respectively.
Rotating Tick Labels
For better readability, you might want to rotate the tick labels, especially when dealing with long labels. Here’s how to do it:
import matplotlib.pyplot as plt
import numpy as np

# Create sample data
data = np.random.rand(10, 10)

# Create heatmap
plt.figure(figsize=(12, 10))
im = plt.imshow(data, cmap='viridis')

# Customize and rotate tick labels
x_labels = [f'Category {i}' for i in range(1, 11)]
y_labels = [f'Group {chr(65+i)}' for i in range(10)]
plt.xticks(range(10), x_labels, rotation=45, ha='right')
plt.yticks(range(10), y_labels)

plt.colorbar(label='Values')
plt.title('Matplotlib Heatmap with Rotated Tick Labels - how2matplotlib.com')
plt.xlabel('Categories')
plt.ylabel('Groups')
plt.tight_layout()
plt.show()
Output:
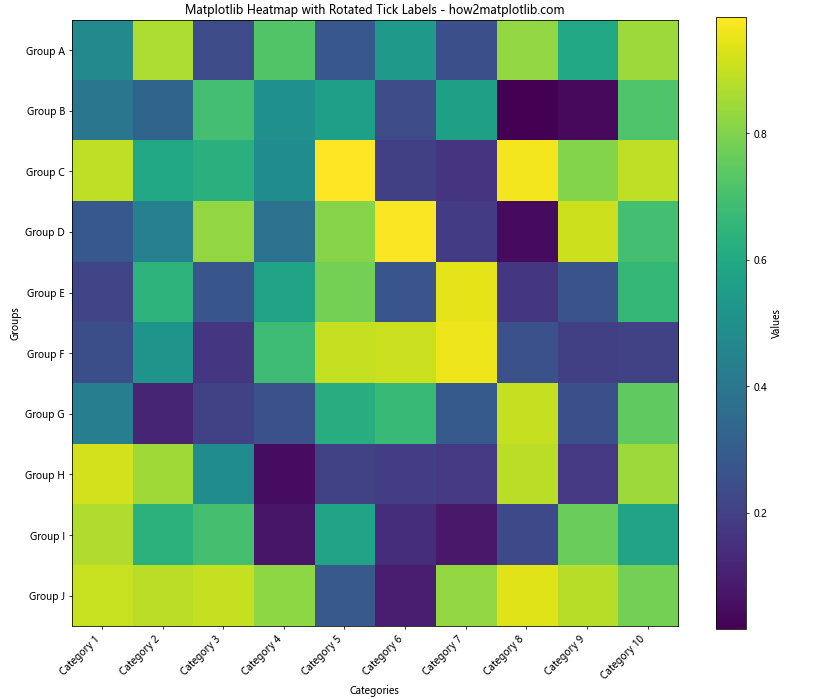
In this example, we rotate the x-axis labels by 45 degrees using the rotation parameter in plt.xticks(). The ha='right' parameter aligns the rotated labels to the right for better spacing.
Creating Masked Matplotlib Heatmaps
Sometimes, you may want to hide or mask certain values in your heatmap. Matplotlib allows you to create masked heatmaps using numpy’s masked arrays. Let’s see how to do this:
import matplotlib.pyplot as plt
import numpy as np

# Create sample data
data = np.random.rand(10, 10)

# Create mask
mask = np.random.choice([0, 1], size=data.shape, p=[0.8, 0.2])

# Apply mask to data
masked_data = np.ma.masked_array(data, mask)

# Create heatmap
plt.figure(figsize=(10, 8))
im = plt.imshow(masked_data, cmap='viridis')
plt.colorbar(label='Values')

plt.title('Matplotlib Masked Heatmap - how2matplotlib.com')
plt.xlabel('X-axis')
plt.ylabel('Y-axis')
plt.show()
Output:
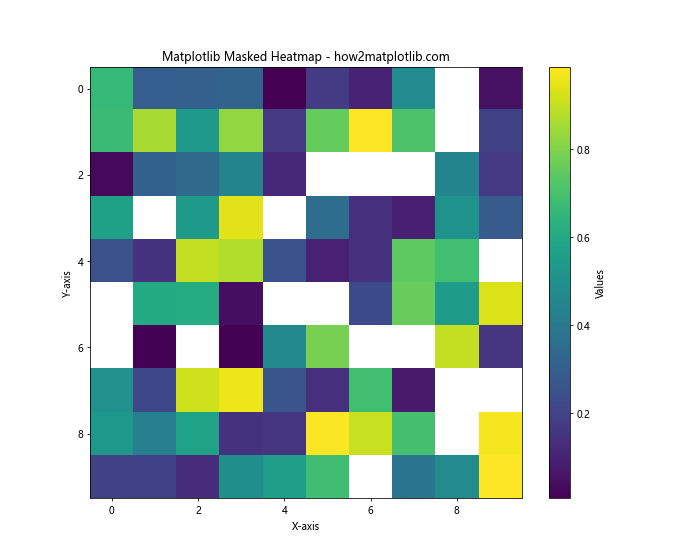
In this example, we create a random mask and apply it to our data using np.ma.masked_array(). The resulting heatmap will have some cells masked (hidden) based on the mask we created.
Creating Correlation Heatmaps with Matplotlib
Correlation heatmaps are a popular use case for heatmaps, especially in data analysis and machine learning. Let’s create a correlation heatmap using Matplotlib and seaborn:
import matplotlib.pyplot as plt
import seaborn as sns
import numpy as np
import pandas as pd

# Create sample data
np.random.seed(0)
data = pd.DataFrame(np.random.randn(10, 5), columns=['A', 'B', 'C', 'D', 'E'])

# Calculate correlation matrix
corr_matrix = data.corr()

# Create correlation heatmap
plt.figure(figsize=(10, 8))
sns.heatmap(corr_matrix, annot=True, cmap='coolwarm', vmin=-1, vmax=1, center=0)

plt.title('Correlation Heatmap - how2matplotlib.com')
plt.show()
Output:
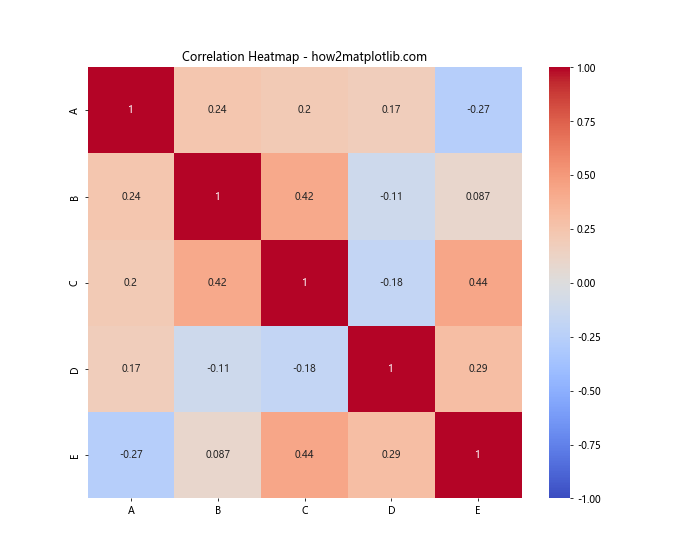
In this example, we create a sample dataset, calculate its correlation matrix using data.corr(), and then use seaborn’s heatmap() function to create a correlation heatmap. The annot=True parameter adds correlation values to each cell, and vmin, vmax, and center parameters ensure that the color scale is centered at 0.
Creating 3D Matplotlib Heatmaps
While traditional heatmaps are 2D, you can also create 3D heatmaps using Matplotlib. These can be useful for visualizing data with an additional dimension. Here’s an example:
import matplotlib.pyplot as plt
import numpy as np

# Create sample data
x = np.linspace(0, 5, 50)
y = np.linspace(0, 5, 50)
X, Y = np.meshgrid(x, y)
Z = np.sin(X) * np.cos(Y)

# Create 3D heatmap
fig = plt.figure(figsize=(10, 8))
ax = fig.add_subplot(111, projection='3d')
surf = ax.plot_surface(X, Y, Z, cmap='viridis')

plt.colorbar(surf, label='Values')
ax.set_title('3D Matplotlib Heatmap - how2matplotlib.com')
ax.set_xlabel('X-axis')
ax.set_ylabel('Y-axis')
ax.set_zlabel('Z-axis')

plt.show()
Output:
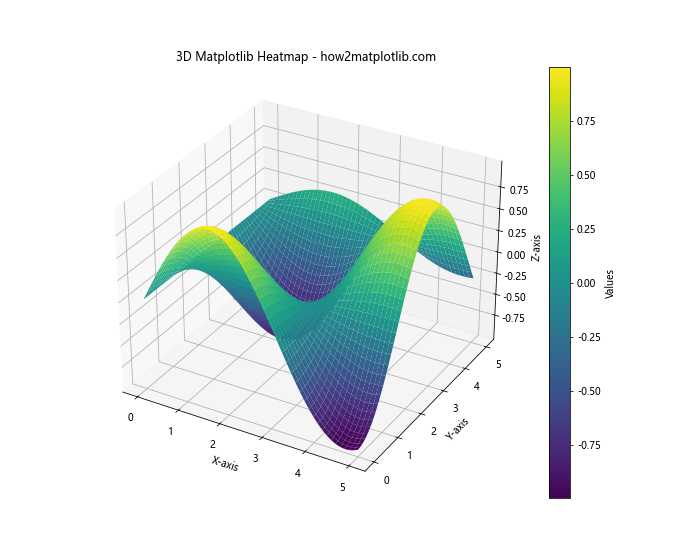
In this example, we create a 3D surface plot using ax.plot_surface(). The color of the surface represents the Z values, effectively creating a 3D heatmap.
Animating Matplotlib Heatmaps
Animated heatmaps can be useful for visualizing how data changes over time or through different iterations. Here’s an example of how to create an animated heatmap using Matplotlib:
import matplotlib.pyplot as plt
import numpy as np
from matplotlib.animation import FuncAnimation

# Create initial data
data = np.random.rand(10, 10)

# Create figure and axis
fig, ax = plt.subplots(figsize=(8, 6))
im = ax.imshow(data, cmap='viridis', animated=True)
plt.colorbar(im, label='Values')

# Update function for animation
def update(frame):
    data = np.random.rand(10, 10)
    im.set_array(data)
    ax.set_title(f'Animated Matplotlib Heatmap - Frame {frame} - how2matplotlib.com')
    return [im]

# Create animation
anim = FuncAnimation(fig, update, frames=50, interval=200, blit=True)

plt.show()
Output:
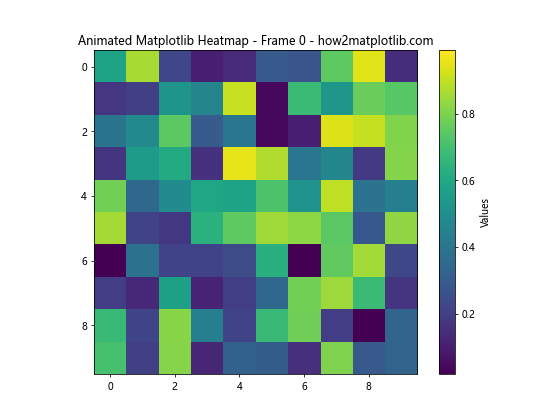
In this example, we use FuncAnimation to create an animated heatmap. The update function generates new random data for each frame, and the animation displays 50 frames with a 200ms interval between each frame.
Customizing Matplotlib Heatmap Colorbars
Colorbars are an essential component of heatmaps as they provide a reference for interpreting the colors. Let’s explore some ways to customize colorbars in Matplotlib Heatmaps:
import matplotlib.pyplot as plt
import numpy as np

# Create sample data
data = np.random.rand(10, 10)

# Create heatmap with custom colorbar
fig, ax = plt.subplots(figsize=(10, 8))
im = ax.imshow(data, cmap='viridis')

# Add colorbar with custom settings
cbar = plt.colorbar(im, ax=ax, orientation='vertical', pad=0.1)
cbar.set_label('Custom Colorbar Label - how2matplotlib.com', rotation=270, labelpad=15)
cbar.ax.tick_params(size=0)
cbar.outline.set_visible(False)

# Customize colorbar ticks
cbar.set_ticks([0, 0.25, 0.5, 0.75, 1])
cbar.set_ticklabels(['Low', 'Medium-Low', 'Medium', 'Medium-High', 'High'])

plt.title('Matplotlib Heatmap with Custom Colorbar - how2matplotlib.com')
plt.xlabel('X-axis')
plt.ylabel('Y-axis')
plt.show()
Output:
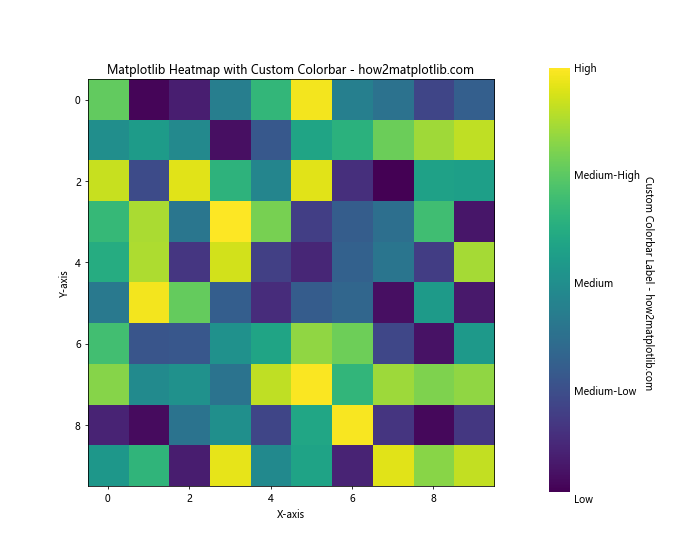
In this example, we customize various aspects of the colorbar:
- We set a custom label for the colorbar using
cbar.set_label(). - We remove the tick marks using
cbar.ax.tick_params(size=0). - We hide the colorbar outline with
cbar.outline.set_visible(False). - We set custom tick positions and labels using
cbar.set_ticks()andcbar.set_ticklabels().
Creating Heatmaps with Discrete Color Bins
Sometimes, you may want to group your data into discrete categories or bins. Here’s how to create a Matplotlib Heatmap with discrete color bins:
import matplotlib.pyplot as plt
import numpy as np
from matplotlib.colors import BoundaryNorm
from matplotlib.cm import get_cmap

# Create sample data
data = np.random.rand(10, 10)

# Define color bins and labels
bins = [0, 0.2, 0.4, 0.6, 0.8, 1]
labels = ['Very Low', 'Low', 'Medium', 'High', 'Very High']

# Create discrete colormap
cmap = get_cmap('viridis', len(bins) - 1)
norm = BoundaryNorm(bins, cmap.N)

# Create heatmap with discrete color bins
fig, ax = plt.subplots(figsize=(10, 8))
im = ax.imshow(data, cmap=cmap, norm=norm)

# Add colorbar
cbar = plt.colorbar(im, ax=ax, label='Categories', ticks=bins[:-1] + np.diff(bins)/2)
cbar.set_ticklabels(labels)

plt.title('Matplotlib Heatmap with Discrete Color Bins - how2matplotlib.com')
plt.xlabel('X-axis')
plt.ylabel('Y-axis')
plt.show()
Output:
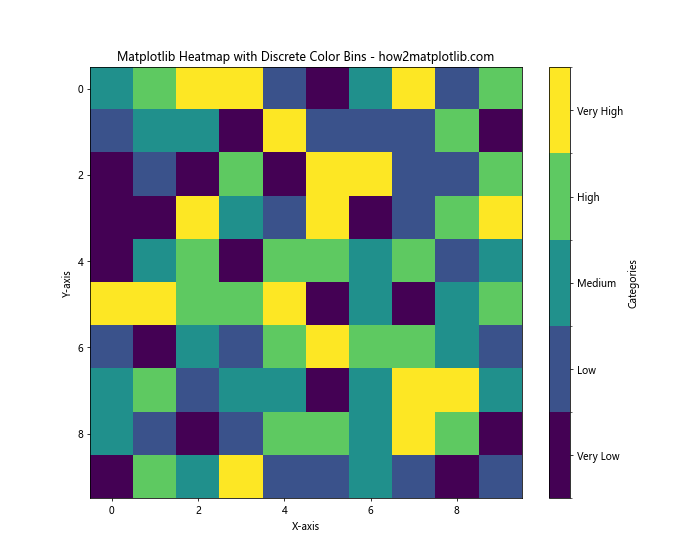
In this example, we use BoundaryNorm to create discrete color bins. We define the bin edges and corresponding labels, then use get_cmap() to create a discrete colormap with the specified number of bins.
Combining Heatmaps with Other Plot Types
Matplotlib’s flexibility allows you to combine heatmaps with other types of plots to create more informative visualizations. Here’s an example that combines a heatmap with line plots:
import matplotlib.pyplot as plt
import numpy as np

# Create sample data
data = np.random.rand(10, 10)
x = np.arange(10)
y1 = np.random.rand(10)
y2 = np.random.rand(10)

# Create figure and axes
fig, (ax1, ax2, ax3) = plt.subplots(1, 3, figsize=(15, 5), gridspec_kw={'width_ratios': [4, 1, 1]})

# Create heatmap
im = ax1.imshow(data, cmap='viridis')
ax1.set_title('Heatmap - how2matplotlib.com')
ax1.set_xlabel('X-axis')
ax1.set_ylabel('Y-axis')

# Add colorbar
cbar = plt.colorbar(im, ax=ax1, label='Values')

# Create line plots
ax2.plot(y1, x)
ax2.set_title('Line Plot 1')
ax2.set_xlabel('Values')
ax2.set_yticks([])

ax3.plot(y2, x)
ax3.set_title('Line Plot 2')
ax3.set_xlabel('Values')
ax3.set_yticks([])

plt.tight_layout()
plt.show()
Output:
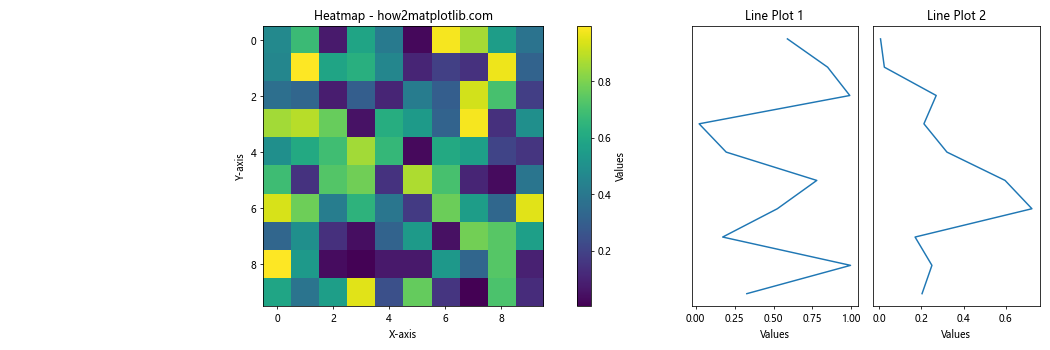
In this example, we create a figure with three subplots: a heatmap in the center and two line plots on the sides. This combination allows for a more comprehensive view of the data.
Creating Interactive Matplotlib Heatmaps
While Matplotlib itself doesn’t provide built-in interactivity, you can use libraries like mpld3 to create interactive heatmaps. Here’s an example:
import matplotlib.pyplot as plt
import numpy as np
import mpld3

# Create sample data
data = np.random.rand(10, 10)

# Create heatmap
fig, ax = plt.subplots(figsize=(10, 8))
im = ax.imshow(data, cmap='viridis')

# Add colorbar
cbar = plt.colorbar(im, ax=ax, label='Values')

plt.title('Interactive Matplotlib Heatmap - how2matplotlib.com')
plt.xlabel('X-axis')
plt.ylabel('Y-axis')

# Make the plot interactive
mpld3.enable_notebook()
mpld3.display(fig)
This example creates an interactive heatmap that allows zooming and panning. Note that you’ll need to run this in a Jupyter notebook or similar environment that supports interactive plots.
Matplotlib Heatmap Conclusion
Matplotlib Heatmaps are a versatile and powerful tool for visualizing complex datasets. From basic heatmaps to advanced customizations, correlations, and even 3D representations, Matplotlib provides a wide range of options to create informative and visually appealing heatmaps.
In this comprehensive guide, we’ve covered various aspects of creating and customizing Matplotlib Heatmaps, including:
- Creating basic heatmaps
- Customizing colors and colormaps
- Adding annotations and labels
- Adjusting axes and tick labels
- Creating masked heatmaps
- Generating correlation heatmaps
- Exploring 3D heatmaps
- Animating heatmaps
- Customizing colorbars
- Using logarithmic color scales
- Creating discrete color bins
- Handling missing data
- Creating heatmaps with unequal cell sizes
- Combining heatmaps with other plot types
- Creating interactive heatmaps
By mastering these techniques, you’ll be well-equipped to create effective and informative heatmaps for your data visualization needs. Remember to experiment with different options and customizations to find the best representation for your specific dataset and audience.