How to Master plt.subplots in Matplotlib
plt.subplots is a powerful function in Matplotlib that allows you to create multiple subplots within a single figure. This versatile tool is essential for data visualization and comparison in Python. In this comprehensive guide, we’ll explore the ins and outs of plt.subplots, providing detailed explanations and practical examples to help you master this crucial aspect of Matplotlib.
plt.subplots Recommended Articles
Understanding the Basics of plt.subplots
plt.subplots is a function that returns a figure object and an array of axes objects. It’s commonly used to create a grid of subplots, which is particularly useful when you want to display multiple related plots in a single figure. The basic syntax of plt.subplots is as follows:
import matplotlib.pyplot as plt

fig, axs = plt.subplots(nrows, ncols)
Here, nrows and ncols specify the number of rows and columns in the subplot grid. Let’s start with a simple example to illustrate this concept:
import matplotlib.pyplot as plt
import numpy as np

fig, axs = plt.subplots(2, 2)
x = np.linspace(0, 10, 100)

axs[0, 0].plot(x, np.sin(x))
axs[0, 0].set_title('Sine Wave - how2matplotlib.com')

axs[0, 1].plot(x, np.cos(x))
axs[0, 1].set_title('Cosine Wave - how2matplotlib.com')

axs[1, 0].plot(x, np.exp(x))
axs[1, 0].set_title('Exponential - how2matplotlib.com')

axs[1, 1].plot(x, np.log(x))
axs[1, 1].set_title('Logarithm - how2matplotlib.com')

plt.tight_layout()
plt.show()
Output:
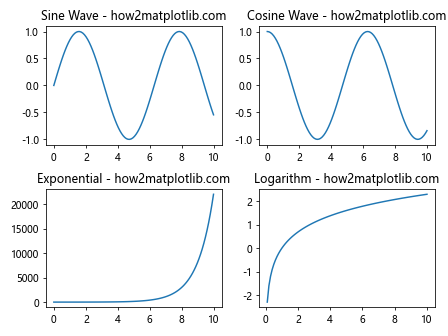
In this example, we create a 2×2 grid of subplots using plt.subplots(2, 2). We then plot different functions in each subplot. The axs variable is a 2D array of Axes objects, which we can index to access individual subplots.
Customizing Subplot Layouts with plt.subplots
plt.subplots offers various parameters to customize the layout of your subplots. Let’s explore some of these options:
Adjusting Subplot Spacing
You can control the spacing between subplots using the hspace and wspace parameters:
import matplotlib.pyplot as plt
import numpy as np

fig, axs = plt.subplots(2, 2, figsize=(10, 8))
fig.suptitle('Customized Spacing - how2matplotlib.com', fontsize=16)

x = np.linspace(0, 10, 100)

axs[0, 0].plot(x, np.sin(x))
axs[0, 1].plot(x, np.cos(x))
axs[1, 0].plot(x, np.exp(x))
axs[1, 1].plot(x, np.log(x))

plt.subplots_adjust(hspace=0.4, wspace=0.4)
plt.show()
Output:
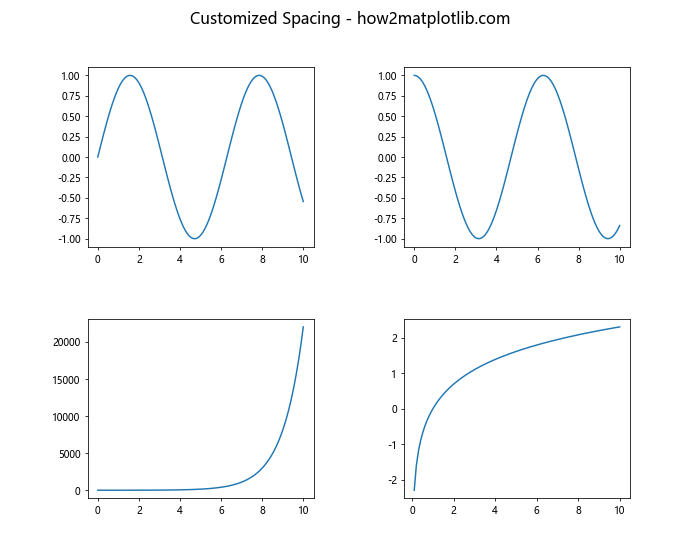
In this example, we use plt.subplots_adjust() to increase the horizontal and vertical spacing between subplots.
Creating Subplots with Different Sizes
plt.subplots allows you to create subplots of different sizes using the gridspec_kw parameter:
import matplotlib.pyplot as plt
import numpy as np

fig, axs = plt.subplots(2, 2, figsize=(10, 8),
                        gridspec_kw={'height_ratios': [2, 1],
                                     'width_ratios': [1, 2]})
fig.suptitle('Different Sized Subplots - how2matplotlib.com', fontsize=16)

x = np.linspace(0, 10, 100)

axs[0, 0].plot(x, np.sin(x))
axs[0, 1].plot(x, np.cos(x))
axs[1, 0].plot(x, np.exp(x))
axs[1, 1].plot(x, np.log(x))

plt.tight_layout()
plt.show()
Output:
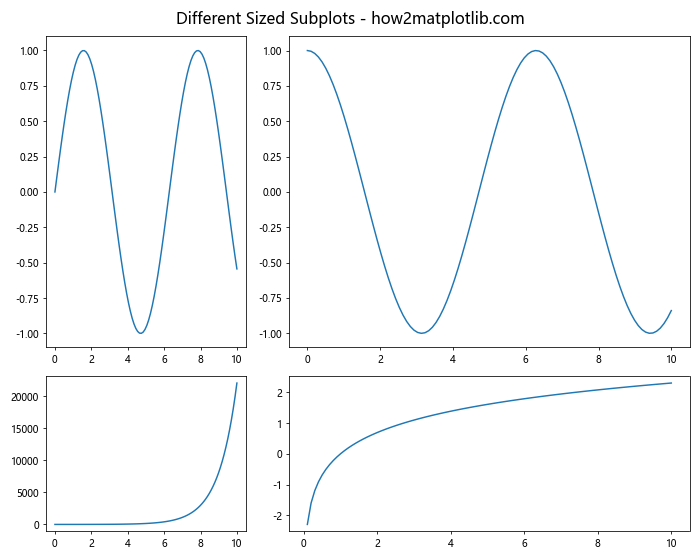
This example creates a 2×2 grid where the top row is twice as tall as the bottom row, and the right column is twice as wide as the left column.
Advanced Techniques with plt.subplots
Let’s dive into some more advanced techniques using plt.subplots:
Creating Subplots with Shared Axes
plt.subplots allows you to create subplots with shared x or y axes:
import matplotlib.pyplot as plt
import numpy as np

fig, (ax1, ax2) = plt.subplots(2, 1, sharex=True, figsize=(8, 6))
fig.suptitle('Shared X-axis - how2matplotlib.com', fontsize=16)

x = np.linspace(0, 10, 100)

ax1.plot(x, np.sin(x))
ax1.set_ylabel('Sine')

ax2.plot(x, np.cos(x))
ax2.set_ylabel('Cosine')
ax2.set_xlabel('X-axis')

plt.tight_layout()
plt.show()
Output:
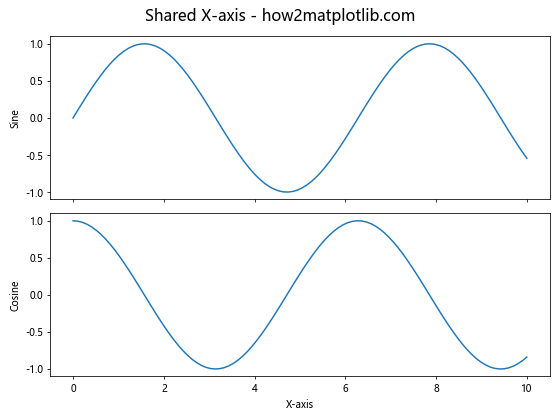
In this example, we create two subplots with a shared x-axis using the sharex=True parameter.
Creating Irregular Subplot Layouts
plt.subplots can be combined with gridspec to create more complex layouts:
import matplotlib.pyplot as plt
import matplotlib.gridspec as gridspec
import numpy as np

fig = plt.figure(figsize=(10, 8))
gs = gridspec.GridSpec(3, 3)

ax1 = fig.add_subplot(gs[0, :])
ax2 = fig.add_subplot(gs[1, :-1])
ax3 = fig.add_subplot(gs[1:, -1])
ax4 = fig.add_subplot(gs[-1, 0])
ax5 = fig.add_subplot(gs[-1, -2])

fig.suptitle('Irregular Subplot Layout - how2matplotlib.com', fontsize=16)

x = np.linspace(0, 10, 100)

ax1.plot(x, np.sin(x))
ax2.plot(x, np.cos(x))
ax3.plot(x, np.tan(x))
ax4.plot(x, np.exp(x))
ax5.plot(x, np.log(x))

plt.tight_layout()
plt.show()
Output:
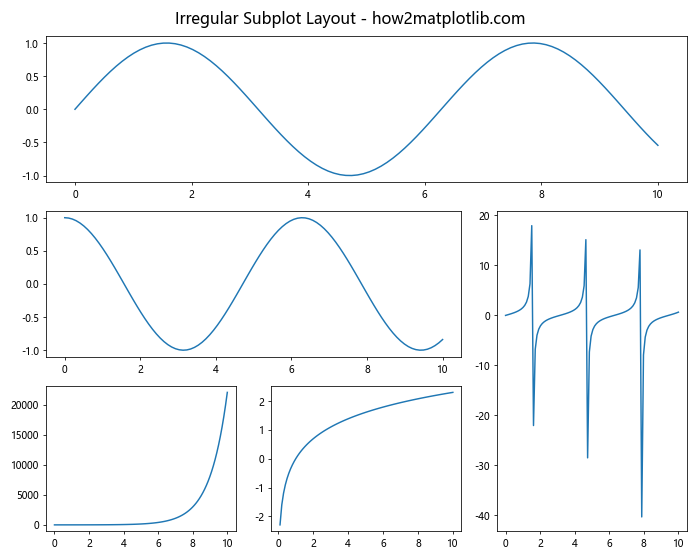
This example demonstrates how to create an irregular layout using gridspec in combination with plt.subplots.
Enhancing Visualizations with plt.subplots
plt.subplots is not just about creating multiple plots; it’s also about enhancing your visualizations. Let’s explore some techniques to make your plots more informative and visually appealing:
Adding Colorbars to Subplots
When working with color-mapped data, adding colorbars can greatly enhance the readability of your plots:
import matplotlib.pyplot as plt
import numpy as np

fig, (ax1, ax2) = plt.subplots(1, 2, figsize=(12, 5))
fig.suptitle('Subplots with Colorbars - how2matplotlib.com', fontsize=16)

x = np.linspace(-3, 3, 100)
y = np.linspace(-3, 3, 100)
X, Y = np.meshgrid(x, y)
Z1 = np.exp(-(X**2 + Y**2))
Z2 = np.exp(-((X-1)**2 + (Y-1)**2))

im1 = ax1.imshow(Z1, extent=[-3, 3, -3, 3], origin='lower', cmap='viridis')
ax1.set_title('Gaussian Function')
fig.colorbar(im1, ax=ax1)

im2 = ax2.imshow(Z2, extent=[-3, 3, -3, 3], origin='lower', cmap='plasma')
ax2.set_title('Shifted Gaussian')
fig.colorbar(im2, ax=ax2)

plt.tight_layout()
plt.show()
Output:
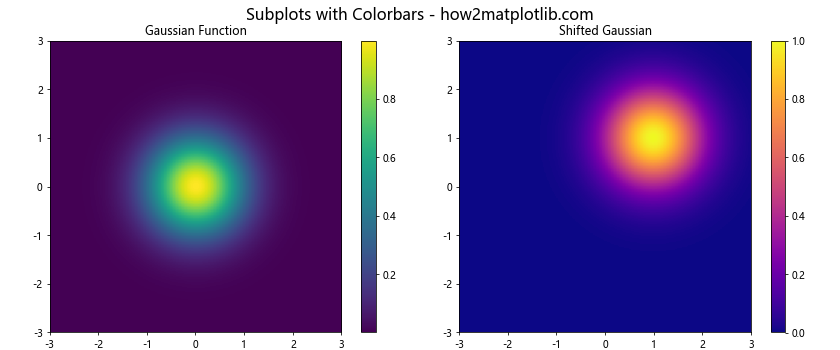
This example demonstrates how to add colorbars to subplots when visualizing 2D data.
Creating Subplots with Different Scales
Sometimes, you may need to plot data with vastly different scales on the same figure:
import matplotlib.pyplot as plt
import numpy as np

fig, (ax1, ax2) = plt.subplots(2, 1, figsize=(8, 8))
fig.suptitle('Subplots with Different Scales - how2matplotlib.com', fontsize=16)

t = np.arange(0.01, 10.0, 0.01)

ax1.semilogy(t, np.exp(-t/5.0))
ax1.set_ylabel('Semilogy')
ax1.grid(True)

ax2.semilogx(t, np.sin(2*np.pi*t))
ax2.set_ylabel('Semilogx')
ax2.grid(True)

plt.tight_layout()
plt.show()
Output:
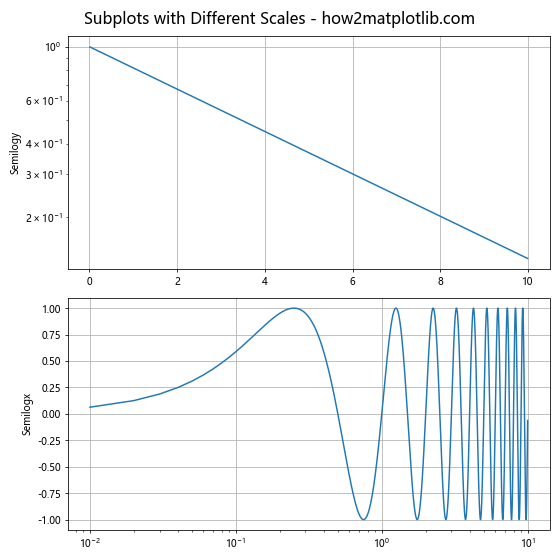
This example shows how to create subplots with different scales (logarithmic and linear) using plt.subplots.
Mastering Subplot Annotations with plt.subplots
Annotations can significantly improve the clarity and informativeness of your plots. Let’s explore how to add various types of annotations to subplots:
Adding Text Annotations to Subplots
Text annotations can provide additional context or highlight specific features in your plots:
import matplotlib.pyplot as plt
import numpy as np

fig, axs = plt.subplots(2, 2, figsize=(12, 10))
fig.suptitle('Subplots with Text Annotations - how2matplotlib.com', fontsize=16)

x = np.linspace(0, 10, 100)

axs[0, 0].plot(x, np.sin(x))
axs[0, 0].set_title('Sine Wave')
axs[0, 0].annotate('Peak', xy=(np.pi/2, 1), xytext=(4, 0.8),
                   arrowprops=dict(facecolor='black', shrink=0.05))

axs[0, 1].plot(x, np.cos(x))
axs[0, 1].set_title('Cosine Wave')
axs[0, 1].text(5, 0, 'Zero Crossing', fontsize=12, ha='center')

axs[1, 0].plot(x, np.exp(x))
axs[1, 0].set_title('Exponential')
axs[1, 0].annotate('Rapid Growth', xy=(8, np.exp(8)), xytext=(6, 1000),
                   arrowprops=dict(facecolor='red', shrink=0.05))

axs[1, 1].plot(x, np.log(x))
axs[1, 1].set_title('Logarithm')
axs[1, 1].text(5, 1, 'Slow Growth', fontsize=12, rotation=15)

plt.tight_layout()
plt.show()
Output:
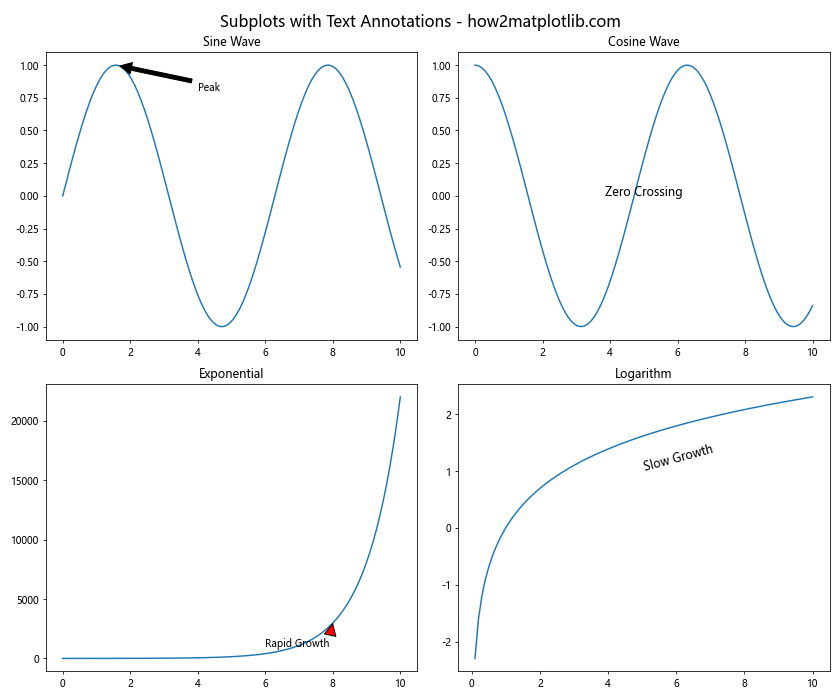
This example demonstrates various ways to add text annotations to subplots, including arrows and rotated text.
Adding Legends to Subplots
Legends are crucial for distinguishing between multiple data series in a single plot:
import matplotlib.pyplot as plt
import numpy as np

fig, axs = plt.subplots(2, 2, figsize=(12, 10))
fig.suptitle('Subplots with Legends - how2matplotlib.com', fontsize=16)

x = np.linspace(0, 10, 100)

axs[0, 0].plot(x, np.sin(x), label='Sine')
axs[0, 0].plot(x, np.cos(x), label='Cosine')
axs[0, 0].set_title('Trigonometric Functions')
axs[0, 0].legend()

axs[0, 1].plot(x, x, label='Linear')
axs[0, 1].plot(x, x**2, label='Quadratic')
axs[0, 1].plot(x, x**3, label='Cubic')
axs[0, 1].set_title('Polynomial Functions')
axs[0, 1].legend()

axs[1, 0].plot(x, np.exp(x), label='Exponential')
axs[1, 0].plot(x, np.log(x), label='Logarithm')
axs[1, 0].set_title('Exponential and Logarithm')
axs[1, 0].legend()

axs[1, 1].plot(x, np.sqrt(x), label='Square Root')
axs[1, 1].plot(x, x**(1/3), label='Cube Root')
axs[1, 1].set_title('Root Functions')
axs[1, 1].legend()

plt.tight_layout()
plt.show()
Output:
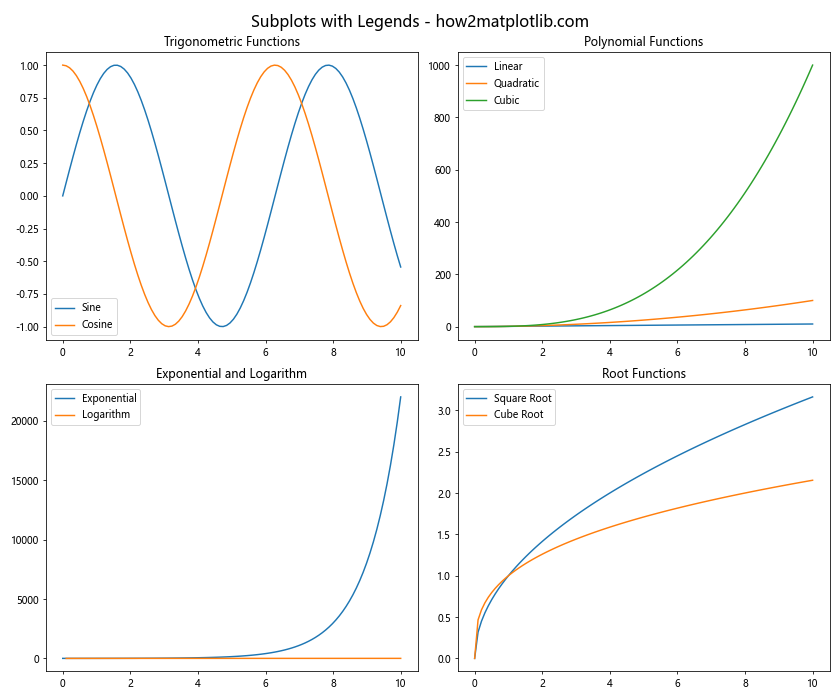
This example shows how to add legends to multiple subplots, each containing multiple data series.
Advanced Customization Techniques with plt.subplots
As you become more comfortable with plt.subplots, you can start exploring more advanced customization techniques to create truly unique and informative visualizations:
Creating Subplots with Custom Projections
plt.subplots allows you to create subplots with different projections, which is particularly useful for geographical data or polar plots:
import matplotlib.pyplot as plt
import numpy as np

fig, axs = plt.subplots(2, 2, figsize=(12, 10),
                        subplot_kw={'projection': 'polar'})
fig.suptitle('Polar Subplots - how2matplotlib.com', fontsize=16)

r = np.linspace(0, 2, 100)
theta = 2 * np.pi * r

axs[0, 0].plot(theta, r)
axs[0, 0].set_title('Linear')

axs[0, 1].plot(theta, r**2)
axs[0, 1].set_title('Quadratic')

axs[1, 0].plot(theta, np.sqrt(r))
axs[1, 0].set_title('Square Root')

axs[1, 1].plot(theta, np.log(r+1))
axs[1, 1].set_title('Logarithmic')

plt.tight_layout()
plt.show()
Output:
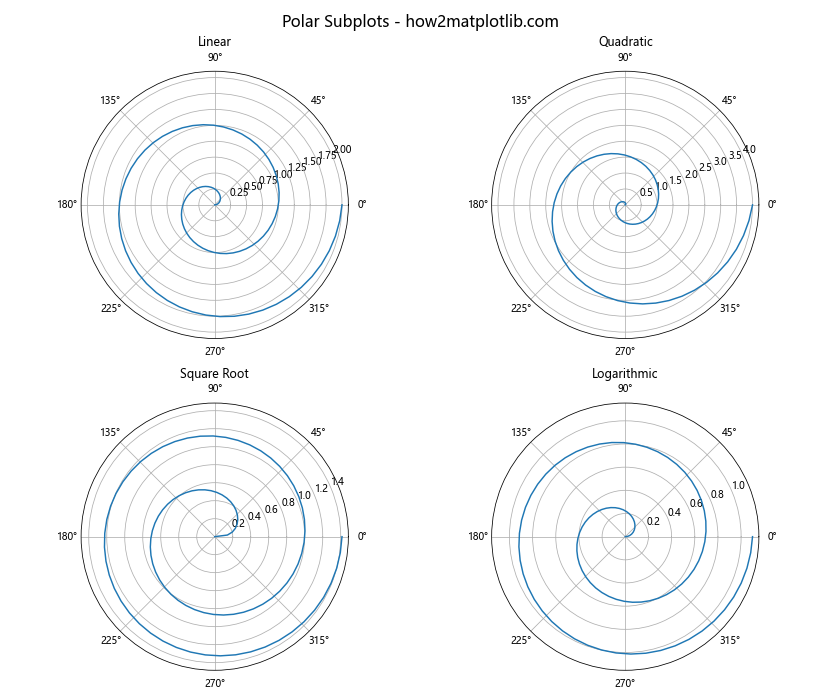
This example creates a 2×2 grid of polar subplots, demonstrating how to use custom projections with plt.subplots.
Optimizing plt.subplots for Performance
When working with large datasets or creating complex visualizations, optimizing your use of plt.subplots can significantly improve performance:
Using plt.subplots with Large Datasets
When plotting large datasets, it’s important to use efficient plotting methods:
import matplotlib.pyplot as plt
import numpy as np

fig, axs = plt.subplots(2, 2, figsize=(12, 10))
fig.suptitle('Efficient Plotting with Large Datasets - how2matplotlib.com', fontsize=16)

x = np.linspace(0, 10, 1000000)

axs[0, 0].plot(x, np.sin(x), 'r-', lw=0.5, alpha=0.5)
axs[0, 0].set_title('Line Plot')

axs[0, 1].scatter(x[::1000], np.cos(x[::1000]), s=1, alpha=0.5)
axs[0, 1].set_title('Scatter Plot')

axs[1, 0].hexbin(x, np.tan(x), gridsize=50, cmap='viridis')
axs[1, 0].set_title('Hexbin Plot')

h, xedges, yedges = np.histogram2d(x, np.exp(x/10), bins=50)
axs[1, 1].imshow(h.T, extent=[xedges[0], xedges[-1], yedges[0], yedges[-1]],
                 origin='lower', aspect='auto', cmap='plasma')
axs[1, 1].set_title('2D Histogram')

plt.tight_layout()
plt.show()
Output:
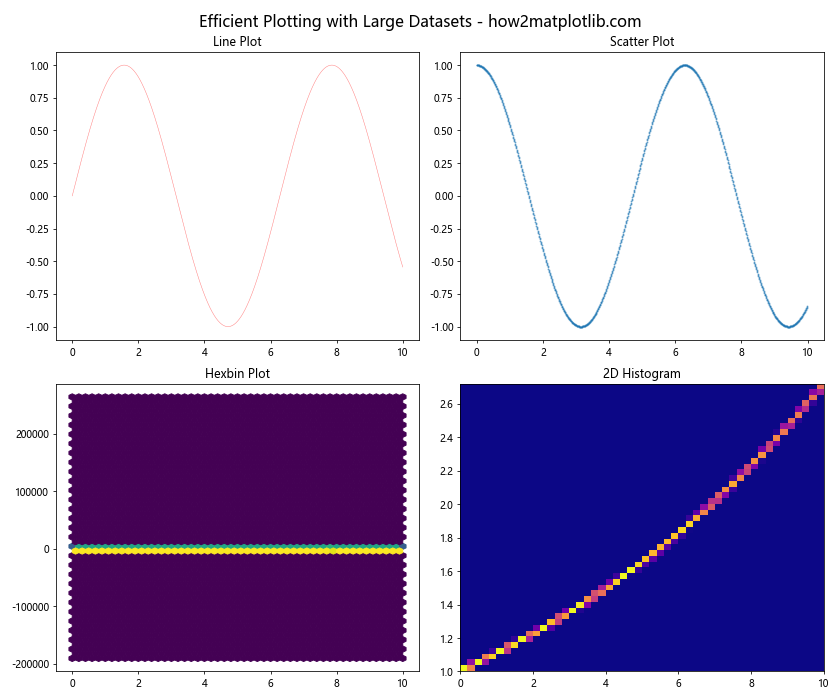
This example demonstrates different efficient plotting methods for large datasets using plt.subplots.
Using plt.subplots with Animation
plt.subplots can also be used to create animated plots:
import matplotlib.pyplot as plt
import matplotlib.animation as animation
import numpy as np

fig, ax = plt.subplots(figsize=(8, 6))
fig.suptitle('Animated Sine Wave - how2matplotlib.com', fontsize=16)

x = np.linspace(0, 2*np.pi, 100)
line, = ax.plot(x, np.sin(x))

def animate(i):
    line.set_ydata(np.sin(x + i/10))
    return line,

ani = animation.FuncAnimation(fig, animate, frames=100, interval=50, blit=True)

plt.tight_layout()
plt.show()
Output:
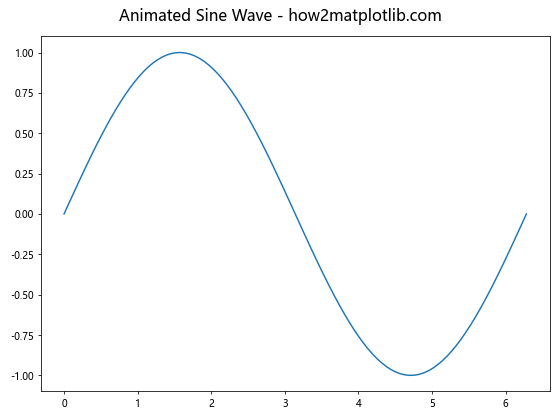
This example creates an animated sine wave using plt.subplots and matplotlib’s animation module.
Troubleshooting Common Issues with plt.subplots
When working with plt.subplots, you may encounter some common issues. Here are some problems and their solutions:
Overlapping Subplots
If your subplots are overlapping, you can adjust the spacing using plt.subplots_adjust():
import matplotlib.pyplot as plt
import numpy as np

fig, axs = plt.subplots(2, 2, figsize=(10, 8))
fig.suptitle('Adjusted Subplot Spacing - how2matplotlib.com', fontsize=16)

x = np.linspace(0, 10, 100)

for ax in axs.flat:
    ax.plot(x, np.random.rand(100))

plt.subplots_adjust(wspace=0.4, hspace=0.4)
plt.show()
Output:
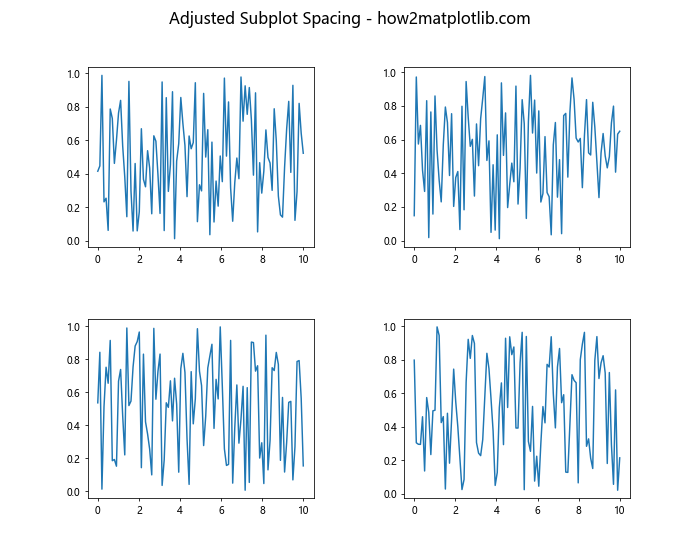
This example demonstrates how to adjust the spacing between subplots to prevent overlap.
Inconsistent Subplot Sizes
If your subplots have inconsistent sizes, you can use gridspec_kw to specify size ratios:
import matplotlib.pyplot as plt
import numpy as np

fig, axs = plt.subplots(2, 2, figsize=(10, 8),
                        gridspec_kw={'height_ratios': [2, 1],
                                     'width_ratios': [1, 2]})
fig.suptitle('Subplots with Custom Size Ratios - how2matplotlib.com', fontsize=16)

x = np.linspace(0, 10, 100)

for ax in axs.flat:
    ax.plot(x, np.random.rand(100))

plt.tight_layout()
plt.show()
Output:
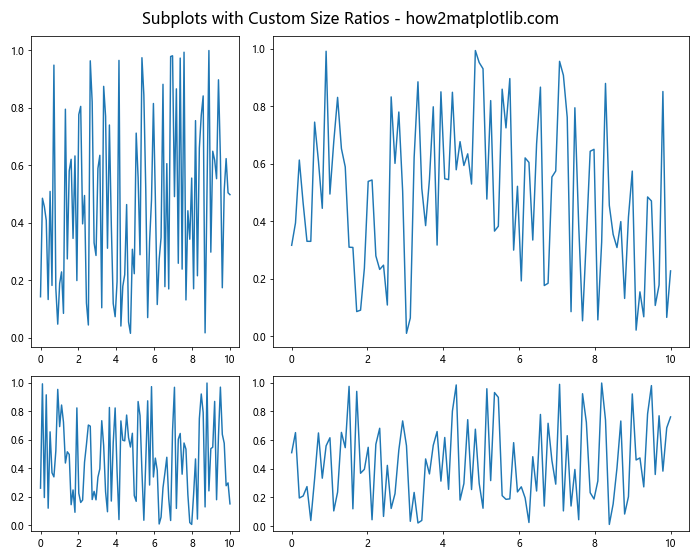
This example shows how to create subplots with custom size ratios.
Advanced Applications of plt.subplots
plt.subplots can be used in various advanced applications. Let’s explore a few:
Creating a Dashboard-like Layout
plt.subplots can be used to create complex dashboard-like layouts:
import matplotlib.pyplot as plt
import numpy as np

fig = plt.figure(figsize=(12, 8))
fig.suptitle('Dashboard Layout - how2matplotlib.com', fontsize=16)

gs = fig.add_gridspec(3, 3)

ax1 = fig.add_subplot(gs[0, :])
ax2 = fig.add_subplot(gs[1, :-1])
ax3 = fig.add_subplot(gs[1:, -1])
ax4 = fig.add_subplot(gs[-1, 0])
ax5 = fig.add_subplot(gs[-1, -2])

x = np.linspace(0, 10, 100)

ax1.plot(x, np.sin(x))
ax1.set_title('Overview')

ax2.plot(x, np.cos(x))
ax2.set_title('Detail 1')

ax3.plot(x, np.exp(x))
ax3.set_title('Detail 2')

ax4.plot(x, np.log(x))
ax4.set_title('Detail 3')

ax5.plot(x, x**2)
ax5.set_title('Detail 4')

plt.tight_layout()
plt.show()
Output:
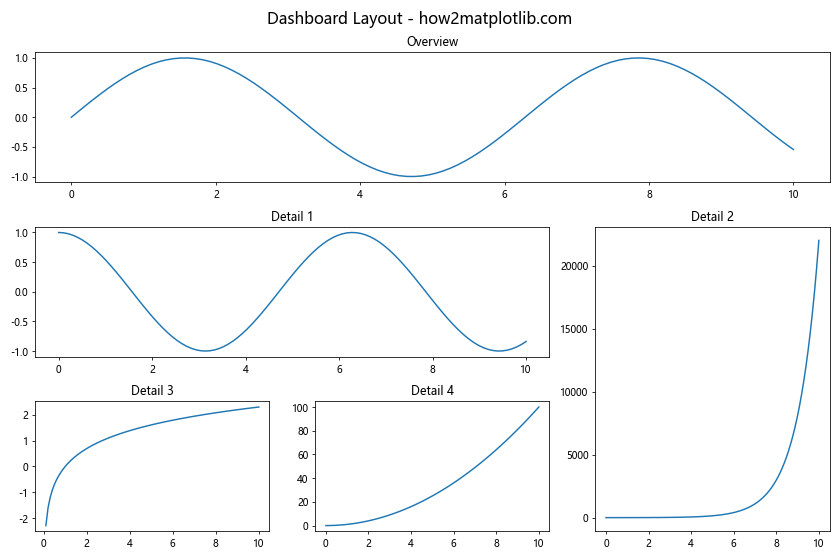
This example creates a dashboard-like layout using plt.subplots and gridspec.
Creating Subplots with Mixed Types
plt.subplots allows you to mix different types of plots in a single figure:
import matplotlib.pyplot as plt
import numpy as np

fig, axs = plt.subplots(2, 2, figsize=(12, 10))
fig.suptitle('Mixed Plot Types - how2matplotlib.com', fontsize=16)

x = np.linspace(0, 10, 100)
y = np.sin(x)

axs[0, 0].plot(x, y)
axs[0, 0].set_title('Line Plot')

axs[0, 1].scatter(x, y)
axs[0, 1].set_title('Scatter Plot')

axs[1, 0].bar(x[::10], y[::10])
axs[1, 0].set_title('Bar Plot')

axs[1, 1].hist2d(x, y, bins=20)
axs[1, 1].set_title('2D Histogram')

plt.tight_layout()
plt.show()
Output:
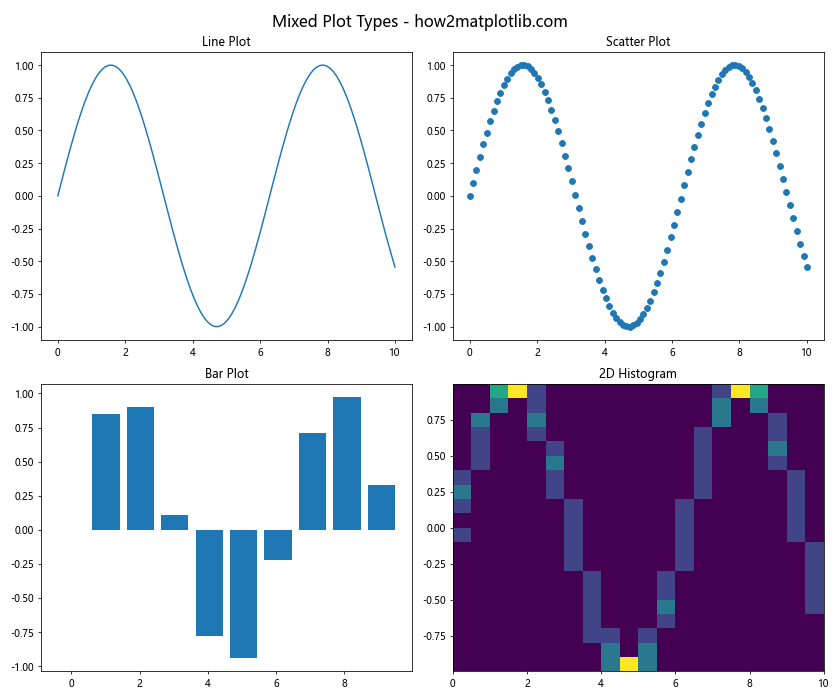
This example demonstrates how to create subplots with different types of plots.
plt.subplots Conclusion
plt.subplots is a powerful and versatile tool in Matplotlib that allows you to create complex and informative visualizations. By mastering its various features and parameters, you can create professional-quality plots that effectively communicate your data. Remember to experiment with different layouts, styles, and plot types to find the best way to represent your specific data and insights. With practice and creativity, plt.subplots can become an invaluable asset in your data visualization toolkit.