Comprehensive Guide to Matplotlib.axis.Axis.get_major_locator() Function in Python
Matplotlib.axis.Axis.get_major_locator() function in Python is an essential tool for customizing and retrieving information about the major tick locators in Matplotlib plots. This function is part of the Matplotlib library, which is widely used for creating static, animated, and interactive visualizations in Python. In this comprehensive guide, we’ll explore the Matplotlib.axis.Axis.get_major_locator() function in detail, covering its usage, applications, and providing numerous examples to help you master this powerful feature.
Understanding the Matplotlib.axis.Axis.get_major_locator() Function
The Matplotlib.axis.Axis.get_major_locator() function is a method of the Axis class in Matplotlib. Its primary purpose is to retrieve the current major tick locator object associated with an axis. This function is crucial for understanding and manipulating the placement of major ticks on your plots.
Let’s start with a simple example to demonstrate how to use the Matplotlib.axis.Axis.get_major_locator() function:
import matplotlib.pyplot as plt
import numpy as np

# Create a simple plot
x = np.linspace(0, 10, 100)
y = np.sin(x)

fig, ax = plt.subplots()
ax.plot(x, y)

# Get the major locator for the x-axis
major_locator = ax.xaxis.get_major_locator()

print(f"Major locator for x-axis: {major_locator}")

plt.title("How2matplotlib.com - Simple Plot")
plt.show()
Output:
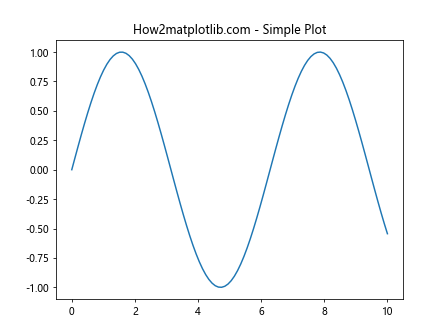
In this example, we create a simple sine wave plot and then use the Matplotlib.axis.Axis.get_major_locator() function to retrieve the major locator for the x-axis. The function returns the current locator object, which you can then inspect or modify as needed.
Types of Major Locators in Matplotlib
Before diving deeper into the Matplotlib.axis.Axis.get_major_locator() function, it’s essential to understand the different types of major locators available in Matplotlib. These locators determine how the major ticks are placed on an axis. Some common types include:
- AutoLocator
- MaxNLocator
- LinearLocator
- MultipleLocator
- FixedLocator
- IndexLocator
- LogLocator
Let’s explore each of these locators and see how we can use the Matplotlib.axis.Axis.get_major_locator() function to work with them.
AutoLocator
The AutoLocator is the default locator used by Matplotlib. It automatically determines the best locations for major ticks based on the data range and available space.
import matplotlib.pyplot as plt
import numpy as np
from matplotlib.ticker import AutoLocator

# Create data
x = np.linspace(0, 10, 100)
y = np.exp(x)

# Create plot
fig, ax = plt.subplots()
ax.plot(x, y)

# Set AutoLocator for x-axis
ax.xaxis.set_major_locator(AutoLocator())

# Get and print the major locator
major_locator = ax.xaxis.get_major_locator()
print(f"Major locator for x-axis: {major_locator}")

plt.title("How2matplotlib.com - AutoLocator Example")
plt.show()
Output:
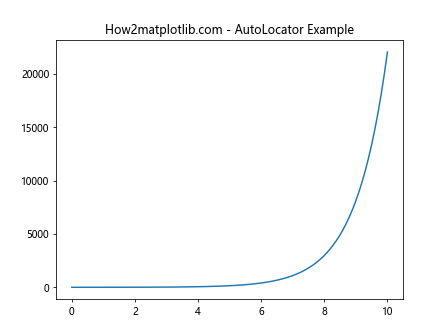
In this example, we explicitly set the AutoLocator for the x-axis and then use the Matplotlib.axis.Axis.get_major_locator() function to retrieve and print the locator information.
MaxNLocator
The MaxNLocator allows you to specify the maximum number of major ticks on an axis. This is useful when you want to control the density of tick marks.
import matplotlib.pyplot as plt
import numpy as np
from matplotlib.ticker import MaxNLocator

# Create data
x = np.linspace(0, 20, 100)
y = x ** 2

# Create plot
fig, ax = plt.subplots()
ax.plot(x, y)

# Set MaxNLocator for y-axis with a maximum of 5 ticks
ax.yaxis.set_major_locator(MaxNLocator(nbins=5))

# Get and print the major locator
major_locator = ax.yaxis.get_major_locator()
print(f"Major locator for y-axis: {major_locator}")

plt.title("How2matplotlib.com - MaxNLocator Example")
plt.show()
Output:
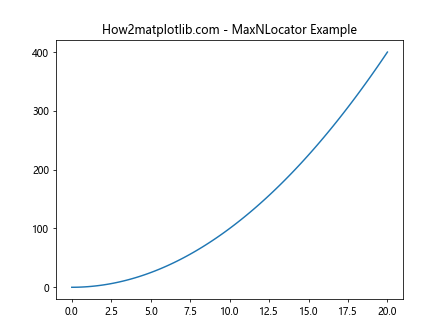
In this example, we use the MaxNLocator to limit the number of major ticks on the y-axis to 5. The Matplotlib.axis.Axis.get_major_locator() function allows us to confirm that the correct locator is being used.
LinearLocator
The LinearLocator places a fixed number of ticks at evenly spaced intervals across the axis range.
import matplotlib.pyplot as plt
import numpy as np
from matplotlib.ticker import LinearLocator

# Create data
x = np.linspace(0, 10, 100)
y = np.sin(x) * np.exp(-x/10)

# Create plot
fig, ax = plt.subplots()
ax.plot(x, y)

# Set LinearLocator for x-axis with 6 ticks
ax.xaxis.set_major_locator(LinearLocator(numticks=6))

# Get and print the major locator
major_locator = ax.xaxis.get_major_locator()
print(f"Major locator for x-axis: {major_locator}")

plt.title("How2matplotlib.com - LinearLocator Example")
plt.show()
Output:
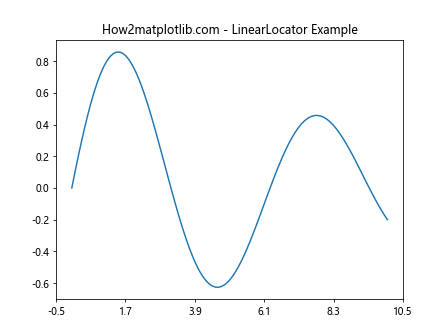
This example demonstrates how to use the LinearLocator to place 6 evenly spaced ticks on the x-axis. The Matplotlib.axis.Axis.get_major_locator() function confirms that the LinearLocator is being used.
MultipleLocator
The MultipleLocator places ticks at locations that are multiples of a given base value.
import matplotlib.pyplot as plt
import numpy as np
from matplotlib.ticker import MultipleLocator

# Create data
x = np.linspace(0, 30, 100)
y = np.cos(x)

# Create plot
fig, ax = plt.subplots()
ax.plot(x, y)

# Set MultipleLocator for x-axis with a base of 5
ax.xaxis.set_major_locator(MultipleLocator(base=5))

# Get and print the major locator
major_locator = ax.xaxis.get_major_locator()
print(f"Major locator for x-axis: {major_locator}")

plt.title("How2matplotlib.com - MultipleLocator Example")
plt.show()
Output:
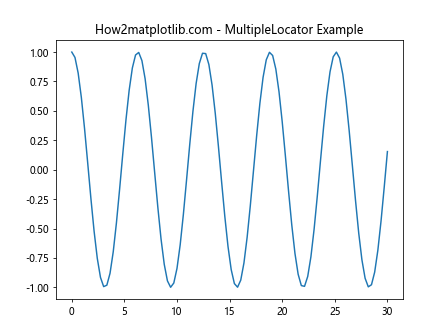
In this example, we use the MultipleLocator to place ticks at multiples of 5 on the x-axis. The Matplotlib.axis.Axis.get_major_locator() function allows us to verify that the MultipleLocator is being used with the specified base value.
FixedLocator
The FixedLocator allows you to specify exact locations for the major ticks.
import matplotlib.pyplot as plt
import numpy as np
from matplotlib.ticker import FixedLocator

# Create data
x = np.linspace(0, 10, 100)
y = x ** 3

# Create plot
fig, ax = plt.subplots()
ax.plot(x, y)

# Set FixedLocator for x-axis with custom tick locations
ax.xaxis.set_major_locator(FixedLocator([0, 2.5, 5, 7.5, 10]))

# Get and print the major locator
major_locator = ax.xaxis.get_major_locator()
print(f"Major locator for x-axis: {major_locator}")

plt.title("How2matplotlib.com - FixedLocator Example")
plt.show()
Output:
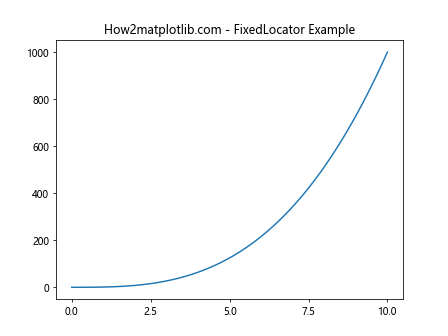
This example shows how to use the FixedLocator to place ticks at specific locations on the x-axis. The Matplotlib.axis.Axis.get_major_locator() function confirms that the FixedLocator is being used with the specified tick locations.
IndexLocator
The IndexLocator is useful when you want to place ticks at specific index positions, particularly when working with categorical data.
import matplotlib.pyplot as plt
import numpy as np
from matplotlib.ticker import IndexLocator

# Create data
categories = ['A', 'B', 'C', 'D', 'E']
values = [3, 7, 2, 5, 8]

# Create plot
fig, ax = plt.subplots()
ax.bar(categories, values)

# Set IndexLocator for x-axis
ax.xaxis.set_major_locator(IndexLocator(base=1, offset=0.5))

# Get and print the major locator
major_locator = ax.xaxis.get_major_locator()
print(f"Major locator for x-axis: {major_locator}")

plt.title("How2matplotlib.com - IndexLocator Example")
plt.show()
Output:
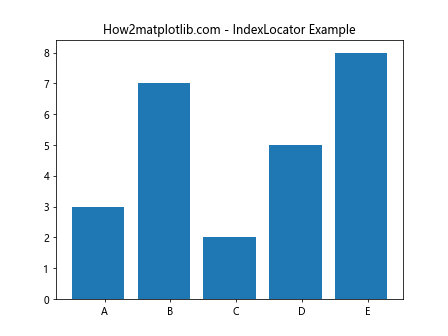
In this example, we use the IndexLocator to place ticks at the center of each bar in a bar plot. The Matplotlib.axis.Axis.get_major_locator() function allows us to verify that the IndexLocator is being used with the specified base and offset values.
LogLocator
The LogLocator is designed for use with logarithmic scales, placing ticks at appropriate locations for log-scaled data.
import matplotlib.pyplot as plt
import numpy as np
from matplotlib.ticker import LogLocator

# Create data
x = np.logspace(0, 3, 100)
y = x ** 2

# Create plot
fig, ax = plt.subplots()
ax.loglog(x, y)

# Set LogLocator for both x and y axes
ax.xaxis.set_major_locator(LogLocator(base=10))
ax.yaxis.set_major_locator(LogLocator(base=10))

# Get and print the major locators
x_major_locator = ax.xaxis.get_major_locator()
y_major_locator = ax.yaxis.get_major_locator()
print(f"Major locator for x-axis: {x_major_locator}")
print(f"Major locator for y-axis: {y_major_locator}")

plt.title("How2matplotlib.com - LogLocator Example")
plt.show()
Output:
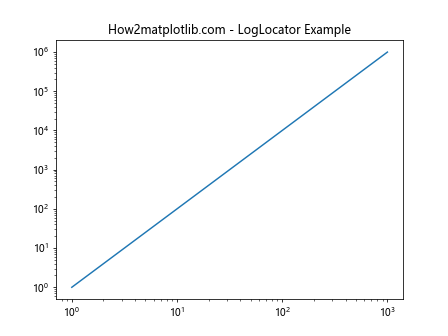
This example demonstrates how to use the LogLocator for both x and y axes in a log-log plot. The Matplotlib.axis.Axis.get_major_locator() function confirms that the LogLocator is being used for both axes.
Advanced Usage of Matplotlib.axis.Axis.get_major_locator()
Now that we’ve covered the basic types of locators, let’s explore some advanced usage scenarios for the Matplotlib.axis.Axis.get_major_locator() function.
Modifying Existing Locators
One common use case for the Matplotlib.axis.Axis.get_major_locator() function is to retrieve the current locator, modify its properties, and then set it back on the axis. This allows you to fine-tune the tick placement without completely replacing the locator.
import matplotlib.pyplot as plt
import numpy as np
from matplotlib.ticker import MaxNLocator

# Create data
x = np.linspace(0, 10, 100)
y = np.sin(x)

# Create plot
fig, ax = plt.subplots()
ax.plot(x, y)

# Get the current major locator
current_locator = ax.xaxis.get_major_locator()

# Check if it's a MaxNLocator and modify it
if isinstance(current_locator, MaxNLocator):
    current_locator.set_params(nbins=5)
else:
    # If it's not a MaxNLocator, create a new one
    new_locator = MaxNLocator(nbins=5)
    ax.xaxis.set_major_locator(new_locator)

# Get and print the updated major locator
updated_locator = ax.xaxis.get_major_locator()
print(f"Updated major locator for x-axis: {updated_locator}")

plt.title("How2matplotlib.com - Modified Locator Example")
plt.show()
Output:
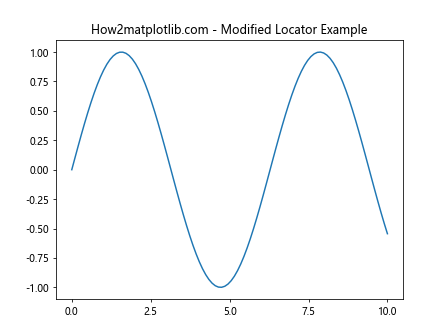
In this example, we retrieve the current major locator using Matplotlib.axis.Axis.get_major_locator(), check if it’s a MaxNLocator, and then modify its properties. If it’s not a MaxNLocator, we create a new one and set it on the axis.
Dynamic Locator Selection
In some cases, you might want to dynamically select the appropriate locator based on the data or plot characteristics. The Matplotlib.axis.Axis.get_major_locator() function can be useful in implementing such logic.
import matplotlib.pyplot as plt
import numpy as np
from matplotlib.ticker import LogLocator, LinearLocator

def select_locator(data_range):
    if data_range > 1000:
        return LogLocator(base=10)
    else:
        return LinearLocator(numticks=10)

# Create data
x = np.logspace(0, 4, 100)
y = x ** 2

# Create plot
fig, ax = plt.subplots()
ax.plot(x, y)

# Select and set the appropriate locator
data_range = np.max(y) - np.min(y)
selected_locator = select_locator(data_range)
ax.yaxis.set_major_locator(selected_locator)

# Get and print the major locator
major_locator = ax.yaxis.get_major_locator()
print(f"Selected major locator for y-axis: {major_locator}")

plt.title("How2matplotlib.com - Dynamic Locator Selection")
plt.show()
Output:
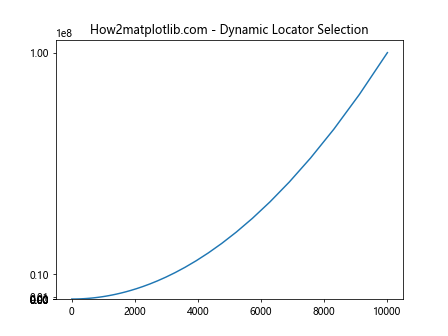
In this example, we define a function that selects either a LogLocator or a LinearLocator based on the data range. We then use this function to set the appropriate locator for the y-axis and verify the selection using the Matplotlib.axis.Axis.get_major_locator() function.
Practical Applications of Matplotlib.axis.Axis.get_major_locator()
Now that we’ve covered various aspects of the Matplotlib.axis.Axis.get_major_locator() function, let’s explore some practical applications where this function can be particularly useful.
Customizing Tick Density
One common use case forthe Matplotlib.axis.Axis.get_major_locator() function is to customize the tick density based on the data range. This can be particularly useful when dealing with datasets that have varying scales or when you want to ensure a consistent number of ticks across different plots.
import matplotlib.pyplot as plt
import numpy as np
from matplotlib.ticker import MaxNLocator

def adjust_tick_density(ax, axis='both', max_ticks=10):
    if axis in ['x', 'both']:
        current_locator = ax.xaxis.get_major_locator()
        if isinstance(current_locator, MaxNLocator):
            current_locator.set_params(nbins=max_ticks)
        else:
            ax.xaxis.set_major_locator(MaxNLocator(nbins=max_ticks))

    if axis in ['y', 'both']:
        current_locator = ax.yaxis.get_major_locator()
        if isinstance(current_locator, MaxNLocator):
            current_locator.set_params(nbins=max_ticks)
        else:
            ax.yaxis.set_major_locator(MaxNLocator(nbins=max_ticks))

# Create data
x1 = np.linspace(0, 10, 100)
y1 = np.sin(x1)

x2 = np.linspace(0, 1000, 100)
y2 = x2 ** 2

# Create subplots
fig, (ax1, ax2) = plt.subplots(1, 2, figsize=(12, 5))

# Plot data
ax1.plot(x1, y1)
ax2.plot(x2, y2)

# Adjust tick density
adjust_tick_density(ax1, max_ticks=5)
adjust_tick_density(ax2, max_ticks=5)

# Get and print the major locators
print(f"Major locator for ax1 x-axis: {ax1.xaxis.get_major_locator()}")
print(f"Major locator for ax2 x-axis: {ax2.xaxis.get_major_locator()}")

plt.suptitle("How2matplotlib.com - Customizing Tick Density")
plt.tight_layout()
plt.show()
Output:
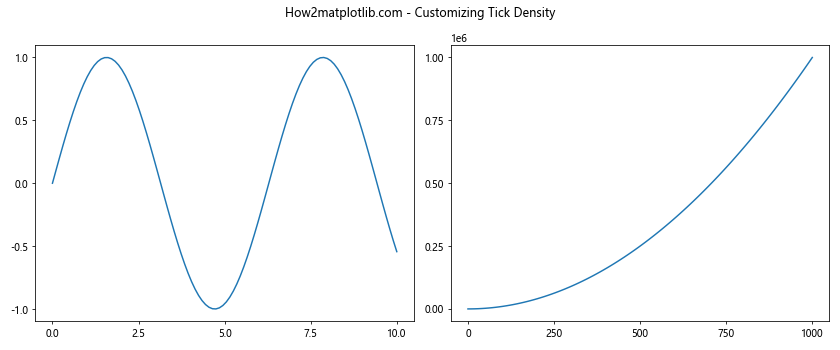
In this example, we define a function adjust_tick_density that uses the Matplotlib.axis.Axis.get_major_locator() function to check the current locator and adjust it if necessary. This ensures a consistent number of ticks across different plots, even when the data ranges vary significantly.
Automatic Scale Detection and Locator Selection
Another practical application of the Matplotlib.axis.Axis.get_major_locator() function is to automatically detect the scale of the data and select an appropriate locator. This can be particularly useful when creating plots with varying data ranges or scales.
import matplotlib.pyplot as plt
import numpy as np
from matplotlib.ticker import LogLocator, LinearLocator, MaxNLocator

def select_appropriate_locator(data):
    data_range = np.max(data) - np.min(data)
    if data_range == 0:
        return MaxNLocator(nbins=1)
    elif np.log10(data_range) > 3:
        return LogLocator(base=10)
    else:
        return LinearLocator(numticks=10)

# Create data sets with different scales
x1 = np.linspace(0, 10, 100)
y1 = np.sin(x1)

x2 = np.logspace(0, 5, 100)
y2 = x2 ** 2

x3 = np.linspace(0, 1, 100)
y3 = np.ones_like(x3)  # Constant data

# Create subplots
fig, (ax1, ax2, ax3) = plt.subplots(1, 3, figsize=(15, 5))

# Plot data and set appropriate locators
ax1.plot(x1, y1)
ax1.yaxis.set_major_locator(select_appropriate_locator(y1))

ax2.plot(x2, y2)
ax2.set_xscale('log')
ax2.set_yscale('log')
ax2.xaxis.set_major_locator(select_appropriate_locator(x2))
ax2.yaxis.set_major_locator(select_appropriate_locator(y2))

ax3.plot(x3, y3)
ax3.yaxis.set_major_locator(select_appropriate_locator(y3))

# Get and print the major locators
print(f"Major locator for ax1 y-axis: {ax1.yaxis.get_major_locator()}")
print(f"Major locator for ax2 x-axis: {ax2.xaxis.get_major_locator()}")
print(f"Major locator for ax2 y-axis: {ax2.yaxis.get_major_locator()}")
print(f"Major locator for ax3 y-axis: {ax3.yaxis.get_major_locator()}")

plt.suptitle("How2matplotlib.com - Automatic Scale Detection and Locator Selection")
plt.tight_layout()
plt.show()
Output:
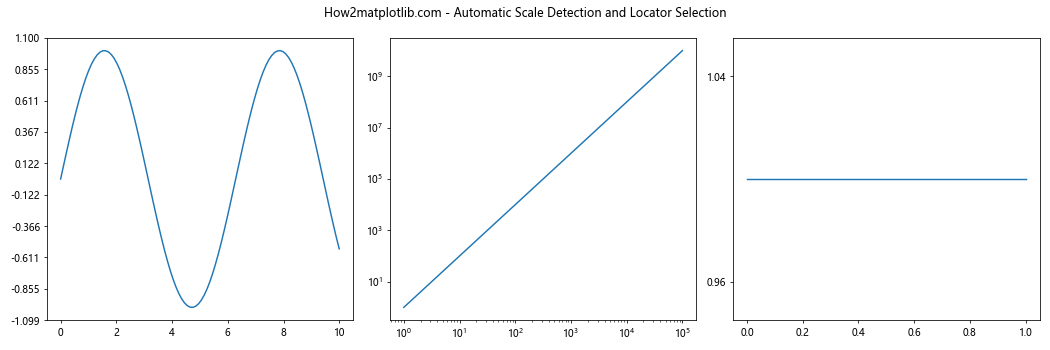
In this example, we define a function select_appropriate_locator that analyzes the data range and selects an appropriate locator (LogLocator, LinearLocator, or MaxNLocator). We then apply this function to different datasets and use the Matplotlib.axis.Axis.get_major_locator() function to verify the selected locators.
Customizing Tick Locations for Time Series Data
The Matplotlib.axis.Axis.get_major_locator() function can also be useful when working with time series data, allowing you to customize tick locations based on specific time intervals.
import matplotlib.pyplot as plt
import numpy as np
from matplotlib.dates import DateFormatter, DayLocator, WeekdayLocator, MONDAY
from datetime import datetime, timedelta

# Create time series data
start_date = datetime(2023, 1, 1)
dates = [start_date + timedelta(days=i) for i in range(60)]
values = np.cumsum(np.random.randn(60))

# Create plot
fig, ax = plt.subplots(figsize=(12, 6))
ax.plot(dates, values)

# Set major locator to show Mondays
ax.xaxis.set_major_locator(WeekdayLocator(byweekday=MONDAY))
ax.xaxis.set_major_formatter(DateFormatter('%Y-%m-%d'))

# Set minor locator to show daily ticks
ax.xaxis.set_minor_locator(DayLocator())

# Rotate and align the tick labels so they look better
plt.gcf().autofmt_xdate()

# Get and print the major locator
major_locator = ax.xaxis.get_major_locator()
print(f"Major locator for x-axis: {major_locator}")

plt.title("How2matplotlib.com - Time Series Data with Custom Tick Locations")
plt.tight_layout()
plt.show()
Output:
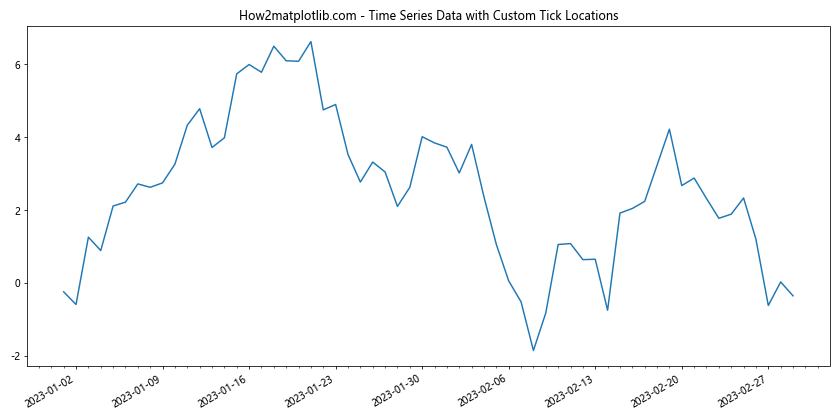
In this example, we use the WeekdayLocator to set major ticks on Mondays and the DayLocator for minor ticks. The Matplotlib.axis.Axis.get_major_locator() function allows us to verify that the correct locator is being used for the x-axis.
Best Practices and Tips for Using Matplotlib.axis.Axis.get_major_locator()
When working with the Matplotlib.axis.Axis.get_major_locator() function, there are several best practices and tips to keep in mind:
- Always check the type of the returned locator before modifying its properties to avoid potential errors.
Use the Matplotlib.axis.Axis.get_major_locator() function in combination with set_major_locator() to create dynamic and responsive plots that adapt to different data ranges.
When creating custom locators, consider implementing the
__str__method to provide meaningful information when using the Matplotlib.axis.Axis.get_major_locator() function.Remember that the Matplotlib.axis.Axis.get_major_locator() function returns the locator object, not the tick locations themselves. To get the actual tick locations, you need to call the locator.
When working with subplots or multiple axes, use the Matplotlib.axis.Axis.get_major_locator() function to ensure consistency across different plots.
Here’s an example that demonstrates some of these best practices: