Comprehensive Guide to Matplotlib.axis.Axis.get_major_formatter() Function in Python
Matplotlib.axis.Axis.get_major_formatter() function in Python is an essential method for retrieving the major formatter of an axis in Matplotlib plots. This function plays a crucial role in customizing the appearance and formatting of axis labels. In this comprehensive guide, we’ll explore the Matplotlib.axis.Axis.get_major_formatter() function in detail, covering its usage, parameters, return values, and practical applications in various plotting scenarios.
Understanding Matplotlib.axis.Axis.get_major_formatter()
The Matplotlib.axis.Axis.get_major_formatter() function is a method of the Axis class in Matplotlib. It allows you to retrieve the current major formatter object associated with an axis. This formatter is responsible for converting tick values into string labels that are displayed along the axis.
Let’s start with a simple example to demonstrate how to use the Matplotlib.axis.Axis.get_major_formatter() function:
import matplotlib.pyplot as plt
import numpy as np

# Create a simple plot
x = np.linspace(0, 10, 100)
y = np.sin(x)

fig, ax = plt.subplots()
ax.plot(x, y)

# Get the major formatter of the x-axis
x_formatter = ax.xaxis.get_major_formatter()

print(f"X-axis major formatter: {x_formatter}")

plt.title("How2matplotlib.com - Get Major Formatter Example")
plt.show()
Output:
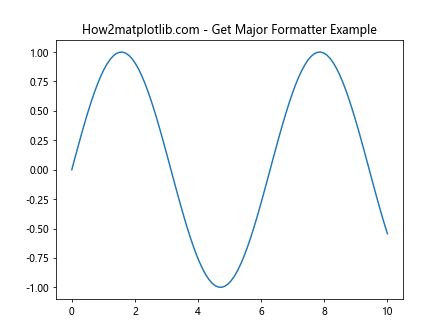
In this example, we create a simple sine wave plot and then use the Matplotlib.axis.Axis.get_major_formatter() function to retrieve the major formatter of the x-axis. The formatter object is then printed to the console.
Exploring Different Formatter Types
Matplotlib provides various formatter classes that can be used to customize the appearance of axis labels. The Matplotlib.axis.Axis.get_major_formatter() function allows you to identify which formatter is currently being used. Let’s explore some common formatter types:
ScalarFormatter
The ScalarFormatter is the default formatter used for most numeric axes. It formats numbers in a standard decimal notation.
import matplotlib.pyplot as plt
import matplotlib.ticker as ticker

fig, ax = plt.subplots()
ax.plot([1, 2, 3, 4], [1, 4, 2, 3])

formatter = ax.xaxis.get_major_formatter()
print(f"Default formatter: {formatter}")

plt.title("How2matplotlib.com - ScalarFormatter Example")
plt.show()
Output:
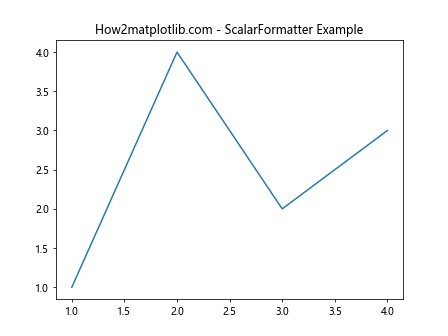
In this example, we create a simple plot and use Matplotlib.axis.Axis.get_major_formatter() to confirm that the default formatter is indeed ScalarFormatter.
FuncFormatter
The FuncFormatter allows you to define a custom function to format tick labels. Let’s see how we can use Matplotlib.axis.Axis.get_major_formatter() with a FuncFormatter:
import matplotlib.pyplot as plt
import matplotlib.ticker as ticker

def currency_formatter(x, pos):
    return f"${x:.2f}"

fig, ax = plt.subplots()
ax.plot([1, 2, 3, 4], [100, 400, 200, 300])

ax.yaxis.set_major_formatter(ticker.FuncFormatter(currency_formatter))

formatter = ax.yaxis.get_major_formatter()
print(f"Custom formatter: {formatter}")

plt.title("How2matplotlib.com - FuncFormatter Example")
plt.show()
Output:
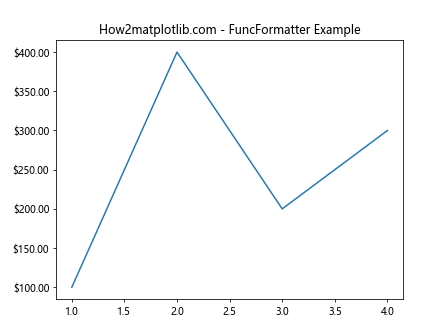
In this example, we define a custom currency formatter and apply it to the y-axis. We then use Matplotlib.axis.Axis.get_major_formatter() to confirm that the formatter has been changed to FuncFormatter.
StrMethodFormatter
The StrMethodFormatter allows you to use Python’s string formatting syntax to format tick labels. Here’s an example:
import matplotlib.pyplot as plt
import matplotlib.ticker as ticker

fig, ax = plt.subplots()
ax.plot([1, 2, 3, 4], [1000, 4000, 2000, 3000])

ax.yaxis.set_major_formatter(ticker.StrMethodFormatter("{x:.1e}"))

formatter = ax.yaxis.get_major_formatter()
print(f"StrMethodFormatter: {formatter}")

plt.title("How2matplotlib.com - StrMethodFormatter Example")
plt.show()
Output:
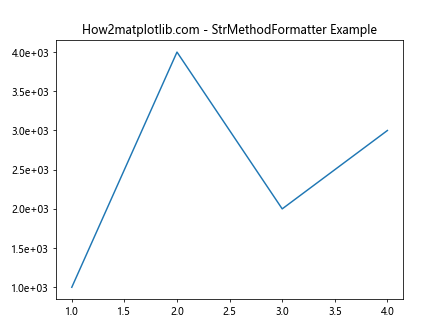
In this example, we use StrMethodFormatter to display y-axis labels in scientific notation. The Matplotlib.axis.Axis.get_major_formatter() function confirms that the formatter has been changed.
Practical Applications of Matplotlib.axis.Axis.get_major_formatter()
Now that we understand the basics of Matplotlib.axis.Axis.get_major_formatter(), let’s explore some practical applications of this function in various plotting scenarios.
Identifying and Modifying Existing Formatters
One common use case for Matplotlib.axis.Axis.get_major_formatter() is to identify the current formatter and modify its properties. Here’s an example:
import matplotlib.pyplot as plt
import matplotlib.ticker as ticker

fig, ax = plt.subplots()
ax.plot([1, 2, 3, 4], [1000, 4000, 2000, 3000])

# Get the current formatter
current_formatter = ax.yaxis.get_major_formatter()

if isinstance(current_formatter, ticker.ScalarFormatter):
    current_formatter.set_scientific(True)
    current_formatter.set_powerlimits((-2, 2))

plt.title("How2matplotlib.com - Modifying Existing Formatter")
plt.show()
Output:
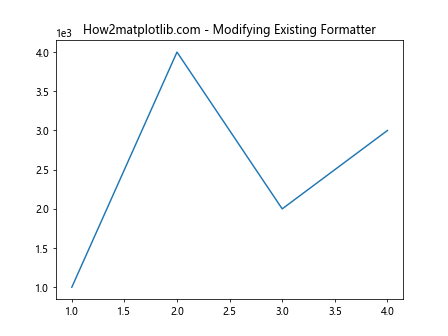
In this example, we use Matplotlib.axis.Axis.get_major_formatter() to check if the current formatter is a ScalarFormatter. If it is, we modify its properties to display numbers in scientific notation within certain limits.
Conditional Formatting Based on Axis Limits
The Matplotlib.axis.Axis.get_major_formatter() function can be useful when you want to apply different formatting based on the current axis limits. Here’s an example:
import matplotlib.pyplot as plt
import matplotlib.ticker as ticker
import numpy as np

def adaptive_formatter(x, pos):
    ax = plt.gca()
    formatter = ax.yaxis.get_major_formatter()

    if isinstance(formatter, ticker.ScalarFormatter):
        if ax.get_ylim()[1] > 1000:
            return f"{x/1000:.1f}K"
        else:
            return f"{x:.0f}"

fig, ax = plt.subplots()
x = np.linspace(0, 10, 100)
y = np.exp(x)

ax.plot(x, y)
ax.yaxis.set_major_formatter(ticker.FuncFormatter(adaptive_formatter))

plt.title("How2matplotlib.com - Adaptive Formatting Example")
plt.show()
Output:
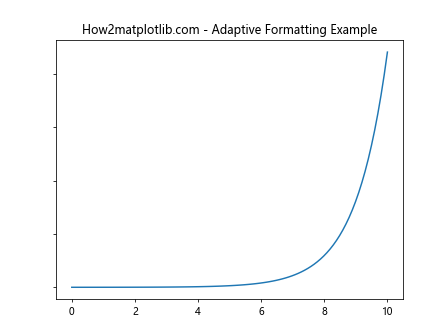
In this example, we create a custom formatter that checks the current y-axis limits using Matplotlib.axis.Axis.get_major_formatter(). If the upper limit is greater than 1000, it formats the labels in thousands (K); otherwise, it uses integer formatting.
Combining Multiple Formatters
Sometimes you might want to combine multiple formatters for more complex label formatting. The Matplotlib.axis.Axis.get_major_formatter() function can help you manage this process:
import matplotlib.pyplot as plt
import matplotlib.ticker as ticker

class CombinedFormatter(ticker.Formatter):
    def __init__(self, formatters):
        self.formatters = formatters

    def __call__(self, x, pos=None):
        for formatter in self.formatters:
            try:
                return formatter(x, pos)
            except:
                pass
        return str(x)

fig, ax = plt.subplots()
ax.plot([1, 2, 3, 4], [0.001, 100, 10000, 1000000])

formatters = [
    ticker.FuncFormatter(lambda x, p: f"{x:.2f}" if x < 1 else None),
    ticker.FuncFormatter(lambda x, p: f"{x:.0f}" if 1 <= x < 1000 else None),
    ticker.FuncFormatter(lambda x, p: f"{x/1000:.1f}K" if 1000 <= x < 1000000 else None),
    ticker.FuncFormatter(lambda x, p: f"{x/1000000:.1f}M" if x >= 1000000 else None),
]

combined_formatter = CombinedFormatter(formatters)
ax.yaxis.set_major_formatter(combined_formatter)

current_formatter = ax.yaxis.get_major_formatter()
print(f"Current formatter: {current_formatter}")

plt.title("How2matplotlib.com - Combined Formatters Example")
plt.show()
Output:
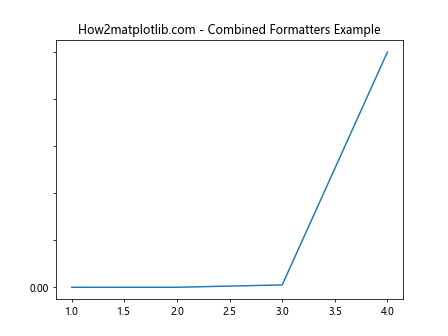
In this example, we create a custom CombinedFormatter class that tries multiple formatters in sequence. We then use Matplotlib.axis.Axis.get_major_formatter() to confirm that our custom formatter has been applied to the y-axis.
Advanced Usage of Matplotlib.axis.Axis.get_major_formatter()
Let’s explore some advanced applications of the Matplotlib.axis.Axis.get_major_formatter() function in more complex plotting scenarios.
Dynamic Formatter Switching
In some cases, you might want to switch between different formatters based on user interaction or data changes. The Matplotlib.axis.Axis.get_major_formatter() function can be helpful in managing this process:
import matplotlib.pyplot as plt
import matplotlib.ticker as ticker

class FormatterSwitcher:
    def __init__(self, ax):
        self.ax = ax
        self.formatters = [
            ticker.ScalarFormatter(),
            ticker.FuncFormatter(lambda x, p: f"${x:.2f}"),
            ticker.PercentFormatter(xmax=1)
        ]
        self.current_index = 0

    def switch_formatter(self, event):
        self.current_index = (self.current_index + 1) % len(self.formatters)
        self.ax.yaxis.set_major_formatter(self.formatters[self.current_index])
        current_formatter = self.ax.yaxis.get_major_formatter()
        print(f"Current formatter: {current_formatter}")
        plt.draw()

fig, ax = plt.subplots()
ax.plot([1, 2, 3, 4], [0.1, 0.4, 0.2, 0.3])

switcher = FormatterSwitcher(ax)
fig.canvas.mpl_connect('button_press_event', switcher.switch_formatter)

plt.title("How2matplotlib.com - Dynamic Formatter Switching")
plt.show()
Output:
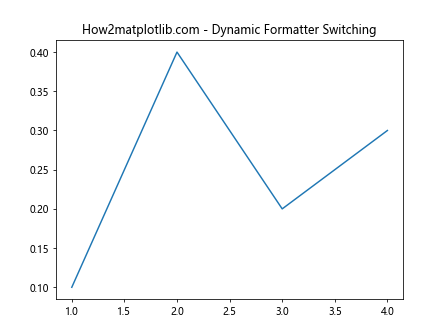
In this example, we create a FormatterSwitcher class that cycles through different formatters when the plot is clicked. The Matplotlib.axis.Axis.get_major_formatter() function is used to print the current formatter after each switch.
Formatter Inheritance in Subplots
When working with subplots, you might want to inherit formatters from a parent axis. The Matplotlib.axis.Axis.get_major_formatter() function can be useful in this scenario:
import matplotlib.pyplot as plt
import matplotlib.ticker as ticker

def currency_formatter(x, pos):
    return f"${x:.2f}"

fig, (ax1, ax2) = plt.subplots(2, 1, sharex=True)

ax1.plot([1, 2, 3, 4], [10, 40, 20, 30])
ax2.plot([1, 2, 3, 4], [15, 35, 25, 45])

ax1.yaxis.set_major_formatter(ticker.FuncFormatter(currency_formatter))

# Inherit formatter from ax1
ax2.yaxis.set_major_formatter(ax1.yaxis.get_major_formatter())

plt.title("How2matplotlib.com - Formatter Inheritance Example")
plt.show()
Output:
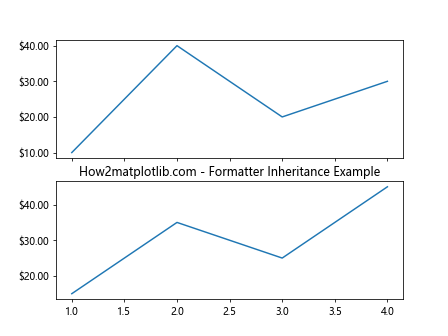
In this example, we create two subplots and set a custom currency formatter for the first subplot. We then use Matplotlib.axis.Axis.get_major_formatter() to retrieve this formatter and apply it to the second subplot, ensuring consistent formatting across both plots.
Formatter Customization Based on Data Range
The Matplotlib.axis.Axis.get_major_formatter() function can be particularly useful when you want to customize the formatter based on the data range. Here’s an example:
import matplotlib.pyplot as plt
import matplotlib.ticker as ticker
import numpy as np

class RangeBasedFormatter(ticker.Formatter):
    def __call__(self, x, pos=None):
        ax = plt.gca()
        data_range = ax.get_ylim()[1] - ax.get_ylim()[0]

        if data_range < 1:
            return f"{x:.3f}"
        elif data_range < 1000:
            return f"{x:.1f}"
        else:
            return f"{x:.0f}"

fig, ax = plt.subplots()

x = np.linspace(0, 10, 100)
y = np.exp(x)

ax.plot(x, y)
ax.yaxis.set_major_formatter(RangeBasedFormatter())

current_formatter = ax.yaxis.get_major_formatter()
print(f"Current formatter: {current_formatter}")

plt.title("How2matplotlib.com - Range-Based Formatter Example")
plt.show()
Output:
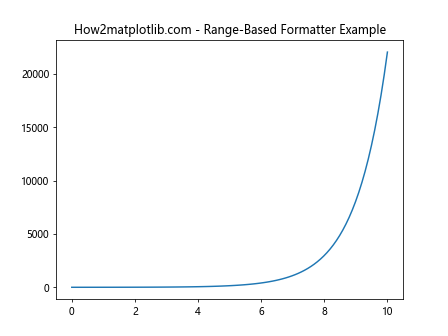
In this example, we create a custom RangeBasedFormatter that adjusts the number of decimal places based on the data range. The Matplotlib.axis.Axis.get_major_formatter() function is used to confirm that our custom formatter has been applied.
Troubleshooting with Matplotlib.axis.Axis.get_major_formatter()
The Matplotlib.axis.Axis.get_major_formatter() function can be a valuable tool for troubleshooting formatting issues in your plots. Let's explore some common scenarios where this function can be helpful.
Identifying Unexpected Formatters
Sometimes, you might encounter unexpected formatting in your plots. The Matplotlib.axis.Axis.get_major_formatter() function can help you identify which formatter is being used:
import matplotlib.pyplot as plt
import matplotlib.ticker as ticker

fig, ax = plt.subplots()
ax.plot([1, 2, 3, 4], [1000, 4000, 2000, 3000])

# Set a log scale for the y-axis
ax.set_yscale('log')

# Check the formatter after setting the scale
formatter = ax.yaxis.get_major_formatter()
print(f"Y-axis formatter after setting log scale: {formatter}")

plt.title("How2matplotlib.com - Identifying Unexpected Formatters")
plt.show()
Output:
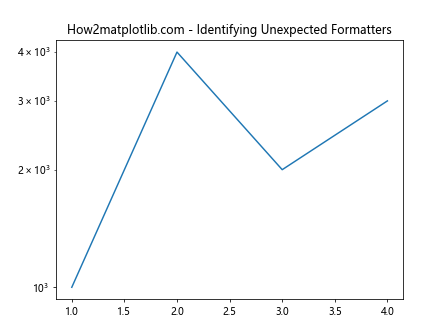
In this example, we set a logarithmic scale for the y-axis and then use Matplotlib.axis.Axis.get_major_formatter() to check which formatter is being used. This can help you understand why the labels might look different than expected.
Debugging Custom Formatters
When creating custom formatters, the Matplotlib.axis.Axis.get_major_formatter() function can be useful for debugging. Here's an example:
import matplotlib.pyplot as plt
import matplotlib.ticker as ticker

class DebugFormatter(ticker.Formatter):
    def __call__(self, x, pos=None):
        print(f"Formatting value: {x}")
        return f"{x:.2f}"

fig, ax = plt.subplots()
ax.plot([1, 2, 3, 4], [10, 40, 20, 30])

ax.yaxis.set_major_formatter(DebugFormatter())

current_formatter = ax.yaxis.get_major_formatter()
print(f"Current formatter: {current_formatter}")

plt.title("How2matplotlib.com - Debugging Custom Formatters")
plt.show()
Output:
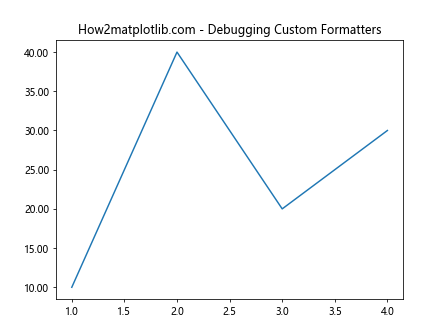
In this example, we create a DebugFormatter that prints the values it's formatting. By using Matplotlib.axis.Axis.get_major_formatter(), we can confirm that our custom formatter is being used, which can be helpful when debugging formatting issues.
Best Practices for Using Matplotlib.axis.Axis.get_major_formatter()
When working with theCertainly! Here's the continuation of the article:
Best Practices for Using Matplotlib.axis.Axis.get_major_formatter()
When working with the Matplotlib.axis.Axis.get_major_formatter() function, there are several best practices to keep in mind:
- Always check the type of the returned formatter before modifying its properties.
- Use the function in combination with setter methods to ensure consistency.
- Be aware of the impact of scale changes on formatters.
- Consider using the function for debugging and troubleshooting formatting issues.
Let's explore these best practices with some examples:
Checking Formatter Type
Before modifying a formatter's properties, it's important to check its type to avoid errors:
import matplotlib.pyplot as plt
import matplotlib.ticker as ticker

fig, ax = plt.subplots()
ax.plot([1, 2, 3, 4], [1000, 4000, 2000, 3000])

formatter = ax.yaxis.get_major_formatter()

if isinstance(formatter, ticker.ScalarFormatter):
    formatter.set_scientific(True)
elif isinstance(formatter, ticker.FuncFormatter):
    print("Custom formatter detected")
else:
    print("Unknown formatter type")

plt.title("How2matplotlib.com - Checking Formatter Type")
plt.show()
Output:
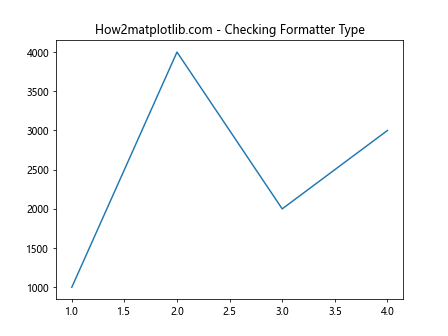
In this example, we use Matplotlib.axis.Axis.get_major_formatter() to retrieve the current formatter and then check its type before modifying its properties.
Combining get_major_formatter() with Setter Methods
To ensure consistency, it's a good practice to use Matplotlib.axis.Axis.get_major_formatter() in combination with setter methods:
import matplotlib.pyplot as plt
import matplotlib.ticker as ticker

fig, ax = plt.subplots()
ax.plot([1, 2, 3, 4], [0.001, 0.004, 0.002, 0.003])

current_formatter = ax.yaxis.get_major_formatter()
if isinstance(current_formatter, ticker.ScalarFormatter):
    new_formatter = ticker.ScalarFormatter(useMathText=True)
    new_formatter.set_scientific(True)
    new_formatter.set_powerlimits((-3, 3))
    ax.yaxis.set_major_formatter(new_formatter)

plt.title("How2matplotlib.com - Combining get and set methods")
plt.show()
Output:
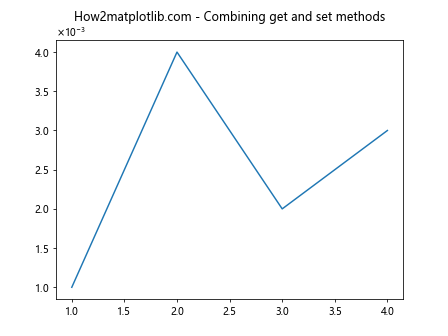
In this example, we first get the current formatter, check its type, and then create a new formatter with the desired properties before setting it back on the axis.
Handling Scale Changes
Be aware that changing the scale of an axis can affect the formatter. Here's an example of how to handle this:
import matplotlib.pyplot as plt
import matplotlib.ticker as ticker

fig, ax = plt.subplots()
ax.plot([1, 2, 3, 4], [10, 100, 1000, 10000])

print("Initial formatter:", ax.yaxis.get_major_formatter())

ax.set_yscale('log')
print("Formatter after log scale:", ax.yaxis.get_major_formatter())

# Restore linear scale and set custom formatter
ax.set_yscale('linear')
ax.yaxis.set_major_formatter(ticker.FuncFormatter(lambda x, p: f"{x:.0f}"))
print("Custom formatter:", ax.yaxis.get_major_formatter())

plt.title("How2matplotlib.com - Handling Scale Changes")
plt.show()
Output:
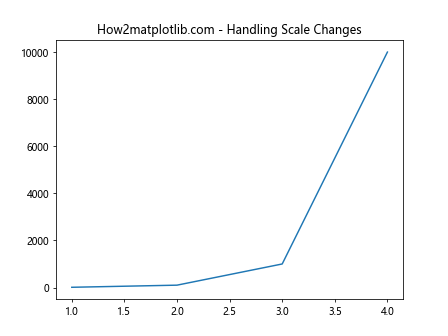
This example demonstrates how the formatter changes when switching between linear and logarithmic scales, and how to set a custom formatter after scale changes.
Advanced Topics Related to Matplotlib.axis.Axis.get_major_formatter()
Let's explore some advanced topics related to the Matplotlib.axis.Axis.get_major_formatter() function and axis formatting in general.
Creating a Formatter Factory
You can create a formatter factory that generates appropriate formatters based on data characteristics:
import matplotlib.pyplot as plt
import matplotlib.ticker as ticker
import numpy as np

def formatter_factory(data):
    data_range = np.ptp(data)
    if data_range < 1:
        return ticker.FormatStrFormatter('%.3f')
    elif data_range < 1000:
        return ticker.FormatStrFormatter('%.1f')
    else:
        return ticker.FuncFormatter(lambda x, p: f"{x/1000:.1f}K")

fig, (ax1, ax2, ax3) = plt.subplots(3, 1, figsize=(8, 12))

data1 = np.random.uniform(0, 1, 100)
data2 = np.random.uniform(0, 100, 100)
data3 = np.random.uniform(0, 10000, 100)

ax1.plot(data1)
ax2.plot(data2)
ax3.plot(data3)

ax1.yaxis.set_major_formatter(formatter_factory(data1))
ax2.yaxis.set_major_formatter(formatter_factory(data2))
ax3.yaxis.set_major_formatter(formatter_factory(data3))

for ax in (ax1, ax2, ax3):
    print(f"Formatter: {ax.yaxis.get_major_formatter()}")

plt.title("How2matplotlib.com - Formatter Factory Example")
plt.tight_layout()
plt.show()
Output:
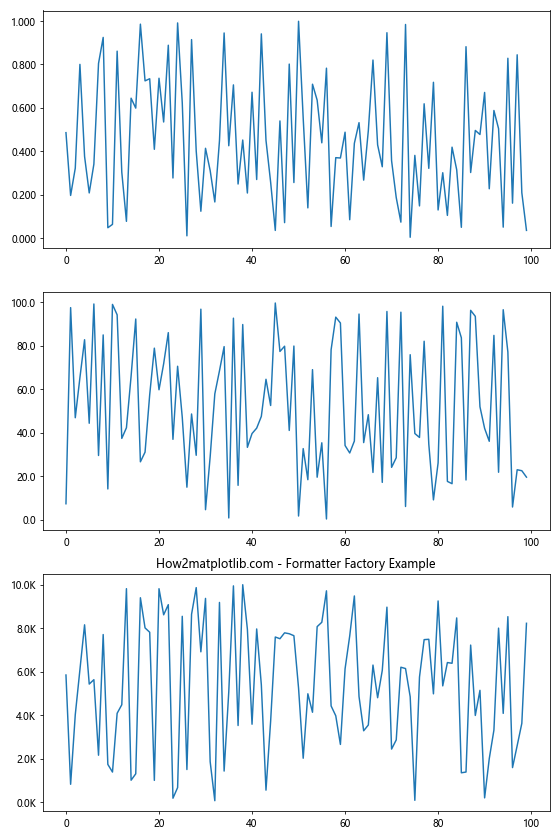
In this example, we create a formatter_factory function that returns different formatters based on the data range. We then use Matplotlib.axis.Axis.get_major_formatter() to verify the applied formatters.
Customizing Tick Locations and Formatters Together
Sometimes you might want to customize both tick locations and formatters. Here's an example of how to do this:
import matplotlib.pyplot as plt
import matplotlib.ticker as ticker
import numpy as np

fig, ax = plt.subplots()

x = np.linspace(0, 2*np.pi, 100)
y = np.sin(x)

ax.plot(x, y)

def pi_formatter(x, pos):
    n = int(np.round(2 * x / np.pi))
    if n == 0:
        return "0"
    elif n == 1:
        return "π/2"
    elif n == 2:
        return "π"
    elif n == 3:
        return "3π/2"
    elif n == 4:
        return "2π"
    else:
        return f"{n}π/2"

ax.xaxis.set_major_locator(ticker.MultipleLocator(base=np.pi/2))
ax.xaxis.set_major_formatter(ticker.FuncFormatter(pi_formatter))

print(f"X-axis formatter: {ax.xaxis.get_major_formatter()}")

plt.title("How2matplotlib.com - Custom Ticks and Formatter")
plt.show()
Output:
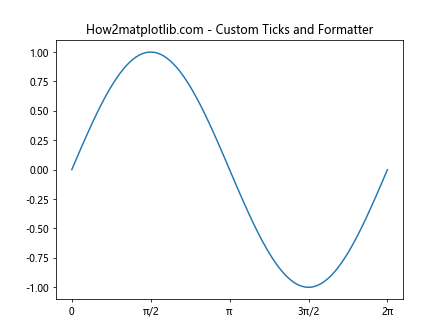
In this example, we customize both the tick locations and the formatter for a sine wave plot, using multiples of π/2. We use Matplotlib.axis.Axis.get_major_formatter() to confirm the applied formatter.
Creating an Adaptive Formatter
Let's create an adaptive formatter that changes its behavior based on the current view limits:
import matplotlib.pyplot as plt
import matplotlib.ticker as ticker

class AdaptiveFormatter(ticker.Formatter):
    def __call__(self, x, pos=None):
        ax = plt.gca()
        vmin, vmax = ax.get_ylim()
        range = vmax - vmin

        if range < 1:
            return f"{x:.3f}"
        elif range < 10:
            return f"{x:.2f}"
        elif range < 100:
            return f"{x:.1f}"
        else:
            return f"{x:.0f}"

fig, ax = plt.subplots()
ax.plot([1, 2, 3, 4], [0.1, 10, 50, 1000])

ax.yaxis.set_major_formatter(AdaptiveFormatter())

def on_ylims_change(event_ax):
    formatter = event_ax.yaxis.get_major_formatter()
    print(f"Y-axis formatter: {formatter}")
    plt.draw()

ax.callbacks.connect('ylim_changed', on_ylims_change)

plt.title("How2matplotlib.com - Adaptive Formatter Example")
plt.show()
Output:
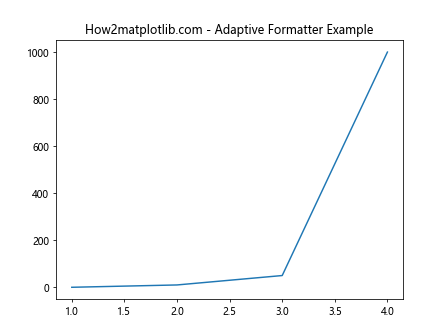
In this example, we create an AdaptiveFormatter that changes its formatting based on the current y-axis limits. We use Matplotlib.axis.Axis.get_major_formatter() in the callback function to print the current formatter whenever the y-limits change.
Conclusion
The Matplotlib.axis.Axis.get_major_formatter() function is a powerful tool for working with axis formatters in Matplotlib. It allows you to retrieve, inspect, and modify the current formatter, enabling fine-grained control over how your axis labels are displayed.
Throughout this article, we've explored various aspects of the Matplotlib.axis.Axis.get_major_formatter() function, including:
- Basic usage and understanding of the function
- Different types of formatters and how to work with them
- Practical applications in various plotting scenarios
- Advanced usage in complex plotting situations
- Troubleshooting and debugging techniques
- Best practices for using the function effectively
- Advanced topics related to axis formatting