Comprehensive Guide to Matplotlib.axis.Axis.get_minorticklabels() Function in Python
Matplotlib.axis.Axis.get_minorticklabels() function in Python is an essential tool for customizing and retrieving minor tick labels in Matplotlib plots. This function allows developers to access and manipulate the minor tick labels on an axis, providing greater control over the appearance and information displayed in visualizations. In this comprehensive guide, we’ll explore the Matplotlib.axis.Axis.get_minorticklabels() function in depth, covering its usage, parameters, return values, and practical applications in various plotting scenarios.
Understanding the Matplotlib.axis.Axis.get_minorticklabels() Function
The Matplotlib.axis.Axis.get_minorticklabels() function is a method of the Axis class in Matplotlib. It is used to retrieve the list of minor tick labels for a given axis. These minor tick labels are typically smaller and less prominent than major tick labels, but they provide additional granularity and precision to the axis scale.
Let’s start with a simple example to demonstrate the basic usage of the Matplotlib.axis.Axis.get_minorticklabels() function:
import matplotlib.pyplot as plt
import numpy as np

# Create a simple plot
fig, ax = plt.subplots()
x = np.linspace(0, 10, 100)
y = np.sin(x)
ax.plot(x, y)

# Get the minor tick labels for the x-axis
minor_tick_labels = ax.xaxis.get_minorticklabels()

# Print the minor tick labels
print("Minor tick labels for x-axis:")
for label in minor_tick_labels:
    print(label.get_text())

plt.title("How to use get_minorticklabels() - how2matplotlib.com")
plt.show()
Output:
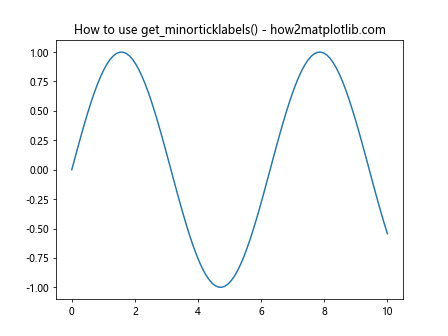
In this example, we create a simple sine wave plot and use the Matplotlib.axis.Axis.get_minorticklabels() function to retrieve the minor tick labels for the x-axis. The function returns a list of Text objects representing the minor tick labels, which we can then iterate through and print.
Parameters of Matplotlib.axis.Axis.get_minorticklabels()
The Matplotlib.axis.Axis.get_minorticklabels() function does not take any parameters. It simply returns the list of minor tick labels for the specified axis.
Return Value of Matplotlib.axis.Axis.get_minorticklabels()
The Matplotlib.axis.Axis.get_minorticklabels() function returns a list of Text objects. Each Text object represents a minor tick label on the axis. These Text objects contain information about the label’s content, position, and formatting.
Let’s examine the properties of the returned Text objects:
import matplotlib.pyplot as plt
import numpy as np

fig, ax = plt.subplots()
x = np.linspace(0, 10, 100)
y = np.sin(x)
ax.plot(x, y)

minor_tick_labels = ax.xaxis.get_minorticklabels()

print("Properties of minor tick labels:")
for label in minor_tick_labels:
    print(f"Text: {label.get_text()}")
    print(f"Position: {label.get_position()}")
    print(f"Font properties: {label.get_fontproperties()}")
    print("---")

plt.title("Examining minor tick labels - how2matplotlib.com")
plt.show()
Output:
This example demonstrates how to access various properties of the Text objects returned by the Matplotlib.axis.Axis.get_minorticklabels() function. We can retrieve the text content, position, and font properties of each minor tick label.
Customizing Minor Tick Labels
One of the primary use cases for the Matplotlib.axis.Axis.get_minorticklabels() function is to customize the appearance and content of minor tick labels. Let’s explore some common customization techniques:
Changing the Font Size of Minor Tick Labels
import matplotlib.pyplot as plt
import numpy as np

fig, ax = plt.subplots()
x = np.linspace(0, 10, 100)
y = np.sin(x)
ax.plot(x, y)

# Get minor tick labels and change their font size
minor_tick_labels = ax.xaxis.get_minorticklabels()
for label in minor_tick_labels:
    label.set_fontsize(8)

plt.title("Customizing minor tick label font size - how2matplotlib.com")
plt.show()
Output:
In this example, we use the Matplotlib.axis.Axis.get_minorticklabels() function to retrieve the minor tick labels and then iterate through them to set a smaller font size. This makes the minor tick labels less prominent compared to the major tick labels.
Changing the Color of Minor Tick Labels
import matplotlib.pyplot as plt
import numpy as np

fig, ax = plt.subplots()
x = np.linspace(0, 10, 100)
y = np.sin(x)
ax.plot(x, y)

# Get minor tick labels and change their color
minor_tick_labels = ax.xaxis.get_minorticklabels()
for label in minor_tick_labels:
    label.set_color('red')

plt.title("Customizing minor tick label color - how2matplotlib.com")
plt.show()
Output:
This example demonstrates how to change the color of minor tick labels using the Matplotlib.axis.Axis.get_minorticklabels() function. By setting the color to red, we make the minor tick labels stand out from the default black color.
Rotating Minor Tick Labels
import matplotlib.pyplot as plt
import numpy as np

fig, ax = plt.subplots()
x = np.linspace(0, 10, 100)
y = np.sin(x)
ax.plot(x, y)

# Get minor tick labels and rotate them
minor_tick_labels = ax.xaxis.get_minorticklabels()
for label in minor_tick_labels:
    label.set_rotation(45)

plt.title("Rotating minor tick labels - how2matplotlib.com")
plt.show()
Output:
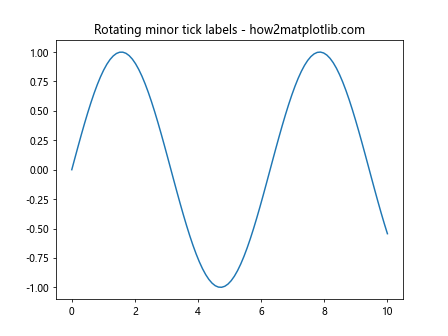
In this example, we use the Matplotlib.axis.Axis.get_minorticklabels() function to access the minor tick labels and rotate them by 45 degrees. This can be useful when dealing with long labels or when you want to improve the readability of the axis.
Working with Both Major and Minor Tick Labels
Often, you’ll want to customize both major and minor tick labels together. The Matplotlib.axis.Axis.get_minorticklabels() function can be used in conjunction with the get_majorticklabels() function to achieve this:
import matplotlib.pyplot as plt
import numpy as np

fig, ax = plt.subplots()
x = np.linspace(0, 10, 100)
y = np.sin(x)
ax.plot(x, y)

# Customize major tick labels
major_tick_labels = ax.xaxis.get_majorticklabels()
for label in major_tick_labels:
    label.set_color('blue')
    label.set_fontweight('bold')

# Customize minor tick labels
minor_tick_labels = ax.xaxis.get_minorticklabels()
for label in minor_tick_labels:
    label.set_color('red')
    label.set_fontsize(8)

plt.title("Customizing major and minor tick labels - how2matplotlib.com")
plt.show()
Output:
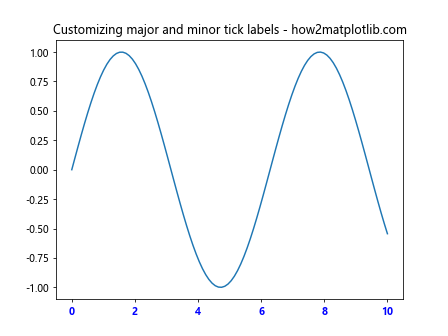
This example shows how to use both get_majorticklabels() and Matplotlib.axis.Axis.get_minorticklabels() functions to customize the appearance of major and minor tick labels separately. Major labels are set to blue and bold, while minor labels are set to red and have a smaller font size.
Handling Multiple Axes
When working with subplots or multiple axes, you can use the Matplotlib.axis.Axis.get_minorticklabels() function on each axis individually:
import matplotlib.pyplot as plt
import numpy as np

fig, (ax1, ax2) = plt.subplots(2, 1, figsize=(8, 8))

x = np.linspace(0, 10, 100)
y1 = np.sin(x)
y2 = np.cos(x)

ax1.plot(x, y1)
ax2.plot(x, y2)

# Customize minor tick labels for the first subplot
minor_tick_labels1 = ax1.xaxis.get_minorticklabels()
for label in minor_tick_labels1:
    label.set_color('red')

# Customize minor tick labels for the second subplot
minor_tick_labels2 = ax2.xaxis.get_minorticklabels()
for label in minor_tick_labels2:
    label.set_color('green')

ax1.set_title("Sine wave - how2matplotlib.com")
ax2.set_title("Cosine wave - how2matplotlib.com")
plt.tight_layout()
plt.show()
Output:
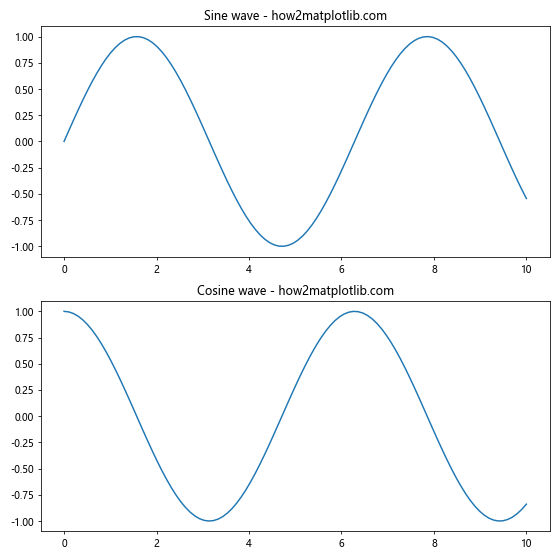
In this example, we create two subplots and use the Matplotlib.axis.Axis.get_minorticklabels() function to customize the minor tick labels for each subplot separately. The first subplot has red minor tick labels, while the second subplot has green minor tick labels.
Combining with Other Axis Customization Functions
The Matplotlib.axis.Axis.get_minorticklabels() function can be used in combination with other axis customization functions to create more complex and informative plots:
import matplotlib.pyplot as plt
import numpy as np

fig, ax = plt.subplots()
x = np.linspace(0, 10, 100)
y = np.sin(x)
ax.plot(x, y)

# Set minor ticks
ax.xaxis.set_minor_locator(plt.MultipleLocator(0.5))
ax.yaxis.set_minor_locator(plt.MultipleLocator(0.1))

# Customize minor tick labels
x_minor_labels = ax.xaxis.get_minorticklabels()
y_minor_labels = ax.yaxis.get_minorticklabels()

for label in x_minor_labels:
    label.set_color('red')
    label.set_rotation(45)

for label in y_minor_labels:
    label.set_color('blue')
    label.set_fontsize(8)

# Customize grid
ax.grid(which='major', linestyle='-', linewidth=0.5)
ax.grid(which='minor', linestyle=':', linewidth=0.5)

plt.title("Complex axis customization - how2matplotlib.com")
plt.show()
Output:
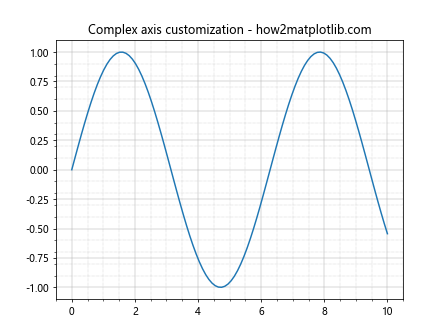
This example demonstrates how to combine the Matplotlib.axis.Axis.get_minorticklabels() function with other axis customization techniques. We set minor tick locations, customize the appearance of minor tick labels, and add a grid to create a more informative and visually appealing plot.
Handling Logarithmic Scales
The Matplotlib.axis.Axis.get_minorticklabels() function can be particularly useful when working with logarithmic scales:
import matplotlib.pyplot as plt
import numpy as np

fig, ax = plt.subplots()

x = np.logspace(0, 5, 100)
y = x**2

ax.loglog(x, y)

# Customize minor tick labels
x_minor_labels = ax.xaxis.get_minorticklabels()
y_minor_labels = ax.yaxis.get_minorticklabels()

for label in x_minor_labels:
    label.set_color('red')
    label.set_fontsize(8)

for label in y_minor_labels:
    label.set_color('blue')
    label.set_fontsize(8)

plt.title("Logarithmic scale with custom minor tick labels - how2matplotlib.com")
plt.show()
Output:
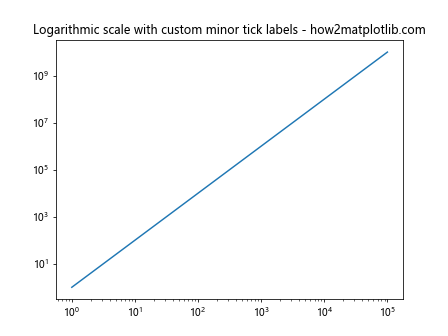
This example demonstrates how to use the Matplotlib.axis.Axis.get_minorticklabels() function with logarithmic scales. We create a log-log plot and customize the minor tick labels for both x and y axes, making them smaller and giving them different colors.
Handling Categorical Data
The Matplotlib.axis.Axis.get_minorticklabels() function can also be used with categorical data:
import matplotlib.pyplot as plt
import numpy as np

fig, ax = plt.subplots(figsize=(10, 6))

categories = ['A', 'B', 'C', 'D', 'E']
values = [3, 7, 2, 5, 8]

ax.bar(categories, values)

# Add minor ticks between categories
ax.set_xticks(np.arange(len(categories)) + 0.5, minor=True)

# Customize minor tick labels
minor_tick_labels = ax.xaxis.get_minorticklabels()
for label in minor_tick_labels:
    label.set_visible(True)
    label.set_rotation(90)
    label.set_fontsize(8)
    label.set_color('gray')

plt.title("Categorical data with custom minor tick labels - how2matplotlib.com")
plt.tight_layout()
plt.show()
Output:
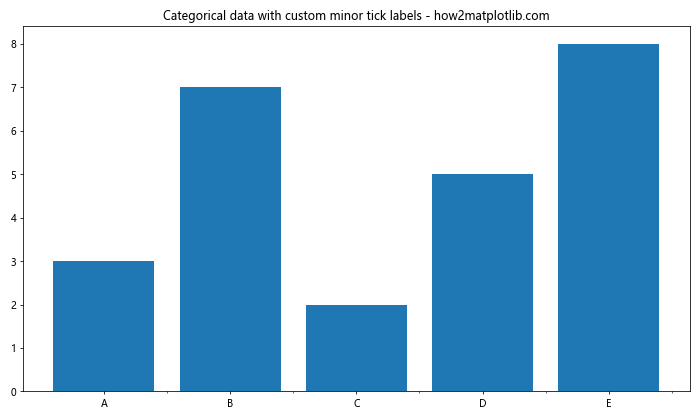
In this example, we create a bar plot with categorical data and use the Matplotlib.axis.Axis.get_minorticklabels() function to add and customize minor tick labels between categories. This can be useful for adding additional information or reference points to categorical plots.
Handling 3D Plots
The Matplotlib.axis.Axis.get_minorticklabels() function can also be used with 3D plots:
import matplotlib.pyplot as plt
import numpy as np

fig = plt.figure(figsize=(10, 8))
ax = fig.add_subplot(111, projection='3d')

x = np.linspace(-5, 5, 100)
y = np.linspace(-5, 5, 100)
X, Y = np.meshgrid(x, y)
Z = np.sin(np.sqrt(X**2 + Y**2))

ax.plot_surface(X, Y, Z)

# Customize minor tick labels for all axes
for axis in [ax.xaxis, ax.yaxis, ax.zaxis]:
    minor_tick_labels = axis.get_minorticklabels()
    for label in minor_tick_labels:
        label.set_color('red')
        label.set_fontsize(8)

plt.title("3D plot with custom minor tick labels - how2matplotlib.com")
plt.tight_layout()
plt.show()
Output:
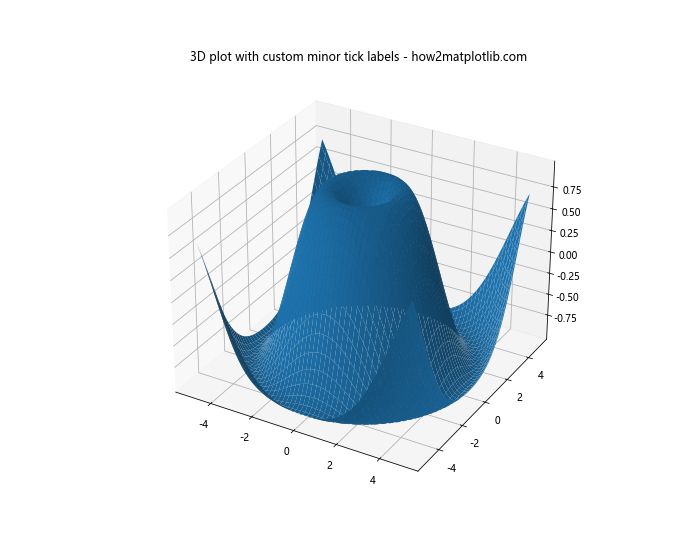
This example demonstrates how to use the Matplotlib.axis.Axis.get_minorticklabels() function with 3D plots. We create a surface plot and customize the minor tick labels for all three axes, making them smaller and red.
Advanced Techniques with Matplotlib.axis.Axis.get_minorticklabels()
Let’s explore some advanced techniques using the Matplotlib.axis.Axis.get_minorticklabels() function:
Selective Visibility of Minor Tick Labels
You can use the Matplotlib.axis.Axis.get_minorticklabels() function to selectively show or hide specific minor tick labels:
import matplotlib.pyplot as plt
import numpy as np

fig, ax = plt.subplots()

x = np.linspace(0, 10, 100)
y = np.sin(x)
ax.plot(x, y)

# Set minor ticks
ax.xaxis.set_minor_locator(plt.MultipleLocator(0.25))

# Selectively show minor tick labels
minor_tick_labels = ax.xaxis.get_minorticklabels()
for i, label in enumerate(minor_tick_labels):
    if i % 2 == 0:
        label.set_visible(True)
        label.set_color('red')
    else:
        label.set_visible(False)

plt.title("Selective visibility of minor tick labels - how2matplotlib.com")
plt.show()
Output:
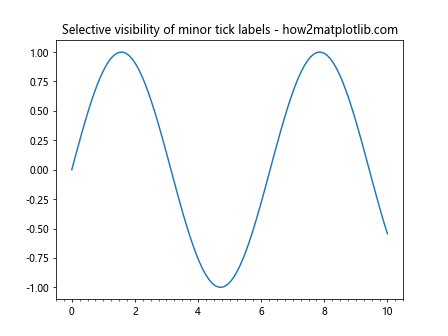
This example demonstrates how to use the Matplotlib.axis.Axis.get_minorticklabels() function to selectively show every other minor tick label, creating a less cluttered axis while still providing additional information.
Dynamic Updating of Minor Tick Labels
The Matplotlib.axis.Axis.get_minorticklabels() function can be used in interactive plots to dynamically update minor tick labels:
import matplotlib.pyplot as plt
import numpy as np

fig, ax = plt.subplots()

x = np.linspace(0, 10, 100)
y = np.sin(x)
line, = ax.plot(x, y)

# Set minor ticks
ax.xaxis.set_minor_locator(plt.MultipleLocator(0.5))

def update_minor_labels(event):
    if event.inaxes == ax:
        minor_tick_labels = ax.xaxis.get_minorticklabels()
        for label in minor_tick_labels:
            value = float(label.get_text())
            label.set_text(f"{value:.2f}")
            label.set_color('red' if value < event.xdata else 'blue')
        fig.canvas.draw_idle()

fig.canvas.mpl_connect('motion_notify_event', update_minor_labels)

plt.title("Dynamic updating of minor tick labels - how2matplotlib.com")
plt.show()
Output:
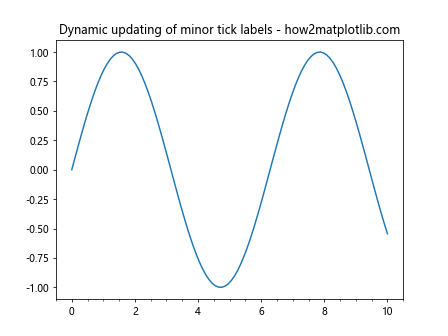
In this interactive example, we use the Matplotlib.axis.Axis.get_minorticklabels() function to dynamically update the minor tick labels based on the mouse position. The labels change color depending on their position relative to the mouse cursor.
Best Practices and Tips for Using Matplotlib.axis.Axis.get_minorticklabels()
When working with the Matplotlib.axis.Axis.get_minorticklabels() function, consider the following best practices and tips:
- Consistency: Maintain consistency in the appearance of minor tick labels across your plots to ensure a professional and cohesive look.
Readability: Be mindful of the size and color of minor tick labels to ensure they are readable without overshadowing the main plot elements.
Performance: When working with large datasets or complex plots, be aware that excessive customization of minor tick labels may impact performance.
Combine with other functions: Use Matplotlib.axis.Axis.get_minorticklabels() in conjunction with other Matplotlib functions to create more informative and visually appealing plots.
Documentation: When sharing your code, provide clear documentation on how you've used the Matplotlib.axis.Axis.get_minorticklabels() function to customize your plots.
Troubleshooting Common Issues with Matplotlib.axis.Axis.get_minorticklabels()
Here are some common issues you might encounter when using the Matplotlib.axis.Axis.get_minorticklabels() function and how to resolve them: