Comprehensive Guide to Matplotlib.axis.Axis.get_minorticklines() Function in Python
Matplotlib.axis.Axis.get_minorticklines() function in Python is a powerful tool for customizing and enhancing the appearance of your plots. This function is part of the Matplotlib library, which is widely used for creating static, animated, and interactive visualizations in Python. The get_minorticklines() function specifically deals with the minor tick lines on an axis, allowing you to access and modify these elements to create more detailed and informative plots.
In this comprehensive guide, we’ll explore the Matplotlib.axis.Axis.get_minorticklines() function in depth, covering its usage, parameters, return values, and practical applications. We’ll also provide numerous examples to illustrate how this function can be used to improve your data visualization skills.
Understanding the Basics of Matplotlib.axis.Axis.get_minorticklines()
Before diving into the specifics of the Matplotlib.axis.Axis.get_minorticklines() function, it’s essential to understand the context in which it operates. Matplotlib is a plotting library that provides an object-oriented API for embedding plots into applications. Within this library, the Axis object represents the axes of a plot, and the get_minorticklines() function is a method of this object.
The primary purpose of the Matplotlib.axis.Axis.get_minorticklines() function is to return a list of Line2D objects representing the minor tick lines for the given axis. These minor tick lines are smaller marks between the major tick marks on an axis, providing additional precision and detail to your plots.
Let’s start with a simple example to illustrate how to use the Matplotlib.axis.Axis.get_minorticklines() function:
import matplotlib.pyplot as plt
import numpy as np

# Create a simple plot
fig, ax = plt.subplots()
x = np.linspace(0, 10, 100)
ax.plot(x, np.sin(x))

# Get the minor tick lines
minor_ticks = ax.xaxis.get_minorticklines()

# Customize the minor tick lines
for line in minor_ticks:
    line.set_color('red')
    line.set_markersize(4)

plt.title('How to use get_minorticklines() - how2matplotlib.com')
plt.show()
Output:
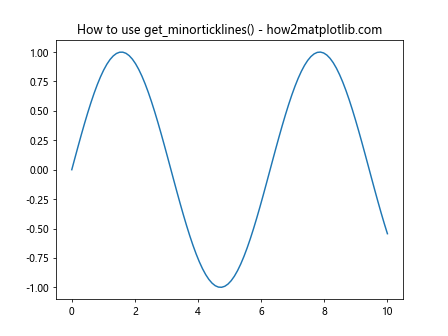
In this example, we create a simple sine wave plot and then use the Matplotlib.axis.Axis.get_minorticklines() function to access the minor tick lines of the x-axis. We then iterate through these lines and customize their appearance by changing their color and size.
Exploring the Parameters of Matplotlib.axis.Axis.get_minorticklines()
One of the key aspects of understanding the Matplotlib.axis.Axis.get_minorticklines() function is knowing that it doesn’t accept any parameters. This simplicity makes it straightforward to use, but it also means that any customization of the minor tick lines must be done after retrieving them.
Here’s an example that demonstrates this:
import matplotlib.pyplot as plt
import numpy as np

fig, ax = plt.subplots()
x = np.linspace(0, 2*np.pi, 100)
ax.plot(x, np.sin(x))

# Get minor tick lines for both x and y axes
x_minor_ticks = ax.xaxis.get_minorticklines()
y_minor_ticks = ax.yaxis.get_minorticklines()

# Customize x-axis minor tick lines
for line in x_minor_ticks:
    line.set_color('green')
    line.set_linewidth(1.5)

# Customize y-axis minor tick lines
for line in y_minor_ticks:
    line.set_color('blue')
    line.set_linewidth(1.5)

plt.title('Customizing Minor Tick Lines - how2matplotlib.com')
plt.show()
Output:
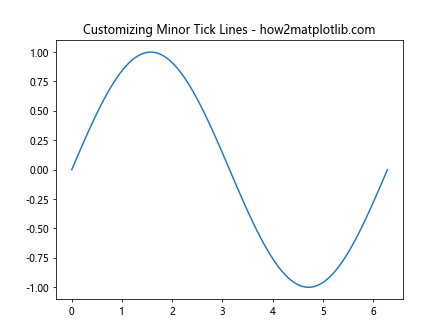
In this example, we retrieve the minor tick lines for both the x and y axes using the Matplotlib.axis.Axis.get_minorticklines() function. We then customize them separately, setting different colors for each axis.
Understanding the Return Value of Matplotlib.axis.Axis.get_minorticklines()
The Matplotlib.axis.Axis.get_minorticklines() function returns a list of Line2D objects. Each Line2D object represents a minor tick line on the axis. This return value is crucial because it allows you to access and modify individual minor tick lines.
Let’s look at an example that demonstrates how to work with these Line2D objects:
import matplotlib.pyplot as plt
import numpy as np

fig, ax = plt.subplots()
x = np.linspace(0, 5, 100)
ax.plot(x, x**2)

# Get minor tick lines
minor_ticks = ax.xaxis.get_minorticklines()

# Customize every other minor tick line
for i, line in enumerate(minor_ticks):
    if i % 2 == 0:
        line.set_color('red')
        line.set_markersize(4)
    else:
        line.set_color('blue')
        line.set_markersize(2)

plt.title('Alternating Minor Tick Lines - how2matplotlib.com')
plt.show()
Output:
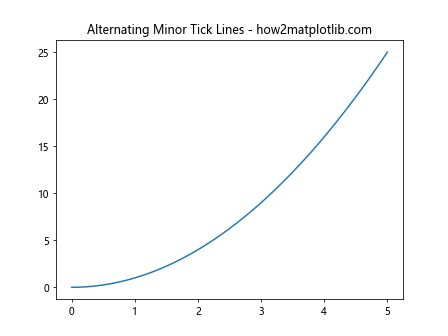
In this example, we use the Matplotlib.axis.Axis.get_minorticklines() function to get the minor tick lines, and then we customize every other line differently. This demonstrates the level of control you have over individual minor tick lines.
Practical Applications of Matplotlib.axis.Axis.get_minorticklines()
The Matplotlib.axis.Axis.get_minorticklines() function has numerous practical applications in data visualization. It’s particularly useful when you need to create plots with precise scales or when you want to highlight specific ranges on your axes.
Creating Custom Scientific Plots
The Matplotlib.axis.Axis.get_minorticklines() function is also valuable in creating custom scientific plots where precise measurements are crucial. Here’s an example of how you might use it in a physics-related plot:
import matplotlib.pyplot as plt
import numpy as np

fig, ax = plt.subplots(figsize=(10, 6))

# Generate data for a damped oscillation
t = np.linspace(0, 10, 1000)
y = np.exp(-0.5*t) * np.cos(2*np.pi*t)

ax.plot(t, y)

# Customize minor tick lines
x_minor_ticks = ax.xaxis.get_minorticklines()
y_minor_ticks = ax.yaxis.get_minorticklines()

for line in x_minor_ticks + y_minor_ticks:
    line.set_color('red')
    line.set_markersize(2)

ax.set_xlabel('Time (s)')
ax.set_ylabel('Amplitude')
ax.set_title('Damped Oscillation - how2matplotlib.com')

plt.show()
Output:
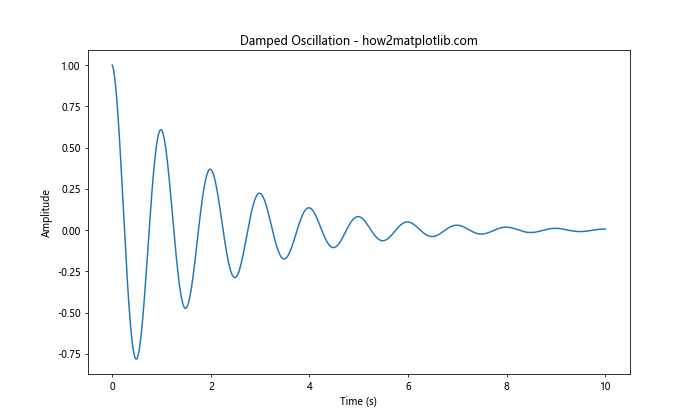
In this example, we create a plot of a damped oscillation and use the Matplotlib.axis.Axis.get_minorticklines() function to customize both the x and y axis minor tick lines. This enhances the readability of the plot, making it easier to estimate values between the major tick marks.
Advanced Techniques with Matplotlib.axis.Axis.get_minorticklines()
While the basic usage of the Matplotlib.axis.Axis.get_minorticklines() function is straightforward, there are several advanced techniques you can employ to create more sophisticated visualizations.
Combining Major and Minor Tick Line Customization
One advanced technique is to combine the customization of both major and minor tick lines to create a hierarchical visual structure. Here’s an example:
import matplotlib.pyplot as plt
import numpy as np

fig, ax = plt.subplots(figsize=(10, 6))

x = np.linspace(0, 10, 100)
y = np.sin(x) * np.exp(-0.1 * x)

ax.plot(x, y)

# Customize major tick lines
major_ticks = ax.xaxis.get_majorticklines()
for line in major_ticks:
    line.set_color('blue')
    line.set_linewidth(2)

# Customize minor tick lines
minor_ticks = ax.xaxis.get_minorticklines()
for line in minor_ticks:
    line.set_color('red')
    line.set_linewidth(1)

ax.set_title('Hierarchical Tick Lines - how2matplotlib.com')
plt.show()
Output:
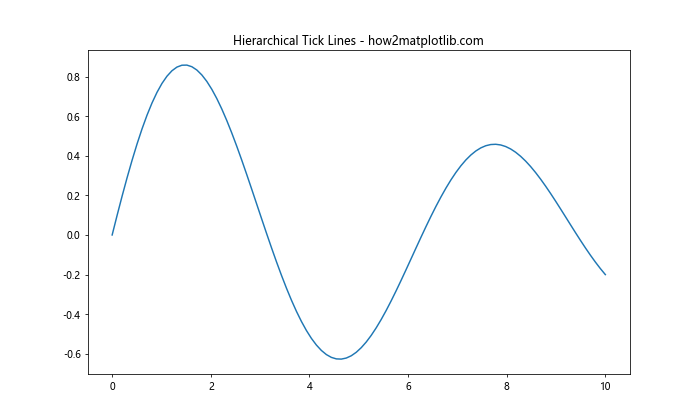
In this example, we use both get_majorticklines() and get_minorticklines() to create a clear visual hierarchy between major and minor tick marks.
Creating Custom Tick Line Patterns
Another advanced technique is to create custom patterns with your minor tick lines. This can be useful for emphasizing certain ranges or creating unique visual effects.
Here’s an example:
import matplotlib.pyplot as plt
import numpy as np

fig, ax = plt.subplots(figsize=(10, 6))

x = np.linspace(0, 20, 200)
y = np.sin(x) + np.random.normal(0, 0.1, 200)

ax.plot(x, y)

# Get minor tick lines
minor_ticks = ax.xaxis.get_minorticklines()

# Create a custom pattern
for i, line in enumerate(minor_ticks):
    if i % 3 == 0:
        line.set_color('red')
        line.set_linewidth(2)
    elif i % 3 == 1:
        line.set_color('green')
        line.set_linewidth(1.5)
    else:
        line.set_color('blue')
        line.set_linewidth(1)

ax.set_title('Custom Tick Line Pattern - how2matplotlib.com')
plt.show()
Output:
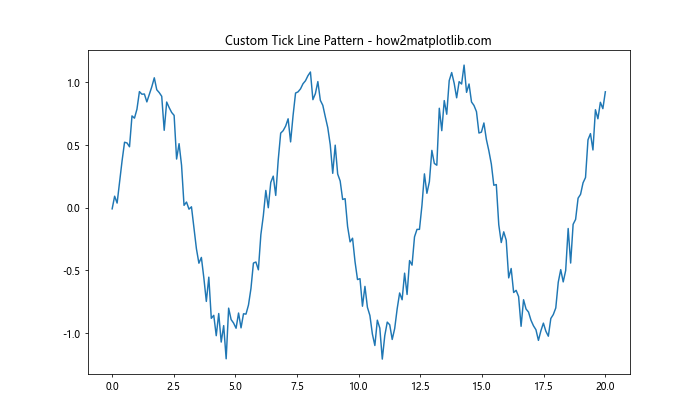
In this example, we create a repeating pattern of red, green, and blue minor tick lines with varying widths.
Common Pitfalls and How to Avoid Them
While the Matplotlib.axis.Axis.get_minorticklines() function is powerful, there are some common pitfalls that users might encounter. Let’s discuss these and how to avoid them.
Pitfall 1: Forgetting to Enable Minor Ticks
One common mistake is forgetting to enable minor ticks before using the get_minorticklines() function. If minor ticks are not enabled, the function will return an empty list.
Here’s how to avoid this:
import matplotlib.pyplot as plt
import numpy as np

fig, ax = plt.subplots()

x = np.linspace(0, 10, 100)
ax.plot(x, np.sin(x))

# Enable minor ticks
ax.minorticks_on()

# Now get and customize minor tick lines
minor_ticks = ax.xaxis.get_minorticklines()
for line in minor_ticks:
    line.set_color('red')

plt.title('Enabled Minor Ticks - how2matplotlib.com')
plt.show()
Output:
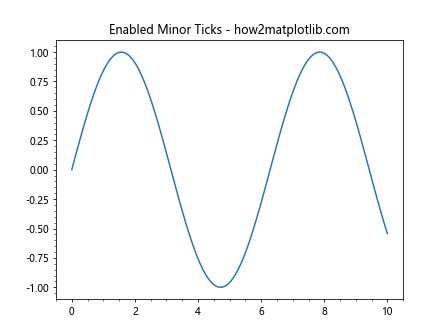
In this example, we explicitly enable minor ticks using ax.minorticks_on() before using get_minorticklines().
Pitfall 2: Overwriting Tick Line Properties
Another common mistake is accidentally overwriting tick line properties when you only meant to modify them. This can happen if you’re not careful with how you set properties.
Here’s an example of how to avoid this:
import matplotlib.pyplot as plt
import numpy as np

fig, ax = plt.subplots()

x = np.linspace(0, 10, 100)
ax.plot(x, np.cos(x))

minor_ticks = ax.xaxis.get_minorticklines()

# Incorrect way (overwrites all properties):
# for line in minor_ticks:
#     line.set(color='red', linewidth=2)

# Correct way (only modifies specified properties):
for line in minor_ticks:
    line.set_color('red')
    line.set_linewidth(2)

plt.title('Correctly Modified Tick Lines - how2matplotlib.com')
plt.show()
Output:
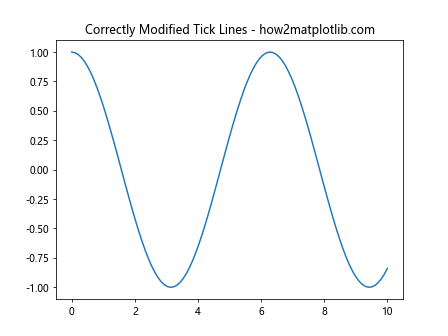
In this example, we show the correct way to modify specific properties of the tick lines without overwriting other properties.
Integrating Matplotlib.axis.Axis.get_minorticklines() with Other Matplotlib Features
The Matplotlib.axis.Axis.get_minorticklines() function can be effectively integrated with other Matplotlib features to create more complex and informative visualizations.
Combining with GridSpec
One powerful combination is using get_minorticklines() with GridSpec, which allows you to create complex grid layouts of subplots. Here’s an example:
import matplotlib.pyplot as plt
import matplotlib.gridspec as gridspec
import numpy as np

fig = plt.figure(figsize=(12, 8))
gs = gridspec.GridSpec(2, 2)

ax1 = fig.add_subplot(gs[0, 0])
ax2 = fig.add_subplot(gs[0, 1])
ax3 = fig.add_subplot(gs[1, :])

x = np.linspace(0, 10, 100)

ax1.plot(x, np.sin(x))
ax2.plot(x, np.cos(x))
ax3.plot(x, np.tan(x))

for ax in [ax1, ax2, ax3]:
    ax.minorticks_on()
    minor_ticks = ax.xaxis.get_minorticklines()
    for line in minor_ticks:
        line.set_color('red')
        line.set_linewidth(0.5)

fig.suptitle('GridSpec with Customized Minor Ticks - how2matplotlib.com')
plt.tight_layout()
plt.show()
Output:
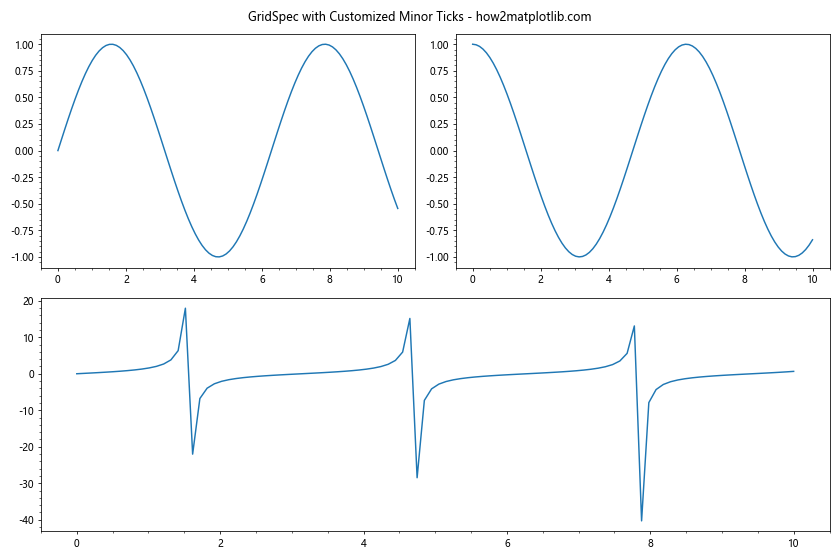
In this example, we create a complex layout using GridSpec and then apply custom minor tick lines to each subplot using get_minorticklines().
Using with 3D Plots
The Matplotlib.axis.Axis.get_minorticklines() function can also be used with 3D plots. Here’s an example:
import matplotlib.pyplot as plt
import numpy as np
from mpl_toolkits.mplot3d import Axes3D

fig = plt.figure(figsize=(10, 8))
ax = fig.add_subplot(111, projection='3d')

x = np.linspace(-5, 5, 100)
y = np.linspace(-5, 5, 100)
X, Y = np.meshgrid(x, y)
Z = np.sin(np.sqrt(X**2 + Y**2))

ax.plot_surface(X, Y, Z)

for axis in [ax.xaxis, ax.yaxis, ax.zaxis]:
    axis.set_minor_locator(plt.MultipleLocator(5))
    minor_ticks = axis.get_minorticklines()
    for line in minor_ticks:
        line.set_color('red')
        line.set_linewidth(0.5)

ax.set_title('3D Plot with Customized Minor Ticks - how2matplotlib.com')
plt.show()
Output:

In this example, we create a 3D surface plot and customize the minor tick lines for all three axes using the Matplotlib.axis.Axis.get_minorticklines() function.
Best Practices for Using Matplotlib.axis.Axis.get_minorticklines()
To make the most of the Matplotlib.axis.Axis.get_minorticklines() function, it’s important to follow some best practices:
- Always enable minor ticks before using get_minorticklines().
- Be consistent with your customizations across different plots in the same figure.
- Use colors and line widths that complement your overall plot design.
- Avoid overcomplicating your plots with too many customized minor tick lines.
- Consider the purpose of your visualization when deciding how to customize minor tick lines.
Here’s an example that demonstrates these best practices:
import matplotlib.pyplot as plt
import numpy as np

fig, (ax1, ax2) = plt.subplots(2, 1, figsize=(10, 10))

x = np.linspace(0, 10, 100)
ax1.plot(x, np.sin(x))
ax2.plot(x, np.cos(x))

for ax in [ax1, ax2]:
    ax.minorticks_on()
    for axis in [ax.xaxis, ax.yaxis]:
        minor_ticks = axis.get_minorticklines()
        for line in minor_ticks:
            line.set_color('gray')
            line.set_linewidth(0.5)

    ax.grid(which='minor', alpha=0.2)
    ax.grid(which='major', alpha=0.5)

ax1.set_title('Sine Wave - how2matplotlib.com')
ax2.set_title('Cosine Wave - how2matplotlib.com')
fig.suptitle('Best Practices for Minor Tick Lines', fontsize=16)

plt.tight_layout()
plt.show()
Output:
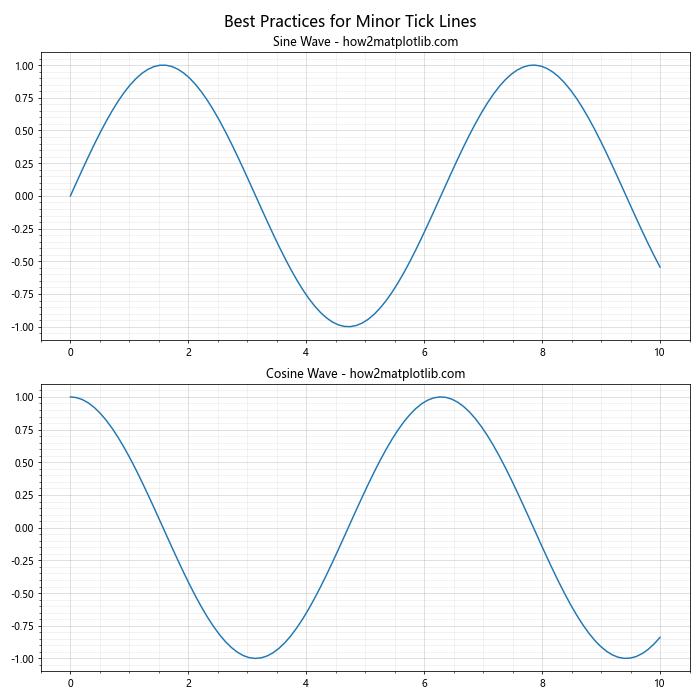
In this example, we create two subplots with consistent minor tick line customization. We use subtle colors and line widths that complement the overall design, and we add minor gridlines to enhance readability without overcomplicating the plot.
Troubleshooting Common Issues with Matplotlib.axis.Axis.get_minorticklines()
Even when following best practices, you might encounter some issues when using the Matplotlib.axis.Axis.get_minorticklines() function. Here are some common problems and their solutions:
Issue 1: Minor Tick Lines Not Appearing
If you’ve customized your minor tick lines but they’re not appearing on your plot, it could be due to several reasons:
- Minor ticks are not enabled.
- The axis limits are too narrow to show minor ticks.
- The minor tick locator is not set correctly.
Here’s an example that addresses these issues:
import matplotlib.pyplot as plt
import numpy as np

fig, ax = plt.subplots()

x = np.linspace(0, 10, 100)
ax.plot(x, np.sin(x))

# Enable minor ticks
ax.minorticks_on()

# Set appropriate axis limits
ax.set_xlim(0, 10)

# Set minor tick locator
ax.xaxis.set_minor_locator(plt.MultipleLocator(0.5))

# Customize minor tick lines
minor_ticks = ax.xaxis.get_minorticklines()
for line in minor_ticks:
    line.set_color('red')
    line.set_linewidth(0.5)

plt.title('Troubleshooting Minor Tick Lines - how2matplotlib.com')
plt.show()
Output:
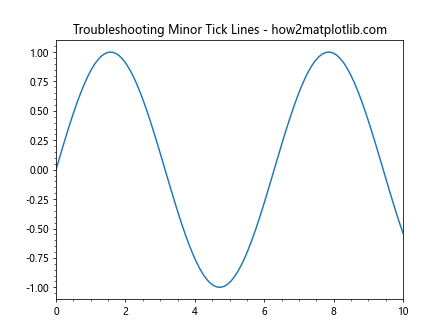
In this example, we explicitly enable minor ticks, set appropriate axis limits, and use a MultipleLocator to ensure minor ticks appear at regular intervals.
Issue 2: Inconsistent Minor Tick Line Appearance
Sometimes, you might notice that your minor tick lines appear inconsistent across different plots or axes. This can often be resolved by explicitly setting the minor tick locator for all axes:
import matplotlib.pyplot as plt
import numpy as np

fig, (ax1, ax2) = plt.subplots(1, 2, figsize=(12, 5))

x = np.linspace(0, 10, 100)
ax1.plot(x, np.sin(x))
ax2.plot(x, np.cos(x))

for ax in [ax1, ax2]:
    ax.minorticks_on()
    ax.xaxis.set_minor_locator(plt.MultipleLocator(0.5))
    ax.yaxis.set_minor_locator(plt.MultipleLocator(0.1))

    for axis in [ax.xaxis, ax.yaxis]:
        minor_ticks = axis.get_minorticklines()
        for line in minor_ticks:
            line.set_color('green')
            line.set_linewidth(0.5)

ax1.set_title('Sine Wave - how2matplotlib.com')
ax2.set_title('Cosine Wave - how2matplotlib.com')
fig.suptitle('Consistent Minor Tick Lines', fontsize=16)

plt.tight_layout()
plt.show()
Output:
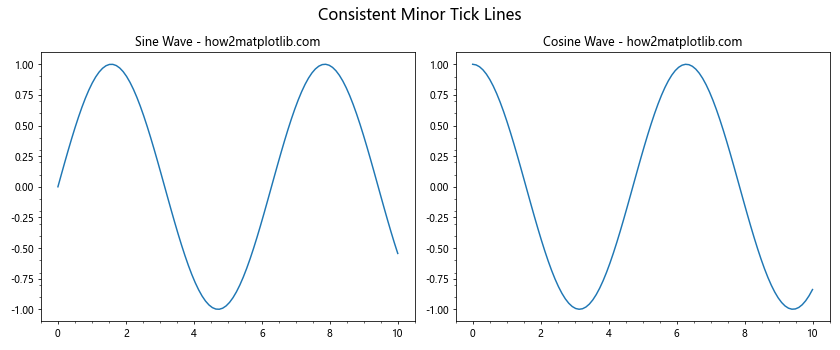
In this example, we set the same minor tick locator for both axes on both subplots, ensuring consistent minor tick line appearance.
Advanced Customization Techniques
For those looking to push the boundaries of what’s possible with the Matplotlib.axis.Axis.get_minorticklines() function, here are some advanced customization techniques:
Technique 1: Dynamic Minor Tick Line Colors
You can create dynamic minor tick line colors that change based on their position:
import matplotlib.pyplot as plt
import numpy as np

fig, ax = plt.subplots(figsize=(10, 6))

x = np.linspace(0, 10, 100)
ax.plot(x, np.sin(x))

ax.minorticks_on()
ax.xaxis.set_minor_locator(plt.MultipleLocator(0.1))

minor_ticks = ax.xaxis.get_minorticklines()
for i, line in enumerate(minor_ticks):
    line.set_color(plt.cm.viridis(i / len(minor_ticks)))
    line.set_linewidth(1)

plt.title('Dynamic Minor Tick Line Colors - how2matplotlib.com')
plt.show()
Output:
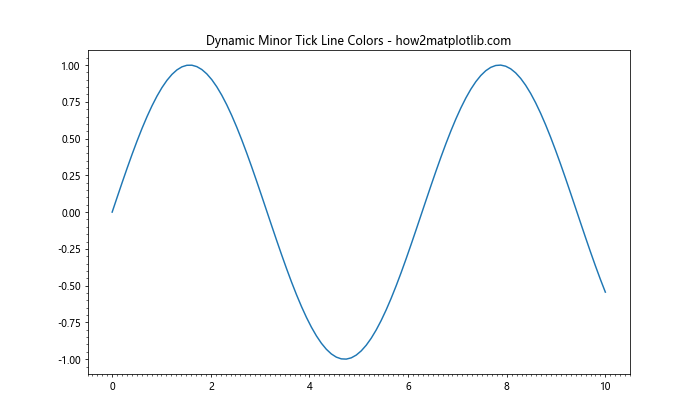
In this example, we use a color map to assign different colors to minor tick lines based on their position.
Technique 2: Animated Minor Tick Lines
You can create animated minor tick lines for dynamic visualizations:
import matplotlib.pyplot as plt
import numpy as np
import matplotlib.animation as animation

fig, ax = plt.subplots(figsize=(10, 6))

x = np.linspace(0, 10, 100)
line, = ax.plot(x, np.sin(x))

ax.minorticks_on()
ax.xaxis.set_minor_locator(plt.MultipleLocator(0.1))

minor_ticks = ax.xaxis.get_minorticklines()

def animate(frame):
    line.set_ydata(np.sin(x + frame/10))
    for i, tick_line in enumerate(minor_ticks):
        tick_line.set_color(plt.cm.viridis((i + frame) % len(minor_ticks) / len(minor_ticks)))
    return minor_ticks + [line]

ani = animation.FuncAnimation(fig, animate, frames=100, interval=50, blit=True)

plt.title('Animated Minor Tick Lines - how2matplotlib.com')
plt.show()
Output:
This example creates an animation where both the plotted sine wave and the colors of the minor tick lines change over time.
Conclusion
The Matplotlib.axis.Axis.get_minorticklines() function is a powerful tool in the Matplotlib library that allows for fine-grained control over the appearance of minor tick lines in your plots. By mastering this function, you can create more detailed, informative, and visually appealing data visualizations.
Throughout this comprehensive guide, we’ve explored the basics of using get_minorticklines(), delved into advanced techniques, addressed common pitfalls, and demonstrated how to integrate this function with other Matplotlib features. We’ve seen how this function can be used to enhance various types of plots, from simple line graphs to complex 3D visualizations.