Comprehensive Guide to Matplotlib.axis.Axis.get_minorticklocs() Function in Python
Matplotlib.axis.Axis.get_minorticklocs() function in Python is a powerful tool for retrieving the locations of minor ticks on an axis in Matplotlib plots. This function is an essential component of the Matplotlib library, which is widely used for creating high-quality visualizations in Python. In this comprehensive guide, we will explore the Matplotlib.axis.Axis.get_minorticklocs() function in depth, covering its usage, parameters, return values, and practical applications in various plotting scenarios.
Understanding the Basics of Matplotlib.axis.Axis.get_minorticklocs()
The Matplotlib.axis.Axis.get_minorticklocs() function is a method of the Axis class in Matplotlib. Its primary purpose is to return an array of locations for the minor tick marks on an axis. These minor ticks are smaller marks that appear between the major tick marks, providing additional granularity to the axis scale.
Let’s start with a simple example to demonstrate the basic usage of Matplotlib.axis.Axis.get_minorticklocs():
import matplotlib.pyplot as plt
import numpy as np

# Create a simple plot
fig, ax = plt.subplots()
x = np.linspace(0, 10, 100)
y = np.sin(x)
ax.plot(x, y)

# Get minor tick locations
minor_ticks = ax.xaxis.get_minorticklocs()

print("Minor tick locations:", minor_ticks)

plt.title("How2matplotlib.com - Basic Usage of get_minorticklocs()")
plt.show()
Output:
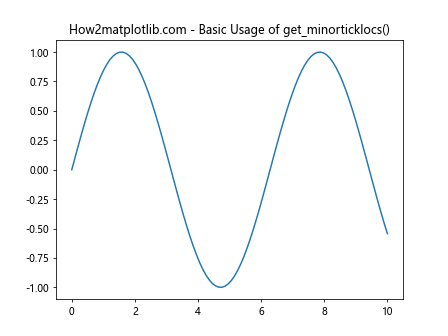
In this example, we create a simple sine wave plot and then use the Matplotlib.axis.Axis.get_minorticklocs() function to retrieve the locations of minor ticks on the x-axis. The function returns an array of values representing the positions of minor ticks.
Customizing Minor Ticks with Matplotlib.axis.Axis.get_minorticklocs()
One of the key advantages of using Matplotlib.axis.Axis.get_minorticklocs() is the ability to customize the appearance and behavior of minor ticks. By combining this function with other Matplotlib methods, you can create highly tailored visualizations.
Here’s an example that demonstrates how to customize minor ticks:
import matplotlib.pyplot as plt
import numpy as np

fig, ax = plt.subplots(figsize=(10, 6))

x = np.linspace(0, 10, 100)
y = np.exp(x)

ax.plot(x, y)

# Set major and minor ticks
ax.xaxis.set_major_locator(plt.MultipleLocator(2))
ax.xaxis.set_minor_locator(plt.MultipleLocator(0.5))

# Get minor tick locations
minor_ticks = ax.xaxis.get_minorticklocs()

# Customize minor ticks
ax.tick_params(axis='x', which='minor', length=4, color='red')

plt.title("How2matplotlib.com - Customizing Minor Ticks")
plt.xlabel("X-axis")
plt.ylabel("Y-axis")
plt.show()

print("Minor tick locations:", minor_ticks)
Output:
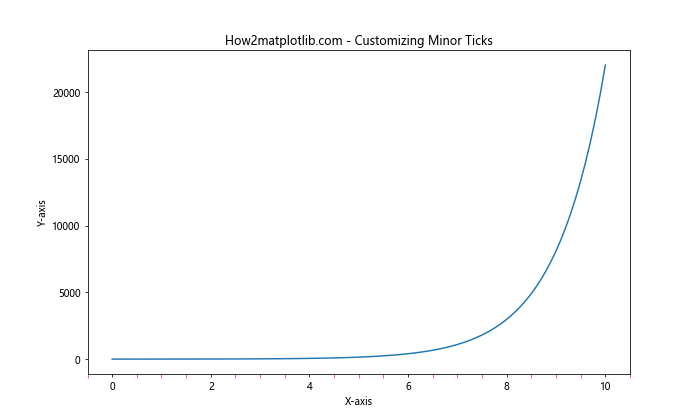
In this example, we set custom major and minor tick locations using MultipleLocator. We then use Matplotlib.axis.Axis.get_minorticklocs() to retrieve the minor tick locations and customize their appearance using tick_params.
Applying Matplotlib.axis.Axis.get_minorticklocs() to Different Axis Types
The Matplotlib.axis.Axis.get_minorticklocs() function can be applied to both x and y axes, as well as to different types of plots. Let’s explore how to use this function with various axis types.
Linear Axis
import matplotlib.pyplot as plt
import numpy as np

fig, ax = plt.subplots(figsize=(10, 6))

x = np.linspace(0, 10, 100)
y = x**2

ax.plot(x, y)

# Get minor tick locations for both axes
x_minor_ticks = ax.xaxis.get_minorticklocs()
y_minor_ticks = ax.yaxis.get_minorticklocs()

print("X-axis minor tick locations:", x_minor_ticks)
print("Y-axis minor tick locations:", y_minor_ticks)

plt.title("How2matplotlib.com - Linear Axis Minor Ticks")
plt.xlabel("X-axis")
plt.ylabel("Y-axis")
plt.show()
Output:
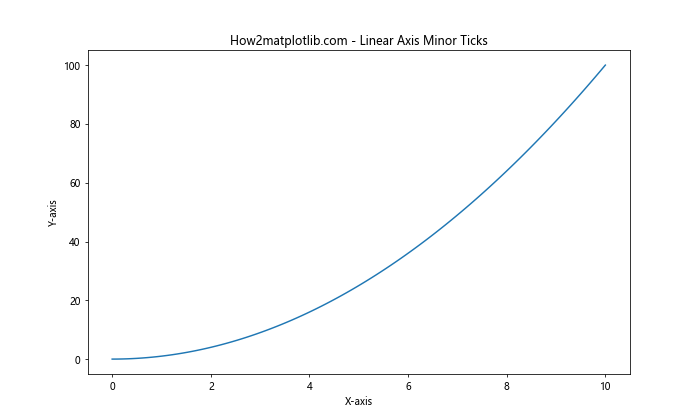
This example demonstrates how to use Matplotlib.axis.Axis.get_minorticklocs() on both x and y axes of a linear plot.
Logarithmic Axis
import matplotlib.pyplot as plt
import numpy as np

fig, ax = plt.subplots(figsize=(10, 6))

x = np.logspace(0, 3, 100)
y = x**2

ax.loglog(x, y)

# Get minor tick locations for logarithmic axes
x_minor_ticks = ax.xaxis.get_minorticklocs()
y_minor_ticks = ax.yaxis.get_minorticklocs()

print("X-axis minor tick locations (log scale):", x_minor_ticks)
print("Y-axis minor tick locations (log scale):", y_minor_ticks)

plt.title("How2matplotlib.com - Logarithmic Axis Minor Ticks")
plt.xlabel("X-axis (log scale)")
plt.ylabel("Y-axis (log scale)")
plt.show()
Output:
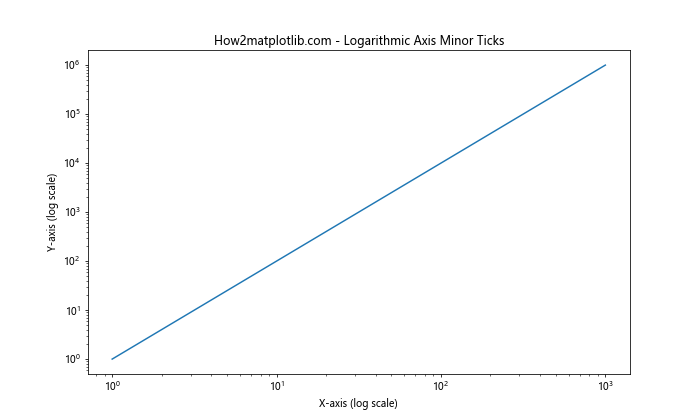
This example shows how Matplotlib.axis.Axis.get_minorticklocs() works with logarithmic axes.
Advanced Applications of Matplotlib.axis.Axis.get_minorticklocs()
Now that we’ve covered the basics, let’s explore some advanced applications of the Matplotlib.axis.Axis.get_minorticklocs() function.
Custom Tick Formatting
You can use Matplotlib.axis.Axis.get_minorticklocs() in combination with custom tick formatters to create unique axis labels:
import matplotlib.pyplot as plt
import numpy as np
from matplotlib.ticker import FuncFormatter

def custom_formatter(x, pos):
    return f"${x:.2f}"

fig, ax = plt.subplots(figsize=(10, 6))

x = np.linspace(0, 10, 100)
y = np.sin(x)

ax.plot(x, y)

# Set custom formatter
ax.xaxis.set_major_formatter(FuncFormatter(custom_formatter))

# Get minor tick locations
minor_ticks = ax.xaxis.get_minorticklocs()

# Set minor tick labels
ax.set_xticks(minor_ticks, minor=True)
ax.set_xticklabels([f"${t:.2f}" for t in minor_ticks], minor=True)

plt.title("How2matplotlib.com - Custom Tick Formatting")
plt.xlabel("X-axis")
plt.ylabel("Y-axis")
plt.show()
Output:
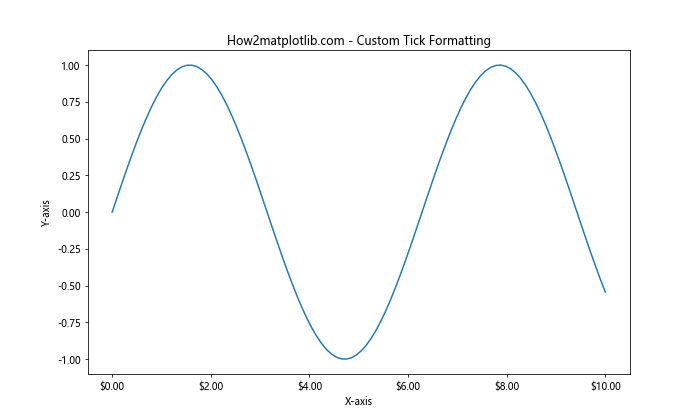
In this example, we use a custom formatter to display tick labels as currency values and apply it to both major and minor ticks.
Dynamic Tick Adjustment
You can use Matplotlib.axis.Axis.get_minorticklocs() to dynamically adjust tick locations based on the data range:
import matplotlib.pyplot as plt
import numpy as np

def adjust_ticks(ax, num_ticks=10):
    data_range = ax.get_xlim()
    major_step = (data_range[1] - data_range[0]) / num_ticks

    ax.xaxis.set_major_locator(plt.MultipleLocator(major_step))
    ax.xaxis.set_minor_locator(plt.MultipleLocator(major_step / 5))

    minor_ticks = ax.xaxis.get_minorticklocs()
    return minor_ticks

fig, ax = plt.subplots(figsize=(10, 6))

x = np.linspace(0, 100, 1000)
y = np.sin(x / 10) * np.exp(-x / 50)

ax.plot(x, y)

minor_ticks = adjust_ticks(ax)

plt.title("How2matplotlib.com - Dynamic Tick Adjustment")
plt.xlabel("X-axis")
plt.ylabel("Y-axis")
plt.show()

print("Dynamically adjusted minor tick locations:", minor_ticks)
Output:
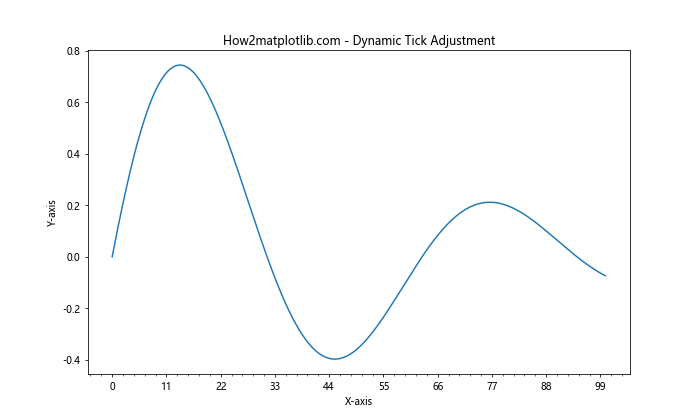
This example demonstrates how to use Matplotlib.axis.Axis.get_minorticklocs() in a function that dynamically adjusts tick locations based on the data range.
Handling Edge Cases with Matplotlib.axis.Axis.get_minorticklocs()
When working with Matplotlib.axis.Axis.get_minorticklocs(), it’s important to consider edge cases and potential issues that may arise. Let’s explore some scenarios and how to handle them.
Empty Axis
When dealing with an empty axis or a plot without any data, Matplotlib.axis.Axis.get_minorticklocs() may return unexpected results:
import matplotlib.pyplot as plt

fig, ax = plt.subplots()

# Empty plot
minor_ticks = ax.xaxis.get_minorticklocs()

print("Minor tick locations for empty plot:", minor_ticks)

plt.title("How2matplotlib.com - Empty Axis")
plt.show()
Output:
In this case, Matplotlib.axis.Axis.get_minorticklocs() will return the default minor tick locations based on the current axis limits.
Very Small or Large Data Ranges
When working with very small or large data ranges, the minor tick locations returned by Matplotlib.axis.Axis.get_minorticklocs() may not be ideal:
import matplotlib.pyplot as plt
import numpy as np

fig, (ax1, ax2) = plt.subplots(2, 1, figsize=(10, 10))

# Very small range
x_small = np.linspace(0, 1e-6, 100)
y_small = x_small**2
ax1.plot(x_small, y_small)
small_minor_ticks = ax1.xaxis.get_minorticklocs()

# Very large range
x_large = np.linspace(0, 1e9, 100)
y_large = x_large**2
ax2.plot(x_large, y_large)
large_minor_ticks = ax2.xaxis.get_minorticklocs()

print("Minor tick locations for small range:", small_minor_ticks)
print("Minor tick locations for large range:", large_minor_ticks)

ax1.set_title("How2matplotlib.com - Very Small Range")
ax2.set_title("How2matplotlib.com - Very Large Range")
plt.tight_layout()
plt.show()
Output:
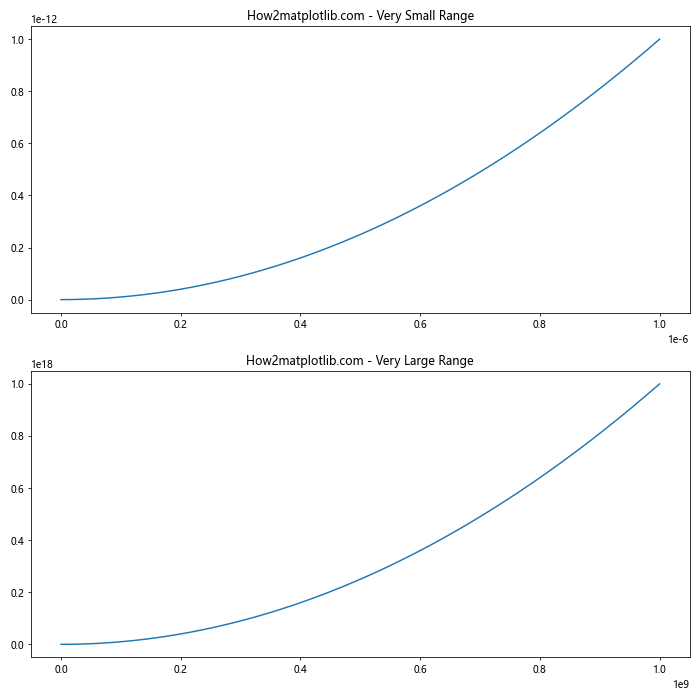
In these cases, you may need to manually adjust the tick locators or use specialized scaling techniques to ensure appropriate minor tick placement.
Combining Matplotlib.axis.Axis.get_minorticklocs() with Other Matplotlib Features
The Matplotlib.axis.Axis.get_minorticklocs() function can be combined with various other Matplotlib features to create more complex and informative visualizations. Let’s explore some of these combinations.
Using get_minorticklocs() with Multiple Subplots
You can use Matplotlib.axis.Axis.get_minorticklocs() to synchronize minor tick locations across multiple subplots:
import matplotlib.pyplot as plt
import numpy as np

fig, (ax1, ax2) = plt.subplots(2, 1, figsize=(10, 10), sharex=True)

x = np.linspace(0, 10, 100)
y1 = np.sin(x)
y2 = np.cos(x)

ax1.plot(x, y1)
ax2.plot(x, y2)

# Get minor tick locations from the shared x-axis
minor_ticks = ax1.xaxis.get_minorticklocs()

# Customize minor ticks for both subplots
for ax in (ax1, ax2):
    ax.set_xticks(minor_ticks, minor=True)
    ax.tick_params(axis='x', which='minor', length=4, color='red')

ax1.set_title("How2matplotlib.com - Subplot 1")
ax2.set_title("How2matplotlib.com - Subplot 2")
plt.tight_layout()
plt.show()

print("Shared minor tick locations:", minor_ticks)
Output:
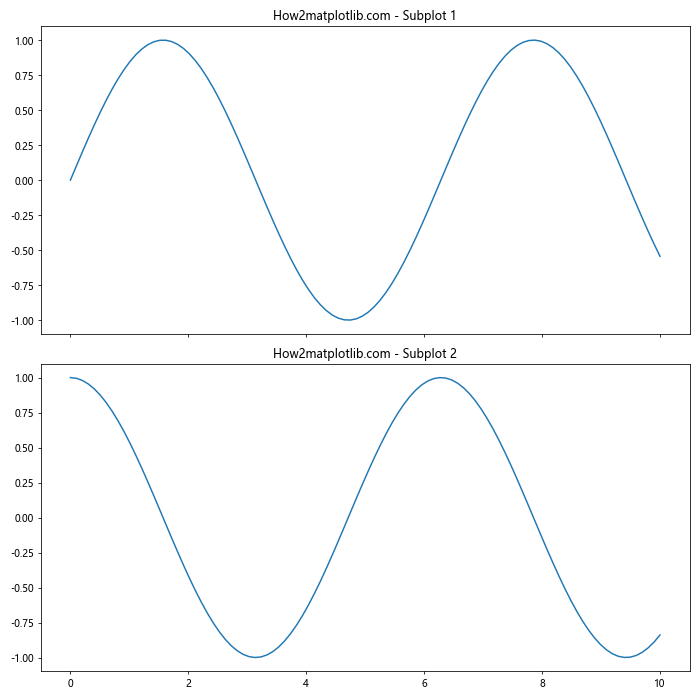
This example demonstrates how to use Matplotlib.axis.Axis.get_minorticklocs() to ensure consistent minor tick placement across multiple subplots.
Combining get_minorticklocs() with Colorbar
You can also use Matplotlib.axis.Axis.get_minorticklocs() to customize the minor ticks on a colorbar:
import matplotlib.pyplot as plt
import numpy as np

fig, ax = plt.subplots(figsize=(10, 6))

x = np.linspace(0, 10, 100)
y = np.linspace(0, 10, 100)
X, Y = np.meshgrid(x, y)
Z = np.sin(X) * np.cos(Y)

im = ax.imshow(Z, extent=[0, 10, 0, 10], origin='lower', cmap='viridis')
cbar = plt.colorbar(im)

# Get minor tick locations for the colorbar
minor_ticks = cbar.ax.yaxis.get_minorticklocs()

# Customize minor ticks on the colorbar
cbar.ax.yaxis.set_ticks(minor_ticks, minor=True)
cbar.ax.tick_params(axis='y', which='minor', length=4, color='red')

plt.title("How2matplotlib.com - Colorbar with Custom Minor Ticks")
plt.xlabel("X-axis")
plt.ylabel("Y-axis")
plt.show()

print("Colorbar minor tick locations:", minor_ticks)
Output:
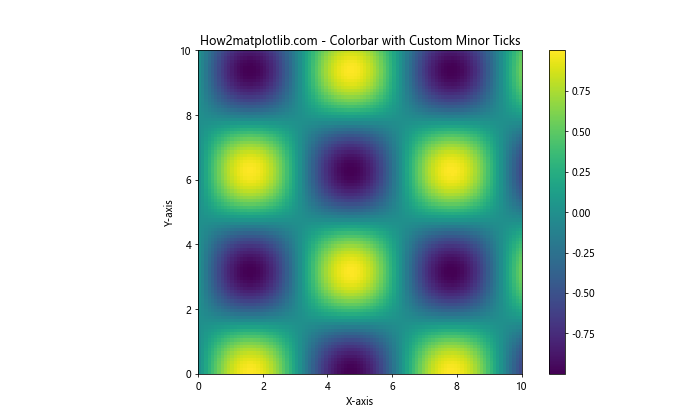
This example shows how to use Matplotlib.axis.Axis.get_minorticklocs() to customize the minor ticks on a colorbar associated with an image plot.
Common Pitfalls and How to Avoid Them
When working with Matplotlib.axis.Axis.get_minorticklocs(), there are several common pitfalls that you should be aware of and know how to avoid:
- Inconsistent tick spacing: Sometimes, the minor tick locations returned by Matplotlib.axis.Axis.get_minorticklocs() may not be evenly spaced, especially when using automatic tick locators. To avoid this, you can use a specific locator like MultipleLocator or LinearLocator.
import matplotlib.pyplot as plt
import numpy as np
from matplotlib.ticker import MultipleLocator

fig, (ax1, ax2) = plt.subplots(2, 1, figsize=(10, 10))

x = np.linspace(0, 10, 100)
y = np.sin(x)

ax1.plot(x, y)
ax1.xaxis.set_minor_locator(AutoMinorLocator())
ax1.set_title("How2matplotlib.com - AutoMinorLocator")

ax2.plot(x, y)
ax2.xaxis.set_minor_locator(MultipleLocator(0.5))
ax2.set_title("How2matplotlib.com - MultipleLocator")

for ax in (ax1, ax2):
    minor_ticks = ax.xaxis.get_minorticklocs()
    print(f"Minor tick locations for {ax.get_title()}:", minor_ticks)

plt.tight_layout()
plt.show()
- Overlapping ticks: In some cases, especially with logarithmic scales, minor ticks may overlap with major ticks. To avoid this, you can filter out minor ticks that coincide with major ticks:
import matplotlib.pyplot as plt
import numpy as np

fig, ax = plt.subplots(figsize=(10, 6))

x = np.logspace(0, 3, 100)
y = x**2

ax.loglog(x, y)

major_ticks = ax.xaxis.get_majorticklocs()
minor_ticks = ax.xaxis.get_minorticklocs()

# Filter out minor ticks that coincide with major ticks
filtered_minor_ticks = [tick for tick in minor_ticks if tick not in major_ticks]

ax.set_xticks(filtered_minor_ticks, minor=True)
ax.tick_params(axis='x', which='minor', length=4, color='red')

plt.title("How2matplotlib.com - Filtered Minor Ticks (Log Scale)")
plt.xlabel("X-axis")
plt.ylabel("Y-axis")
plt.show()

print("Filtered minor tick locations:", filtered_minor_ticks)
Output:
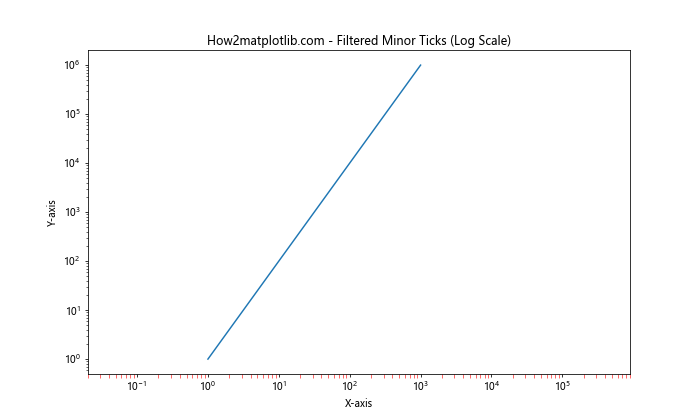
- Incorrect scale assumptions: When using Matplotlib.axis.Axis.get_minorticklocs() with different scales (e.g., linear, log, symlog), be aware that the returned values will be in the scale of the axis, not the data. Always consider the current scale when interpreting or using the returned values.
import matplotlib.pyplot as plt
import numpy as np

fig, (ax1, ax2) = plt.subplots(2, 1, figsize=(10, 10))

x = np.linspace(1, 1000, 100)
y = x**2

ax1.plot(x, y)
ax1.set_xscale('linear')
ax1.set_title("How2matplotlib.com - Linear Scale")

ax2.plot(x, y)
ax2.set_xscale('log')
ax2.set_title("How2matplotlib.com - Log Scale")

for ax in (ax1, ax2):
    minor_ticks = ax.xaxis.get_minorticklocs()
    print(f"Minor tick locations for {ax.get_title()}:", minor_ticks)

plt.tight_layout()
plt.show()
Output:
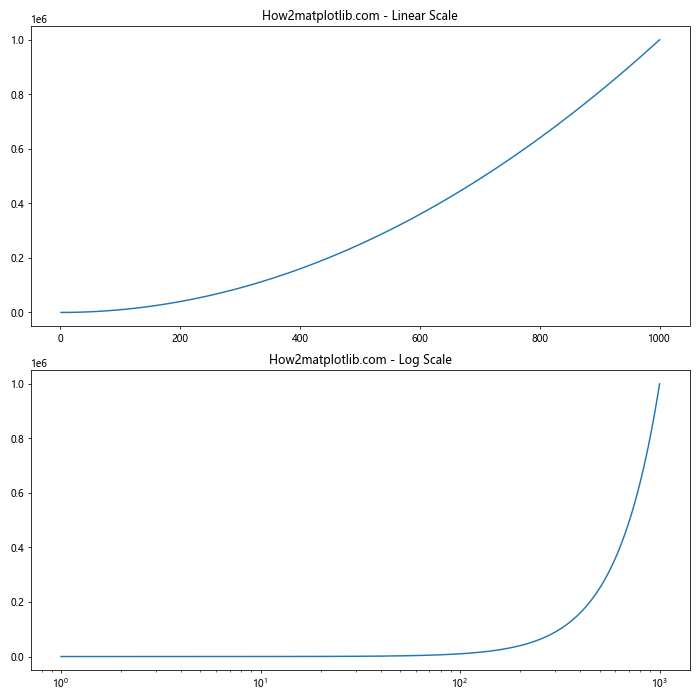
By being aware of these pitfalls and implementing the suggested solutions, you can ensure more reliable and consistent results when using Matplotlib.axis.Axis.get_minorticklocs().
Advanced Techniques with Matplotlib.axis.Axis.get_minorticklocs()
Now that we’ve covered the basics and common pitfalls, let’s explore some advanced techniques that leverage the Matplotlib.axis.Axis.get_minorticklocs() function to create more sophisticated visualizations.
Custom Tick Labeling Based on Minor Tick Locations
You can use the minor tick locations returned by Matplotlib.axis.Axis.get_minorticklocs() to create custom tick labels:
import matplotlib.pyplot as plt
import numpy as np

def custom_label(x):
    return f"[{x:.1f}]"

fig, ax = plt.subplots(figsize=(10, 6))

x = np.linspace(0, 10, 100)
y = np.sin(x)

ax.plot(x, y)

# Get minor tick locations
minor_ticks = ax.xaxis.get_minorticklocs()

# Set custom minor tick labels
ax.set_xticks(minor_ticks, minor=True)
ax.set_xticklabels([custom_label(t) for t in minor_ticks], minor=True)

ax.tick_params(axis='x', which='minor', labelsize=8, rotation=45)

plt.title("How2matplotlib.com - Custom Minor Tick Labels")
plt.xlabel("X-axis")
plt.ylabel("Y-axis")
plt.show()

print("Minor tick locations:", minor_ticks)
Output:
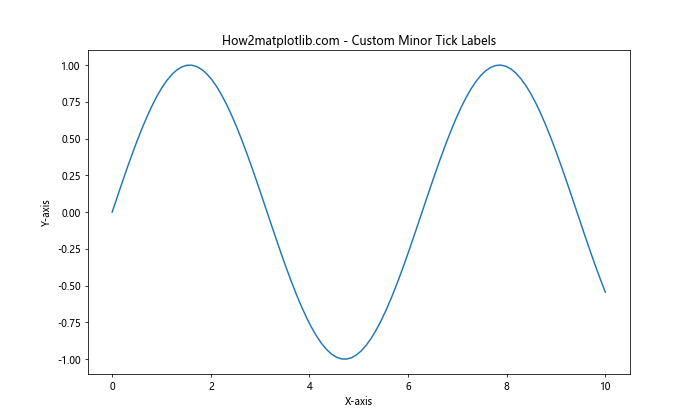
This example demonstrates how to use Matplotlib.axis.Axis.get_minorticklocs() to create custom labels for minor ticks.
Dynamic Tick Density Adjustment
You can use Matplotlib.axis.Axis.get_minorticklocs() to dynamically adjust the density of minor ticks based on the zoom level:
import matplotlib.pyplot as plt
import numpy as np

class DynamicTickAdjuster:
    def __init__(self, ax):
        self.ax = ax
        self.cid = ax.callbacks.connect('xlim_changed', self.on_xlim_change)

    def on_xlim_change(self, event):
        xlim = self.ax.get_xlim()
        range_size = xlim[1] - xlim[0]

        if range_size <= 10:
            self.ax.xaxis.set_minor_locator(plt.MultipleLocator(0.1))
        elif range_size <= 100:
            self.ax.xaxis.set_minor_locator(plt.MultipleLocator(1))
        else:
            self.ax.xaxis.set_minor_locator(plt.MultipleLocator(10))

        minor_ticks = self.ax.xaxis.get_minorticklocs()
        print("Updated minor tick locations:", minor_ticks)

        self.ax.figure.canvas.draw()

fig, ax = plt.subplots(figsize=(10, 6))

x = np.linspace(0, 1000, 10000)
y = np.sin(x / 10) * np.exp(-x / 500)

ax.plot(x, y)

adjuster = DynamicTickAdjuster(ax)

plt.title("How2matplotlib.com - Dynamic Tick Density Adjustment")
plt.xlabel("X-axis (try zooming)")
plt.ylabel("Y-axis")
plt.show()
Output:
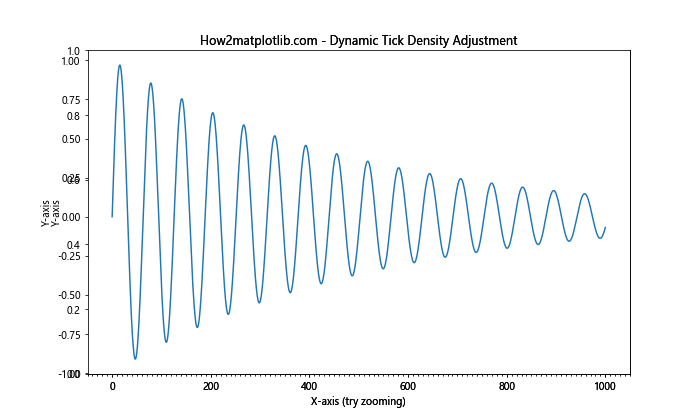
This example creates a class that dynamically adjusts the minor tick density based on the current zoom level, using Matplotlib.axis.Axis.get_minorticklocs() to verify the updated tick locations.
Combining Minor Ticks with Annotations
You can use the minor tick locations returned by Matplotlib.axis.Axis.get_minorticklocs() to place annotations at specific points:
import matplotlib.pyplot as plt
import numpy as np

fig, ax = plt.subplots(figsize=(12, 6))

x = np.linspace(0, 10, 100)
y = np.sin(x)

ax.plot(x, y)

# Get minor tick locations
minor_ticks = ax.xaxis.get_minorticklocs()

# Add annotations at every other minor tick
for i, tick in enumerate(minor_ticks[::2]):
    y_val = np.sin(tick)
    ax.annotate(f"Point {i}", (tick, y_val), xytext=(0, 10),
                textcoords="offset points", ha='center', va='bottom',
                bbox=dict(boxstyle="round,pad=0.3", fc="yellow", ec="b", lw=1, alpha=0.8))

ax.set_xticks(minor_ticks, minor=True)
ax.tick_params(axis='x', which='minor', length=4, color='red')

plt.title("How2matplotlib.com - Annotations at Minor Tick Locations")
plt.xlabel("X-axis")
plt.ylabel("Y-axis")
plt.show()

print("Minor tick locations used for annotations:", minor_ticks[::2])
Output:
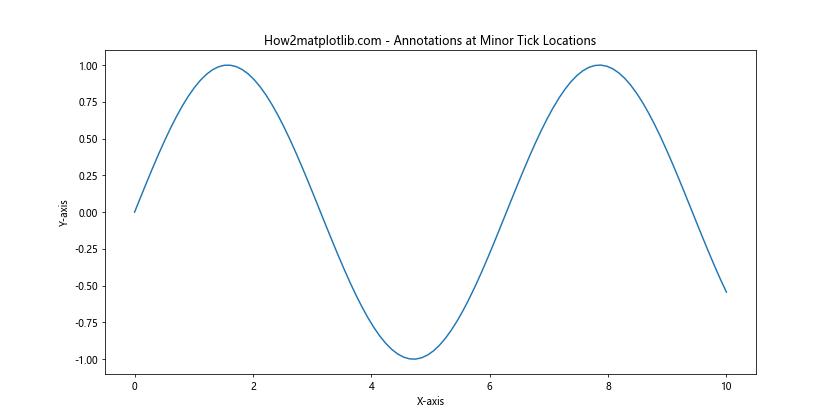
This example demonstrates how to use Matplotlib.axis.Axis.get_minorticklocs() to place annotations at specific minor tick locations.
Conclusion
The Matplotlib.axis.Axis.get_minorticklocs() function is a powerful tool for working with minor tick locations in Matplotlib. Throughout this comprehensive guide, we've explored its basic usage, advanced applications, common pitfalls, and best practices. By leveraging this function, you can create more informative and visually appealing plots with precise control over minor tick placement and appearance.
Some key takeaways from this guide include:
- Matplotlib.axis.Axis.get_minorticklocs() returns an array of minor tick locations for a given axis.
- It can be used in conjunction with other Matplotlib functions to customize tick appearance and behavior.
- The function works with different axis types and scales, including linear and logarithmic.
- Be aware of potential pitfalls such as inconsistent tick spacing and overlapping ticks, and implement appropriate solutions.
- Advanced techniques like dynamic tick adjustment and custom labeling can enhance the functionality of your plots.