Comprehensive Guide to Matplotlib.axis.Axis.get_minor_formatter() Function in Python
Matplotlib.axis.Axis.get_minor_formatter() function in Python is an essential method for customizing and retrieving the minor tick formatter in Matplotlib plots. This function is part of the Matplotlib library, which is widely used for creating static, animated, and interactive visualizations in Python. In this comprehensive guide, we’ll explore the Matplotlib.axis.Axis.get_minor_formatter() function in detail, covering its usage, parameters, return values, and practical applications in various plotting scenarios.
Understanding the Matplotlib.axis.Axis.get_minor_formatter() Function
The Matplotlib.axis.Axis.get_minor_formatter() function is used to retrieve the current minor tick formatter for a given axis. This function is particularly useful when you need to inspect or modify the formatting of minor tick labels in your plots. By using this function, you can access the formatter object and make further customizations to enhance the visual appeal and readability of your charts.
Let’s start with a simple example to demonstrate how to use the Matplotlib.axis.Axis.get_minor_formatter() function:
import matplotlib.pyplot as plt
import numpy as np

# Create a sample plot
x = np.linspace(0, 10, 100)
y = np.sin(x)

fig, ax = plt.subplots()
ax.plot(x, y)

# Get the minor formatter for the x-axis
minor_formatter = ax.xaxis.get_minor_formatter()

# Print the type of the minor formatter
print(f"Minor formatter type: {type(minor_formatter)}")

plt.title("How to use Matplotlib.axis.Axis.get_minor_formatter() - how2matplotlib.com")
plt.show()
Output:
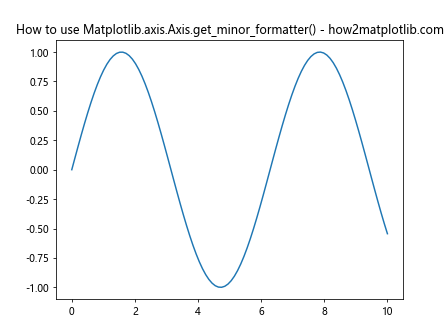
In this example, we create a simple sine wave plot and then use the Matplotlib.axis.Axis.get_minor_formatter() function to retrieve the minor formatter for the x-axis. The function returns the current minor formatter object, which we can then inspect or modify as needed.
Exploring the Return Value of Matplotlib.axis.Axis.get_minor_formatter()
The Matplotlib.axis.Axis.get_minor_formatter() function returns a Formatter object, which is responsible for converting tick values into string labels. The specific type of formatter returned depends on the current configuration of the axis. Let’s examine different types of formatters that can be returned:
import matplotlib.pyplot as plt
import numpy as np
from matplotlib.ticker import ScalarFormatter, FuncFormatter

# Create a sample plot
x = np.linspace(0, 10, 100)
y = np.exp(x)

fig, (ax1, ax2, ax3) = plt.subplots(3, 1, figsize=(8, 12))

# Plot 1: Default formatter
ax1.plot(x, y)
default_formatter = ax1.xaxis.get_minor_formatter()
ax1.set_title(f"Default Formatter: {type(default_formatter).__name__}")

# Plot 2: ScalarFormatter
ax2.plot(x, y)
ax2.xaxis.set_minor_formatter(ScalarFormatter())
scalar_formatter = ax2.xaxis.get_minor_formatter()
ax2.set_title(f"ScalarFormatter: {type(scalar_formatter).__name__}")

# Plot 3: FuncFormatter
def custom_formatter(x, pos):
    return f"[{x:.1f}]"

ax3.plot(x, y)
ax3.xaxis.set_minor_formatter(FuncFormatter(custom_formatter))
func_formatter = ax3.xaxis.get_minor_formatter()
ax3.set_title(f"FuncFormatter: {type(func_formatter).__name__}")

plt.tight_layout()
plt.suptitle("Matplotlib.axis.Axis.get_minor_formatter() Return Types - how2matplotlib.com")
plt.show()
Output:
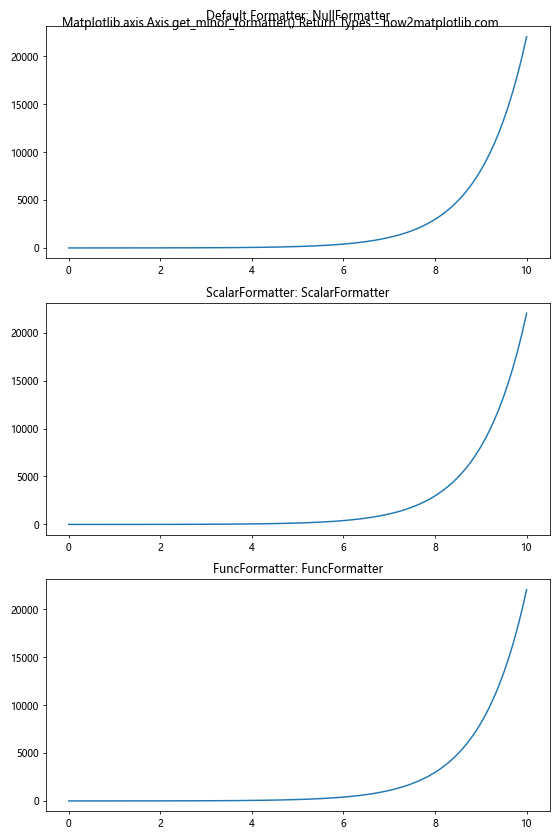
In this example, we create three subplots to demonstrate different types of formatters that can be returned by the Matplotlib.axis.Axis.get_minor_formatter() function. The first plot uses the default formatter, the second plot uses a ScalarFormatter, and the third plot uses a custom FuncFormatter. By calling get_minor_formatter() on each axis, we can inspect the type of formatter being used.
Customizing Minor Tick Formatters with Matplotlib.axis.Axis.get_minor_formatter()
One of the primary use cases for the Matplotlib.axis.Axis.get_minor_formatter() function is to retrieve the current formatter and make modifications to it. This allows you to fine-tune the appearance of minor tick labels without completely replacing the formatter. Let’s explore some examples of how to customize minor tick formatters:
import matplotlib.pyplot as plt
import numpy as np
from matplotlib.ticker import ScalarFormatter

# Create a sample plot
x = np.linspace(0, 1, 100)
y = x ** 2

fig, ax = plt.subplots()
ax.plot(x, y)

# Get the current minor formatter
minor_formatter = ax.xaxis.get_minor_formatter()

# Customize the minor formatter
if isinstance(minor_formatter, ScalarFormatter):
    minor_formatter.set_scientific(True)
    minor_formatter.set_powerlimits((-2, 2))

ax.xaxis.set_minor_locator(plt.MultipleLocator(0.1))
ax.xaxis.set_minor_formatter(minor_formatter)

plt.title("Customized Minor Tick Formatter - how2matplotlib.com")
plt.show()
Output:
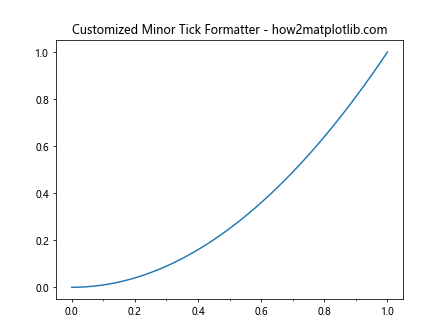
In this example, we retrieve the current minor formatter using Matplotlib.axis.Axis.get_minor_formatter() and check if it’s an instance of ScalarFormatter. If so, we customize it to use scientific notation and set power limits. This demonstrates how you can modify the existing formatter without replacing it entirely.
Advanced Usage of Matplotlib.axis.Axis.get_minor_formatter()
The Matplotlib.axis.Axis.get_minor_formatter() function can be particularly useful in more advanced plotting scenarios. Let’s explore some advanced use cases:
Dynamically Switching Formatters
import matplotlib.pyplot as plt
import numpy as np
from matplotlib.ticker import ScalarFormatter, FuncFormatter

def toggle_formatter(event):
    global use_custom_formatter
    use_custom_formatter = not use_custom_formatter

    if use_custom_formatter:
        ax.xaxis.set_minor_formatter(custom_formatter)
    else:
        ax.xaxis.set_minor_formatter(ScalarFormatter())

    plt.draw()

def custom_format(x, pos):
    return f"[{x:.2f}]"

x = np.linspace(0, 10, 100)
y = np.sin(x)

fig, ax = plt.subplots()
ax.plot(x, y)

use_custom_formatter = False
custom_formatter = FuncFormatter(custom_format)

ax.xaxis.set_minor_locator(plt.MultipleLocator(0.5))
current_formatter = ax.xaxis.get_minor_formatter()
print(f"Initial formatter: {type(current_formatter).__name__}")

plt.connect('button_press_event', toggle_formatter)

plt.title("Click to Toggle Minor Formatter - how2matplotlib.com")
plt.show()
Output:
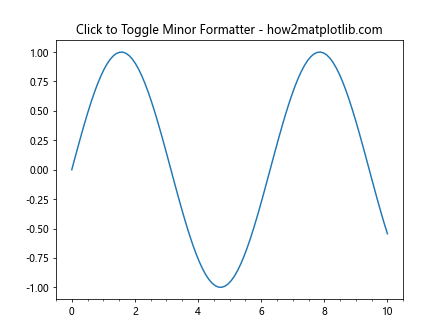
In this advanced example, we create an interactive plot that allows the user to switch between two different minor tick formatters by clicking on the plot. We use the Matplotlib.axis.Axis.get_minor_formatter() function to retrieve and display the initial formatter type.
Copying Formatters Between Axes
import matplotlib.pyplot as plt
import numpy as np

# Create sample data
x = np.linspace(0, 10, 100)
y1 = np.sin(x)
y2 = np.cos(x)

# Create two subplots
fig, (ax1, ax2) = plt.subplots(2, 1, figsize=(8, 10))

# Plot data on both axes
ax1.plot(x, y1)
ax2.plot(x, y2)

# Customize the first axis
ax1.xaxis.set_minor_locator(plt.MultipleLocator(0.5))
ax1.xaxis.set_minor_formatter(plt.FormatStrFormatter('%.2f'))

# Get the minor formatter from the first axis
formatter = ax1.xaxis.get_minor_formatter()

# Apply the same formatter to the second axis
ax2.xaxis.set_minor_locator(plt.MultipleLocator(0.5))
ax2.xaxis.set_minor_formatter(formatter)

plt.suptitle("Copying Formatters Between Axes - how2matplotlib.com")
plt.show()
Output:
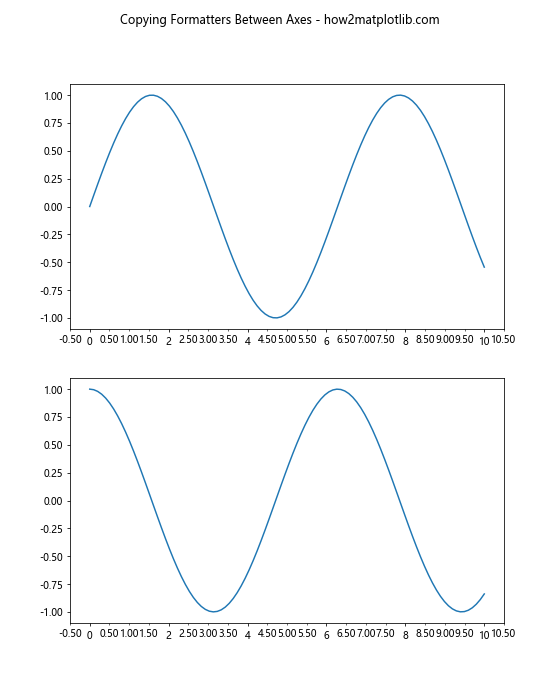
This example demonstrates how to use the Matplotlib.axis.Axis.get_minor_formatter() function to copy a formatter from one axis to another. We customize the minor tick formatter for the first axis, retrieve it using get_minor_formatter(), and then apply it to the second axis.
Common Pitfalls and Best Practices
When working with the Matplotlib.axis.Axis.get_minor_formatter() function, there are some common pitfalls to avoid and best practices to follow:
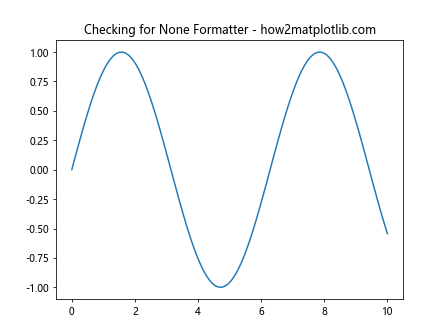
- Checking for None: Sometimes, the get_minor_formatter() function may return None if no formatter has been explicitly set. Always check for this case before attempting to modify the formatter.
import matplotlib.pyplot as plt
import numpy as np

x = np.linspace(0, 10, 100)
y = np.sin(x)

fig, ax = plt.subplots()
ax.plot(x, y)

minor_formatter = ax.xaxis.get_minor_formatter()

if minor_formatter is not None:
    print(f"Minor formatter type: {type(minor_formatter).__name__}")
else:
    print("No minor formatter set")

plt.title("Checking for None Formatter - how2matplotlib.com")
plt.show()
Output:
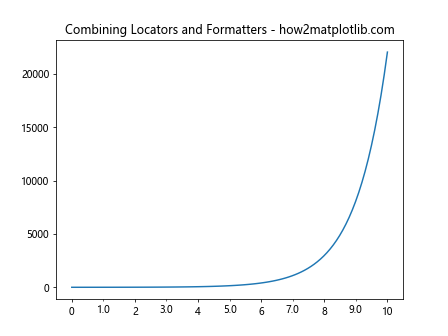
- Combining with Locators: Remember that formatters work in conjunction with locators. Make sure to set appropriate minor tick locators when customizing minor tick formatters.
import matplotlib.pyplot as plt
import numpy as np
from matplotlib.ticker import AutoMinorLocator, FormatStrFormatter

x = np.linspace(0, 10, 100)
y = np.exp(x)

fig, ax = plt.subplots()
ax.plot(x, y)

# Set minor locator and formatter
ax.xaxis.set_minor_locator(AutoMinorLocator(2))
ax.xaxis.set_minor_formatter(FormatStrFormatter('%.1f'))

# Verify the formatter
minor_formatter = ax.xaxis.get_minor_formatter()
print(f"Minor formatter type: {type(minor_formatter).__name__}")

plt.title("Combining Locators and Formatters - how2matplotlib.com")
plt.show()
Output:
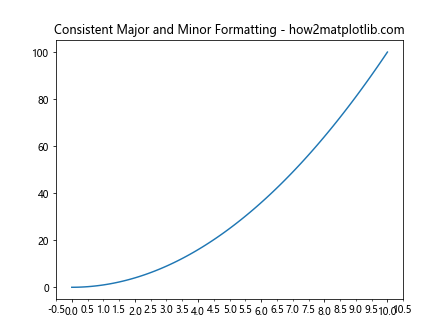
- Consistent Formatting: Ensure that your minor tick formatting is consistent with your major tick formatting for a cohesive look.
import matplotlib.pyplot as plt
import numpy as np
from matplotlib.ticker import MultipleLocator, FormatStrFormatter

x = np.linspace(0, 10, 100)
y = x ** 2

fig, ax = plt.subplots()
ax.plot(x, y)

# Set major and minor locators and formatters
ax.xaxis.set_major_locator(MultipleLocator(2))
ax.xaxis.set_major_formatter(FormatStrFormatter('%.1f'))
ax.xaxis.set_minor_locator(MultipleLocator(0.5))
ax.xaxis.set_minor_formatter(FormatStrFormatter('%.1f'))

# Verify formatters
major_formatter = ax.xaxis.get_major_formatter()
minor_formatter = ax.xaxis.get_minor_formatter()

print(f"Major formatter type: {type(major_formatter).__name__}")
print(f"Minor formatter type: {type(minor_formatter).__name__}")

plt.title("Consistent Major and Minor Formatting - how2matplotlib.com")
plt.show()
Output:
Integrating Matplotlib.axis.Axis.get_minor_formatter() with Other Matplotlib Features
The Matplotlib.axis.Axis.get_minor_formatter() function can be effectively integrated with other Matplotlib features to create more complex and informative visualizations. Let’s explore some examples:
Combining with Colorbar Formatting
import matplotlib.pyplot as plt
import numpy as np
from matplotlib.ticker import ScalarFormatter

# Create sample data
x = np.linspace(0, 10, 100)
y = np.linspace(0, 10, 100)
X, Y = np.meshgrid(x, y)
Z = np.sin(X) * np.cos(Y)

fig, ax = plt.subplots(figsize=(10, 8))
im = ax.imshow(Z, extent=[0, 10, 0, 10], origin='lower', cmap='viridis')

# Create colorbar
cbar = plt.colorbar(im)

# Get and customize the colorbar's minor formatter
cbar_minor_formatter = cbar.ax.yaxis.get_minor_formatter()
if isinstance(cbar_minor_formatter, ScalarFormatter):
    cbar_minor_formatter.set_scientific(True)
    cbar_minor_formatter.set_powerlimits((-2, 2))

cbar.ax.yaxis.set_minor_locator(plt.MultipleLocator(0.1))
cbar.ax.yaxis.set_minor_formatter(cbar_minor_formatter)

plt.title("Colorbar with Customized Minor Formatter - how2matplotlib.com")
plt.show()
Output:
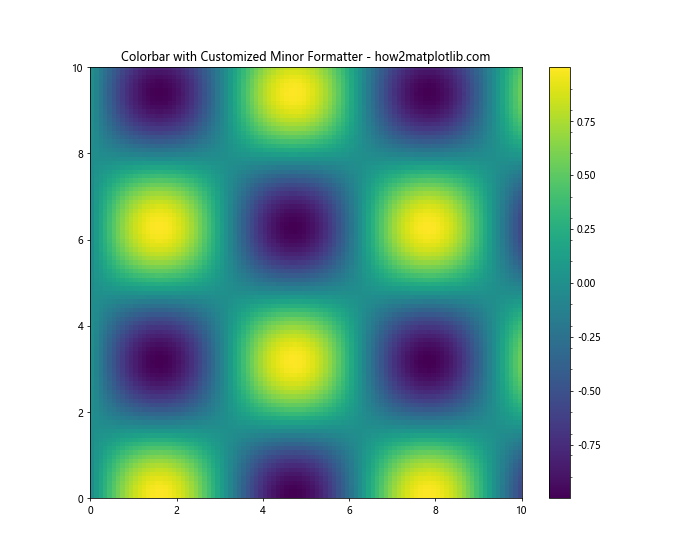
In this example, we create a heatmap with a colorbar and use the Matplotlib.axis.Axis.get_minor_formatter() function to customize the minor tick formatting of the colorbar.
Advanced Customization Techniques Using Matplotlib.axis.Axis.get_minor_formatter()
Let’s explore some advanced customization techniques that leverage the Matplotlib.axis.Axis.get_minor_formatter() function:
Creating a Custom Formatter Class
import matplotlib.pyplot as plt
import numpy as np
from matplotlib.ticker import Formatter

class CustomMinorFormatter(Formatter):
    def __init__(self, prefix=''):
        self.prefix = prefix

    def __call__(self, x, pos=None):
        return f"{self.prefix}{x:.2f}"

x = np.linspace(0, 10, 100)
y = np.sin(x)

fig, ax = plt.subplots()
ax.plot(x, y)

# Set custom minor formatter
custom_formatter = CustomMinorFormatter(prefix='#')
ax.xaxis.set_minor_locator(plt.MultipleLocator(0.5))
ax.xaxis.set_minor_formatter(custom_formatter)

# Verify the formatter
minor_formatter = ax.xaxis.get_minor_formatter()
print(f"Minor formatter type: {type(minor_formatter).__name__}")

plt.title("Custom Minor Formatter Class - how2matplotlib.com")
plt.show()
Output:
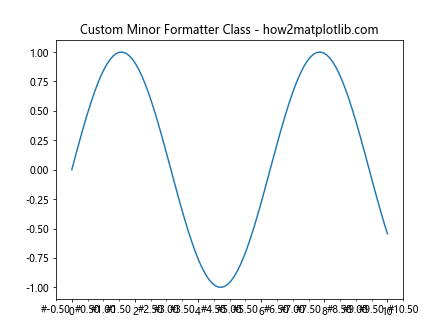
In this example, we create a custom formatter class that adds a prefix to the minor tick labels. We then use Matplotlib.axis.Axis.get_minor_formatter() to verify that our custom formatter is being used.
Troubleshooting Common Issues with Matplotlib.axis.Axis.get_minor_formatter()
When working with the Matplotlib.axis.Axis.get_minor_formatter() function, you may encounter some common issues. Let’s address these problems and provide solutions:
Issue 1: Formatter Not Applying to Minor Ticks
import matplotlib.pyplot as plt
import numpy as np
from matplotlib.ticker import FormatStrFormatter

x = np.linspace(0, 10, 100)
y = np.sin(x)

fig, ax = plt.subplots()
ax.plot(x, y)

# Attempt to set minor formatter
ax.xaxis.set_minor_formatter(FormatStrFormatter('%.3f'))

# Check if the formatter is set
minor_formatter = ax.xaxis.get_minor_formatter()
print(f"Minor formatter type: {type(minor_formatter).__name__}")

plt.title("Troubleshooting: Formatter Not Applying - how2matplotlib.com")
plt.show()
Output:
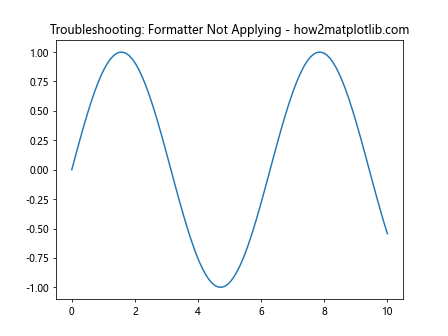
In this example, you might notice that the minor formatter doesn’t seem to be applied. The issue is that we haven’t set a minor locator, so no minor ticks are being displayed. To fix this, add the following line before setting the formatter:
ax.xaxis.set_minor_locator(plt.AutoMinorLocator())
Issue 2: Inconsistent Formatting Between Major and Minor Ticks
import matplotlib.pyplot as plt
import numpy as np
from matplotlib.ticker import FormatStrFormatter, ScalarFormatter

x = np.linspace(0, 10, 100)
y = x ** 2

fig, ax = plt.subplots()
ax.plot(x, y)

ax.xaxis.set_major_formatter(ScalarFormatter())
ax.xaxis.set_minor_formatter(FormatStrFormatter('%.2f'))
ax.xaxis.set_minor_locator(plt.MultipleLocator(0.5))

major_formatter = ax.xaxis.get_major_formatter()
minor_formatter = ax.xaxis.get_minor_formatter()

print(f"Major formatter type: {type(major_formatter).__name__}")
print(f"Minor formatter type: {type(minor_formatter).__name__}")

plt.title("Troubleshooting: Inconsistent Formatting - how2matplotlib.com")
plt.show()
Output:
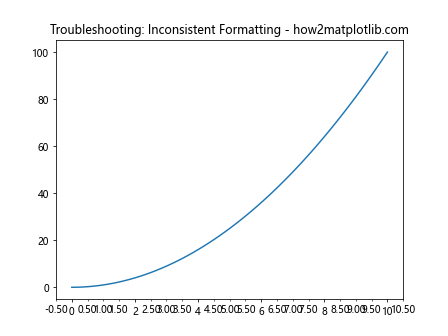
In this case, the major and minor tick formatters are different, which can lead to inconsistent formatting. To ensure consistency, use the same formatter type for both major and minor ticks:
formatter = ScalarFormatter()
ax.xaxis.set_major_formatter(formatter)
ax.xaxis.set_minor_formatter(formatter)
Best Practices for Using Matplotlib.axis.Axis.get_minor_formatter()
To make the most of the Matplotlib.axis.Axis.get_minor_formatter() function, consider the following best practices:
- Always check the returned formatter type before making modifications:
import matplotlib.pyplot as plt
import numpy as np
from matplotlib.ticker import ScalarFormatter

x = np.linspace(0, 10, 100)
y = np.sin(x)

fig, ax = plt.subplots()
ax.plot(x, y)

minor_formatter = ax.xaxis.get_minor_formatter()

if isinstance(minor_formatter, ScalarFormatter):
    minor_formatter.set_scientific(True)
    minor_formatter.set_powerlimits((-2, 2))
elif minor_formatter is None:
    print("No minor formatter set. Setting a default ScalarFormatter.")
    ax.xaxis.set_minor_formatter(ScalarFormatter())

plt.title("Best Practice: Check Formatter Type - how2matplotlib.com")
plt.show()
Output:
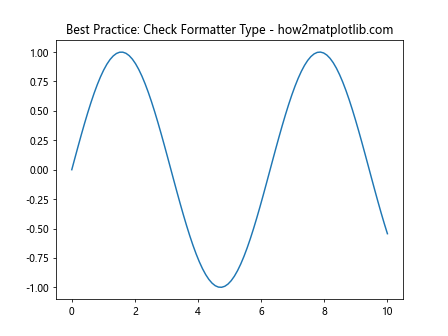
- Combine get_minor_formatter() with set_minor_formatter() for effective customization:
import matplotlib.pyplot as plt
import numpy as np
from matplotlib.ticker import ScalarFormatter

x = np.linspace(0, 1e5, 100)
y = x ** 2

fig, ax = plt.subplots()
ax.plot(x, y)

# Get the current minor formatter
minor_formatter = ax.xaxis.get_minor_formatter()

# Customize the formatter
if isinstance(minor_formatter, ScalarFormatter):
    minor_formatter.set_scientific(True)
    minor_formatter.set_powerlimits((-3, 3))
else:
    minor_formatter = ScalarFormatter(useMathText=True)
    minor_formatter.set_scientific(True)
    minor_formatter.set_powerlimits((-3, 3))

# Set the customized formatter
ax.xaxis.set_minor_formatter(minor_formatter)

plt.title("Best Practice: Customize and Set Formatter - how2matplotlib.com")
plt.show()
Output:
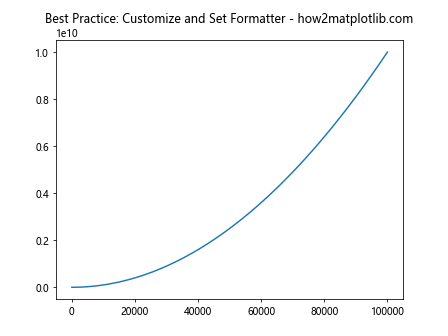
- Use get_minor_formatter() in conjunction with other axis customization methods:
import matplotlib.pyplot as plt
import numpy as np
from matplotlib.ticker import AutoMinorLocator, FormatStrFormatter

x = np.linspace(0, 10, 100)
y = np.exp(x)

fig, ax = plt.subplots()
ax.plot(x, y)

# Customize x-axis
ax.xaxis.set_major_locator(plt.MultipleLocator(2))
ax.xaxis.set_minor_locator(AutoMinorLocator(2))

major_formatter = FormatStrFormatter('%d')
minor_formatter = FormatStrFormatter('%.1f')

ax.xaxis.set_major_formatter(major_formatter)
ax.xaxis.set_minor_formatter(minor_formatter)

# Verify formatters
print(f"Major formatter: {type(ax.xaxis.get_major_formatter()).__name__}")
print(f"Minor formatter: {type(ax.xaxis.get_minor_formatter()).__name__}")

plt.title("Best Practice: Comprehensive Axis Customization - how2matplotlib.com")
plt.show()
Output:
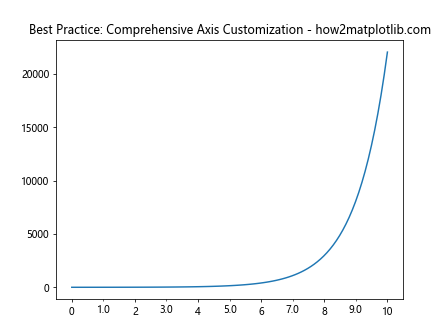
Conclusion
The Matplotlib.axis.Axis.get_minor_formatter() function is a powerful tool for customizing and retrieving minor tick formatters in Matplotlib plots. Throughout this comprehensive guide, we’ve explored various aspects of this function, including its usage, return values, and practical applications in different plotting scenarios.
We’ve covered topics such as understanding different formatter types, customizing minor tick formatters, integrating with other Matplotlib features, and troubleshooting common issues. By following the best practices and examples provided, you can effectively use the Matplotlib.axis.Axis.get_minor_formatter() function to enhance the readability and visual appeal of your plots.