Comprehensive Guide to Matplotlib.axis.Axis.get_minor_locator() Function in Python
Matplotlib.axis.Axis.get_minor_locator() function in Python is an essential tool for customizing and retrieving information about the minor tick locators in Matplotlib plots. This function is part of the Matplotlib library, which is widely used for creating static, animated, and interactive visualizations in Python. In this comprehensive guide, we’ll explore the Matplotlib.axis.Axis.get_minor_locator() function in detail, covering its usage, parameters, return values, and practical applications in various plotting scenarios.
Understanding the Matplotlib.axis.Axis.get_minor_locator() Function
The Matplotlib.axis.Axis.get_minor_locator() function is a method of the Axis class in Matplotlib. Its primary purpose is to retrieve the minor tick locator object associated with a specific axis. This function is crucial for accessing and manipulating the minor tick locations on a plot’s axis.
Let’s start with a simple example to demonstrate the basic usage of the Matplotlib.axis.Axis.get_minor_locator() function:
import matplotlib.pyplot as plt
import numpy as np

# Create a simple plot
fig, ax = plt.subplots()
x = np.linspace(0, 10, 100)
y = np.sin(x)
ax.plot(x, y, label='Sine wave')

# Get the minor locator for the x-axis
minor_locator = ax.xaxis.get_minor_locator()

# Print information about the minor locator
print(f"Minor locator: {minor_locator}")

plt.title('How to use get_minor_locator() - how2matplotlib.com')
plt.legend()
plt.show()
Output:
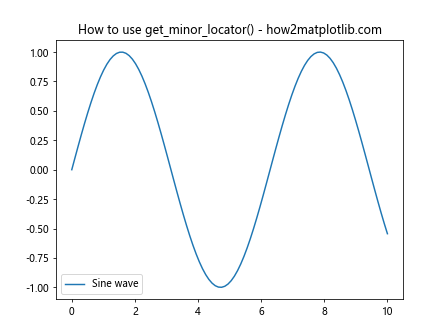
In this example, we create a simple sine wave plot and use the Matplotlib.axis.Axis.get_minor_locator() function to retrieve the minor locator for the x-axis. The function returns the current minor locator object, which we can then use to inspect or modify the minor tick locations.
Importance of Matplotlib.axis.Axis.get_minor_locator() in Data Visualization
The Matplotlib.axis.Axis.get_minor_locator() function plays a crucial role in data visualization by allowing developers to access and customize the minor tick locations on plot axes. Minor ticks are smaller tick marks that appear between the major ticks, providing additional reference points for more precise readings of data values.
Here are some key reasons why the Matplotlib.axis.Axis.get_minor_locator() function is important:
- Enhancing readability: Minor ticks improve the readability of plots by providing finer granularity between major tick marks.
- Customization: Accessing the minor locator allows for customization of tick placement and appearance.
- Precision: Minor ticks enable more precise interpretation of data points on the plot.
- Consistency: Retrieving the minor locator helps maintain consistency across multiple plots or subplots.
Let’s explore an example that demonstrates the importance of minor ticks in improving plot readability:
import matplotlib.pyplot as plt
import numpy as np
from matplotlib.ticker import AutoMinorLocator

# Create data
x = np.linspace(0, 5, 100)
y = x ** 2

# Create the plot
fig, (ax1, ax2) = plt.subplots(1, 2, figsize=(12, 5))

# Plot without minor ticks
ax1.plot(x, y)
ax1.set_title('Without Minor Ticks - how2matplotlib.com')

# Plot with minor ticks
ax2.plot(x, y)
ax2.xaxis.set_minor_locator(AutoMinorLocator())
ax2.yaxis.set_minor_locator(AutoMinorLocator())
ax2.set_title('With Minor Ticks - how2matplotlib.com')

# Get and print information about the minor locators
x_minor_locator = ax2.xaxis.get_minor_locator()
y_minor_locator = ax2.yaxis.get_minor_locator()
print(f"X-axis minor locator: {x_minor_locator}")
print(f"Y-axis minor locator: {y_minor_locator}")

plt.tight_layout()
plt.show()
Output:
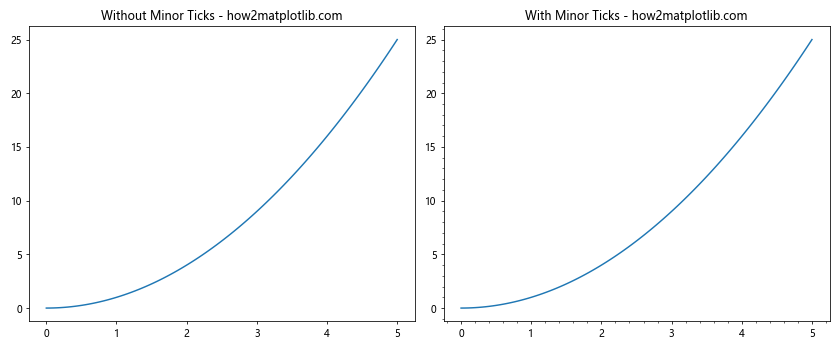
In this example, we create two plots side by side: one without minor ticks and one with minor ticks. We use the AutoMinorLocator to automatically add minor ticks to both axes of the second plot. The Matplotlib.axis.Axis.get_minor_locator() function is then used to retrieve and print information about the minor locators for both axes.
Syntax and Parameters of Matplotlib.axis.Axis.get_minor_locator()
The Matplotlib.axis.Axis.get_minor_locator() function has a simple syntax:
axis.get_minor_locator()
Where axis is an instance of the Matplotlib Axis class, typically accessed through ax.xaxis or ax.yaxis for the x-axis and y-axis, respectively.
This function does not take any parameters, making it straightforward to use. It simply returns the current minor locator object associated with the specified axis.
Let’s look at an example that demonstrates how to use the Matplotlib.axis.Axis.get_minor_locator() function for both x and y axes:
import matplotlib.pyplot as plt
import numpy as np
from matplotlib.ticker import MultipleLocator

# Create data
x = np.linspace(0, 10, 100)
y = np.sin(x)

# Create the plot
fig, ax = plt.subplots()
ax.plot(x, y)

# Set custom minor locators
ax.xaxis.set_minor_locator(MultipleLocator(0.5))
ax.yaxis.set_minor_locator(MultipleLocator(0.1))

# Get and print information about the minor locators
x_minor_locator = ax.xaxis.get_minor_locator()
y_minor_locator = ax.yaxis.get_minor_locator()
print(f"X-axis minor locator: {x_minor_locator}")
print(f"Y-axis minor locator: {y_minor_locator}")

plt.title('Custom Minor Locators - how2matplotlib.com')
plt.show()
Output:
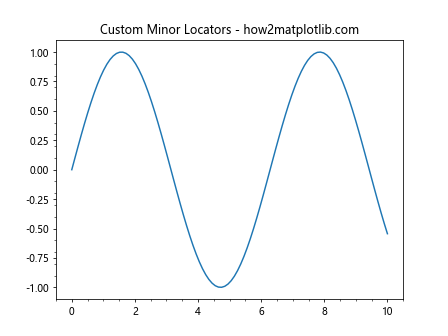
In this example, we set custom minor locators using the MultipleLocator class and then use the Matplotlib.axis.Axis.get_minor_locator() function to retrieve and print information about these locators.
Return Value of Matplotlib.axis.Axis.get_minor_locator()
The Matplotlib.axis.Axis.get_minor_locator() function returns the current minor locator object associated with the specified axis. The return value is an instance of a Matplotlib tick locator class, such as:
- NullLocator: No ticks
- FixedLocator: Tick locations are fixed
- IndexLocator: Locator for index plots (e.g., where x = range(len(y)))
- LinearLocator: Determine the tick locations
- LogLocator: Determine the tick locations for log axes
- MultipleLocator: Set a tick on every integer that is multiple of some base
- AutoMinorLocator: Locator for minor ticks when the axis is linear and the major ticks are uniformly spaced
Let’s create an example that demonstrates different types of minor locators and how to retrieve them using the Matplotlib.axis.Axis.get_minor_locator() function:
import matplotlib.pyplot as plt
import numpy as np
from matplotlib.ticker import NullLocator, FixedLocator, MultipleLocator, AutoMinorLocator

# Create data
x = np.linspace(0, 10, 100)
y = np.sin(x)

# Create subplots
fig, ((ax1, ax2), (ax3, ax4)) = plt.subplots(2, 2, figsize=(12, 10))
axes = [ax1, ax2, ax3, ax4]

# Set different minor locators for each subplot
ax1.xaxis.set_minor_locator(NullLocator())
ax2.xaxis.set_minor_locator(FixedLocator([1.5, 3.5, 5.5, 7.5, 9.5]))
ax3.xaxis.set_minor_locator(MultipleLocator(0.5))
ax4.xaxis.set_minor_locator(AutoMinorLocator())

# Plot data and set titles
for ax in axes:
    ax.plot(x, y)
    minor_locator = ax.xaxis.get_minor_locator()
    ax.set_title(f"{type(minor_locator).__name__} - how2matplotlib.com")
    print(f"Minor locator for {ax.get_title()}: {minor_locator}")

plt.tight_layout()
plt.show()
Output:
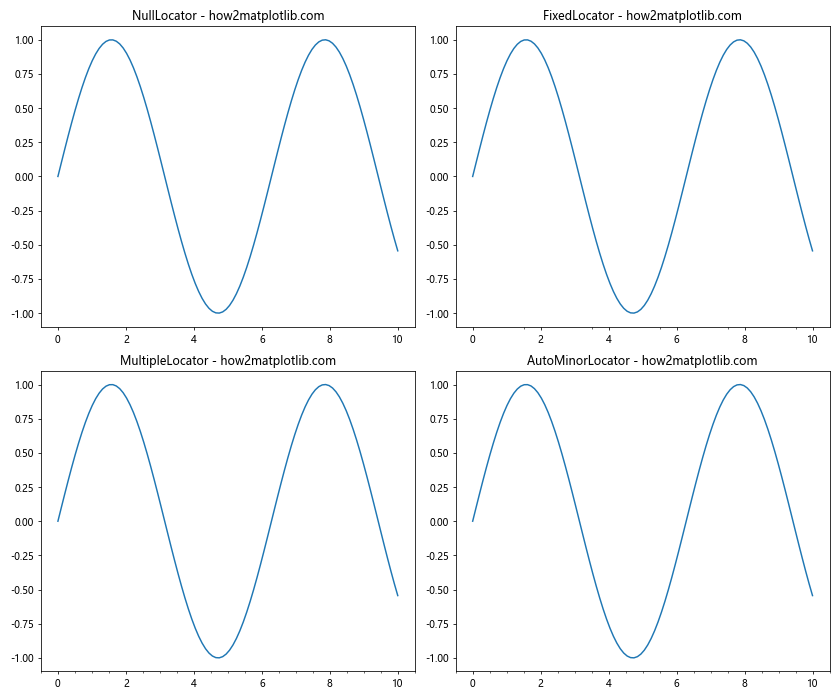
In this example, we create four subplots, each with a different type of minor locator. We then use the Matplotlib.axis.Axis.get_minor_locator() function to retrieve and print information about each minor locator.
Practical Applications of Matplotlib.axis.Axis.get_minor_locator()
The Matplotlib.axis.Axis.get_minor_locator() function has several practical applications in data visualization and plot customization. Let’s explore some common use cases:
1. Customizing Minor Tick Locations
One of the primary uses of the Matplotlib.axis.Axis.get_minor_locator() function is to inspect and modify the current minor tick locations. This is particularly useful when you want to fine-tune the appearance of your plots.
Here’s an example that demonstrates how to customize minor tick locations using the information obtained from the Matplotlib.axis.Axis.get_minor_locator() function:
import matplotlib.pyplot as plt
import numpy as np
from matplotlib.ticker import MultipleLocator

# Create data
x = np.linspace(0, 10, 100)
y = np.sin(x)

# Create the plot
fig, ax = plt.subplots()
ax.plot(x, y)

# Set initial minor locator
ax.xaxis.set_minor_locator(MultipleLocator(0.5))

# Get the current minor locator
current_locator = ax.xaxis.get_minor_locator()
print(f"Current minor locator: {current_locator}")

# Modify the minor locator based on the current one
if isinstance(current_locator, MultipleLocator):
    new_interval = current_locator.axis.get_tick_space() / 5
    ax.xaxis.set_minor_locator(MultipleLocator(new_interval))

# Get the updated minor locator
updated_locator = ax.xaxis.get_minor_locator()
print(f"Updated minor locator: {updated_locator}")

plt.title('Customized Minor Tick Locations - how2matplotlib.com')
plt.show()
Output:
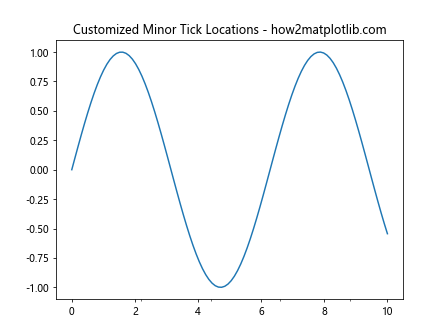
In this example, we first set an initial minor locator and then use the Matplotlib.axis.Axis.get_minor_locator() function to retrieve it. Based on the type of the current locator, we modify the minor tick interval and set a new minor locator. Finally, we use the Matplotlib.axis.Axis.get_minor_locator() function again to confirm the update.
2. Synchronizing Minor Ticks Across Multiple Subplots
When creating multiple subplots, it’s often desirable to have consistent minor tick locations across all plots. The Matplotlib.axis.Axis.get_minor_locator() function can be used to achieve this synchronization.
Here’s an example that demonstrates how to synchronize minor ticks across multiple subplots:
import matplotlib.pyplot as plt
import numpy as np
from matplotlib.ticker import AutoMinorLocator

# Create data
x = np.linspace(0, 10, 100)
y1 = np.sin(x)
y2 = np.cos(x)
y3 = np.tan(x)

# Create subplots
fig, (ax1, ax2, ax3) = plt.subplots(3, 1, figsize=(10, 12), sharex=True)

# Plot data
ax1.plot(x, y1)
ax2.plot(x, y2)
ax3.plot(x, y3)

# Set minor locator for the first subplot
ax1.xaxis.set_minor_locator(AutoMinorLocator())

# Get the minor locator from the first subplot
reference_locator = ax1.xaxis.get_minor_locator()

# Apply the same minor locator to other subplots
ax2.xaxis.set_minor_locator(reference_locator)
ax3.xaxis.set_minor_locator(reference_locator)

# Verify that all subplots have the same minor locator
for i, ax in enumerate([ax1, ax2, ax3], 1):
    locator = ax.xaxis.get_minor_locator()
    print(f"Subplot {i} minor locator: {locator}")
    ax.set_title(f'Subplot {i} - how2matplotlib.com')

plt.tight_layout()
plt.show()
Output:
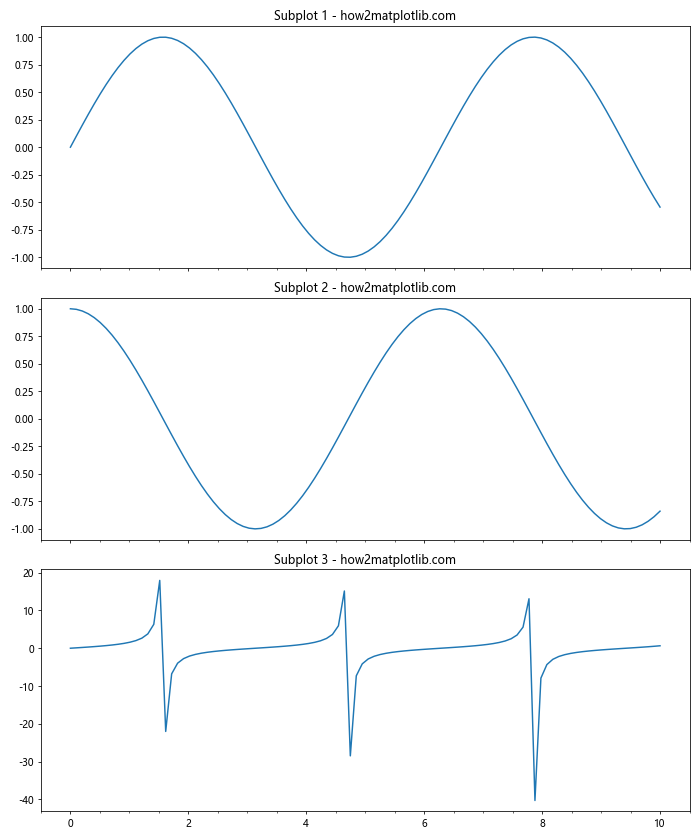
In this example, we create three subplots with different trigonometric functions. We set a minor locator for the first subplot and then use the Matplotlib.axis.Axis.get_minor_locator() function to retrieve it. We then apply the same minor locator to the other subplots, ensuring consistency across all plots.
3. Adapting Minor Ticks to Data Range
The Matplotlib.axis.Axis.get_minor_locator() function can be used in conjunction with other Matplotlib functions to adapt minor tick locations based on the data range of the plot.
Here’s an example that demonstrates how to adapt minor ticks to the data range:
import matplotlib.pyplot as plt
import numpy as np
from matplotlib.ticker import AutoMinorLocator

def adapt_minor_ticks(ax, num_minor=4):
    # Get the current minor locator
    current_locator = ax.xaxis.get_minor_locator()

    # If it's not an AutoMinorLocator, set one
    if not isinstance(current_locator, AutoMinorLocator):
        ax.xaxis.set_minor_locator(AutoMinorLocator(num_minor))

    # Get the data range
    x_min, x_max = ax.get_xlim()
    data_range = x_max - x_min

    # Calculate an appropriate interval for minor ticks
    minor_interval = data_range / (num_minor * 10)

    # Set the new minor locator
    ax.xaxis.set_minor_locator(AutoMinorLocator(num_minor))

    return ax.xaxis.get_minor_locator()

# Create data with different ranges
x1 = np.linspace(0, 1, 100)
y1 = np.sin(2 * np.pi * x1)

x2 = np.linspace(0, 100, 100)
y2 = np.cos(0.1 * x2)

# Create subplots
fig, (ax1, ax2) = plt.subplots(2, 1, figsize=(10, 8))

# Plot data
ax1.plot(x1, y1)
ax2.plot(x2, y2)

# Adapt minor ticks for each subplot
adapted_locator1 = adapt_minor_ticks(ax1)
adapted_locator2 = adapt_minor_ticks(ax2)

print(f"Adapted locator for subplot 1: {adapted_locator1}")
print(f"Adapted locator for subplot 2: {adapted_locator2}")

ax1.set_title('Adapted Minor Ticks (Small Range) - how2matplotlib.com')
ax2.set_title('Adapted Minor Ticks (Large Range) - how2matplotlib.com')

plt.tight_layout()
plt.show()
Output:
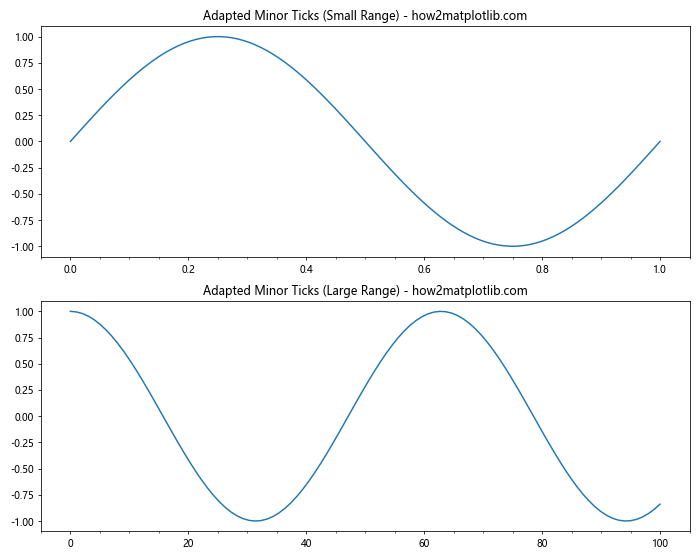
In this example, we define a function adapt_minor_ticks() that uses the Matplotlib.axis.Axis.get_minor_locator() function to check the current minor locator and adapt it based on the data range of the plot. We then apply this function to two subplots with different data ranges, resultingin minor tick locations that are appropriate for each plot’s scale.
4. Combining Major and Minor Locators
The Matplotlib.axis.Axis.get_minor_locator() function can be used in conjunction with the get_major_locator() function to create more complex tick arrangements. This is particularly useful when you want to have different intervals for major and minor ticks.
Here’s an example that demonstrates how to combine major and minor locators:
import matplotlib.pyplot as plt
import numpy as np
from matplotlib.ticker import MultipleLocator

# Create data
x = np.linspace(0, 10, 100)
y = np.sin(x)

# Create the plot
fig, ax = plt.subplots(figsize=(10, 6))
ax.plot(x, y)

# Set major and minor locators
ax.xaxis.set_major_locator(MultipleLocator(2))
ax.xaxis.set_minor_locator(MultipleLocator(0.5))

# Get and print information about the locators
major_locator = ax.xaxis.get_major_locator()
minor_locator = ax.xaxis.get_minor_locator()
print(f"Major locator: {major_locator}")
print(f"Minor locator: {minor_locator}")

# Customize tick appearance
ax.tick_params(which='major', length=10, width=2, color='red')
ax.tick_params(which='minor', length=5, width=1, color='blue')

plt.title('Combined Major and Minor Locators - how2matplotlib.com')
plt.show()
Output:
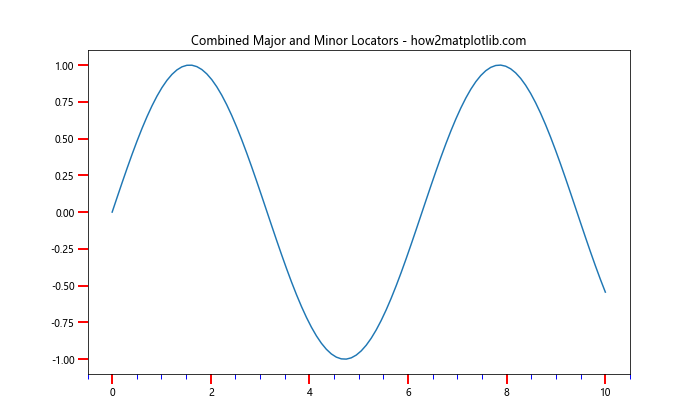
In this example, we set different locators for major and minor ticks using MultipleLocator. We then use the Matplotlib.axis.Axis.get_minor_locator() function along with get_major_locator() to retrieve and print information about both locators. Finally, we customize the appearance of major and minor ticks to make them visually distinct.
Advanced Usage of Matplotlib.axis.Axis.get_minor_locator()
While the basic usage of Matplotlib.axis.Axis.get_minor_locator() is straightforward, there are some advanced techniques that can enhance your plotting capabilities. Let’s explore some of these advanced uses:
1. Dynamic Tick Adjustment
You can use the Matplotlib.axis.Axis.get_minor_locator() function in combination with event handlers to dynamically adjust tick locations based on user interactions, such as zooming or panning.
Here’s an example that demonstrates dynamic tick adjustment:
import matplotlib.pyplot as plt
import numpy as np
from matplotlib.ticker import AutoMinorLocator

def update_minor_ticks(event):
    if event.inaxes:
        ax = event.inaxes
        x_range = np.diff(ax.get_xlim())[0]

        # Adjust the number of minor ticks based on the visible range
        if x_range < 5:
            n_minor = 5
        elif x_range < 10:
            n_minor = 4
        else:
            n_minor = 2

        current_locator = ax.xaxis.get_minor_locator()
        if not isinstance(current_locator, AutoMinorLocator) or current_locator.n != n_minor:
            ax.xaxis.set_minor_locator(AutoMinorLocator(n_minor))

        plt.draw()

# Create data
x = np.linspace(0, 20, 200)
y = np.sin(x)

# Create the plot
fig, ax = plt.subplots(figsize=(10, 6))
ax.plot(x, y)

# Set initial minor locator
ax.xaxis.set_minor_locator(AutoMinorLocator())

# Connect the event handler
fig.canvas.mpl_connect('motion_notify_event', update_minor_ticks)

plt.title('Dynamic Minor Tick Adjustment - how2matplotlib.com')
plt.show()
Output:
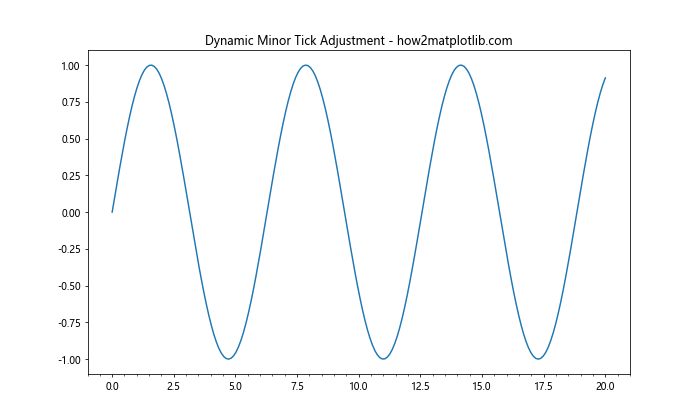
In this example, we define an event handler update_minor_ticks() that adjusts the number of minor ticks based on the visible range of the x-axis. The Matplotlib.axis.Axis.get_minor_locator() function is used to check the current minor locator and update it if necessary.
2. Custom Tick Locator
You can create a custom tick locator class and use the Matplotlib.axis.Axis.get_minor_locator() function to verify its implementation. This is useful when you need a specific tick placement that isn't covered by the built-in locators.
Here's an example of a custom tick locator:
import matplotlib.pyplot as plt
import numpy as np
from matplotlib.ticker import Locator

class CustomMinorLocator(Locator):
    def __init__(self, num_ticks=5):
        self.num_ticks = num_ticks

    def __call__(self):
        vmin, vmax = self.axis.get_view_interval()
        return np.linspace(vmin, vmax, self.num_ticks * 2 + 1)[1::2]

# Create data
x = np.linspace(0, 10, 100)
y = np.sin(x)

# Create the plot
fig, ax = plt.subplots(figsize=(10, 6))
ax.plot(x, y)

# Set custom minor locator
custom_locator = CustomMinorLocator(num_ticks=4)
ax.xaxis.set_minor_locator(custom_locator)

# Get and print information about the minor locator
minor_locator = ax.xaxis.get_minor_locator()
print(f"Custom minor locator: {minor_locator}")

plt.title('Custom Minor Tick Locator - how2matplotlib.com')
plt.show()
Output:
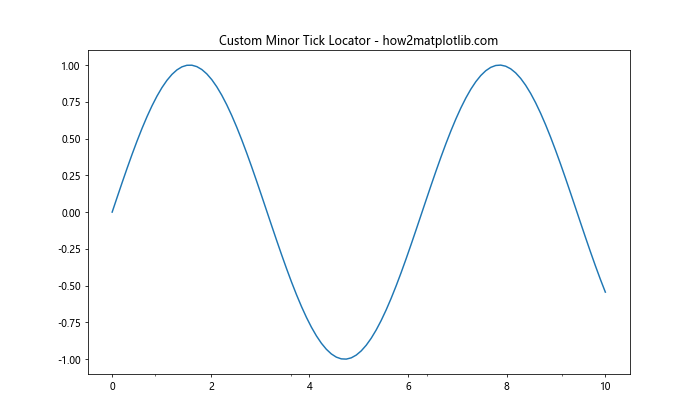
In this example, we define a CustomMinorLocator class that creates evenly spaced minor ticks between major ticks. We then use this custom locator and verify its implementation using the Matplotlib.axis.Axis.get_minor_locator() function.
3. Logarithmic Scale with Minor Ticks
The Matplotlib.axis.Axis.get_minor_locator() function can be particularly useful when working with logarithmic scales, where minor ticks can greatly enhance readability.
Here's an example that demonstrates the use of minor ticks on a logarithmic scale:
import matplotlib.pyplot as plt
import numpy as np
from matplotlib.ticker import LogLocator, NullFormatter

# Create data
x = np.logspace(0, 3, 100)
y = x**2

# Create the plot
fig, ax = plt.subplots(figsize=(10, 6))
ax.loglog(x, y)

# Set major and minor locators for logarithmic scale
ax.xaxis.set_major_locator(LogLocator(base=10, numticks=5))
ax.xaxis.set_minor_locator(LogLocator(base=10, subs=np.arange(2, 10) * 0.1, numticks=10))

# Remove minor tick labels
ax.xaxis.set_minor_formatter(NullFormatter())

# Get and print information about the locators
major_locator = ax.xaxis.get_major_locator()
minor_locator = ax.xaxis.get_minor_locator()
print(f"Major locator: {major_locator}")
print(f"Minor locator: {minor_locator}")

plt.title('Logarithmic Scale with Minor Ticks - how2matplotlib.com')
plt.grid(True, which="both", ls="-", alpha=0.2)
plt.show()
Output:
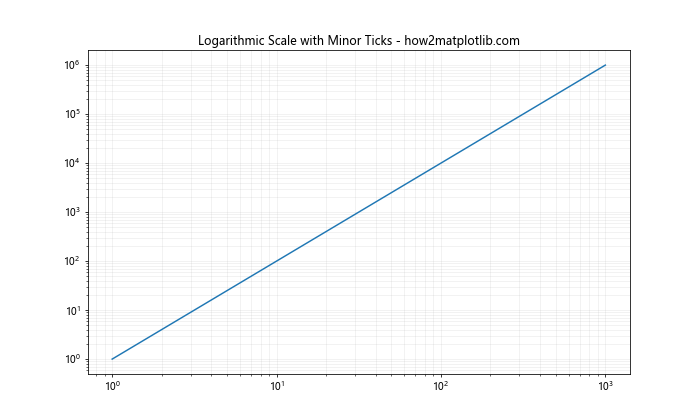
In this example, we create a logarithmic plot and set both major and minor locators using LogLocator. The Matplotlib.axis.Axis.get_minor_locator() function is used to retrieve and print information about the minor locator, which helps in verifying the correct implementation of the logarithmic scale.
Best Practices and Tips for Using Matplotlib.axis.Axis.get_minor_locator()
When working with the Matplotlib.axis.Axis.get_minor_locator() function, consider the following best practices and tips:
- Always check the type of the returned locator object to ensure it matches your expectations.
- Use the Matplotlib.axis.Axis.get_minor_locator() function in combination with set_minor_locator() for a complete understanding of your plot's tick configuration.
- When customizing minor ticks, consider the overall readability of your plot and avoid cluttering the axis with too many ticks.
- For time series data, consider using specialized time locators in conjunction with Matplotlib.axis.Axis.get_minor_locator() for precise control over date and time tick placement.
- When working with multiple subplots, use Matplotlib.axis.Axis.get_minor_locator() to ensure consistency across all plots.
Here's an example that demonstrates some of these best practices:
import matplotlib.pyplot as plt
import numpy as np
from matplotlib.ticker import AutoMinorLocator, MultipleLocator

def optimize_ticks(ax, axis='both'):
    if axis in ['x', 'both']:
        # Get current minor locator
        x_minor_locator = ax.xaxis.get_minor_locator()

        # If no minor locator is set, use AutoMinorLocator
        if isinstance(x_minor_locator, plt.NullLocator):
            ax.xaxis.set_minor_locator(AutoMinorLocator())

        # Adjust major locator based on data range
        x_range = np.diff(ax.get_xlim())[0]
        ax.xaxis.set_major_locator(MultipleLocator(x_range / 5))

    if axis in ['y', 'both']:
        # Get current minor locator
        y_minor_locator = ax.yaxis.get_minor_locator()

        # If no minor locator is set, use AutoMinorLocator
        if isinstance(y_minor_locator, plt.NullLocator):
            ax.yaxis.set_minor_locator(AutoMinorLocator())

        # Adjust major locator based on data range
        y_range = np.diff(ax.get_ylim())[0]
        ax.yaxis.set_major_locator(MultipleLocator(y_range / 5))

# Create data
x = np.linspace(0, 10, 100)
y1 = np.sin(x)
y2 = np.cos(x)

# Create subplots
fig, (ax1, ax2) = plt.subplots(2, 1, figsize=(10, 10))

# Plot data
ax1.plot(x, y1)
ax2.plot(x, y2)

# Optimize ticks for both subplots
optimize_ticks(ax1)
optimize_ticks(ax2)

# Print information about locators
for i, ax in enumerate([ax1, ax2], 1):
    x_major = ax.xaxis.get_major_locator()
    x_minor = ax.xaxis.get_minor_locator()
    y_major = ax.yaxis.get_major_locator()
    y_minor = ax.yaxis.get_minor_locator()

    print(f"Subplot {i}:")
    print(f"  X-axis - Major: {x_major}, Minor: {x_minor}")
    print(f"  Y-axis - Major: {y_major}, Minor: {y_minor}")

ax1.set_title('Optimized Ticks (Sine) - how2matplotlib.com')
ax2.set_title('Optimized Ticks (Cosine) - how2matplotlib.com')

plt.tight_layout()
plt.show()
Output:
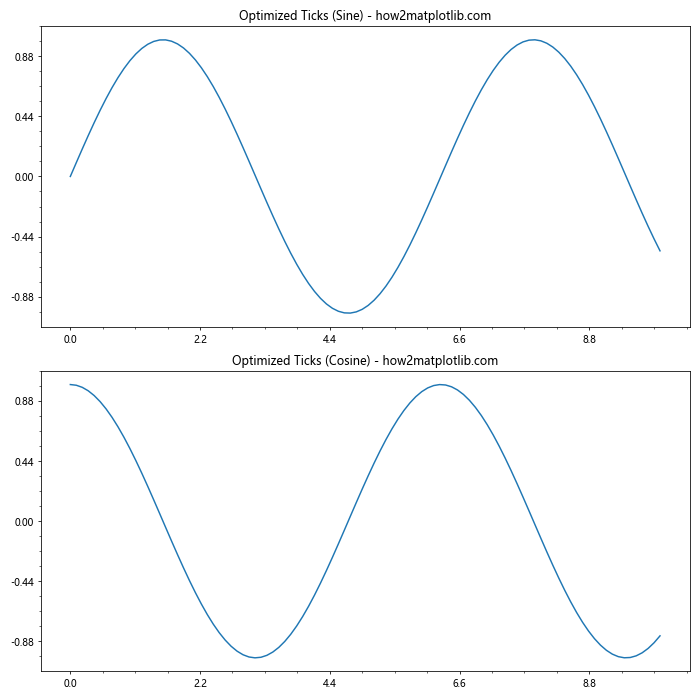
In this example, we define an optimize_ticks() function that uses the Matplotlib.axis.Axis.get_minor_locator() function to check the current minor locator and adjust it if necessary. We also adjust the major locator based on the data range. This approach ensures that both subplots have appropriate and consistent tick placements.
Conclusion
The Matplotlib.axis.Axis.get_minor_locator() function is a powerful tool in the Matplotlib library for accessing and manipulating minor tick locators. Throughout this comprehensive guide, we've explored its syntax, usage, and practical applications in various plotting scenarios. From basic usage to advanced techniques, we've seen how this function can be used to enhance the readability and precision of data visualizations.
Key takeaways from this guide include:
- The Matplotlib.axis.Axis.get_minor_locator() function returns the current minor locator object for a specified axis.
- It can be used in conjunction with other Matplotlib functions to customize tick placements and appearances.
- The function is useful for ensuring consistency across multiple subplots and adapting tick locations to different data ranges.
- Advanced usage includes dynamic tick adjustment, custom tick locators, and working with logarithmic scales.