Comprehensive Guide to Matplotlib.axis.Axis.get_ticklabels() Function in Python
Matplotlib.axis.Axis.get_ticklabels() function in Python is a powerful tool for retrieving and manipulating tick labels in Matplotlib plots. This function is an essential part of the Matplotlib library, which is widely used for creating static, animated, and interactive visualizations in Python. In this comprehensive guide, we’ll explore the Matplotlib.axis.Axis.get_ticklabels() function in depth, covering its usage, parameters, and various applications in data visualization.
Understanding the Basics of Matplotlib.axis.Axis.get_ticklabels()
The Matplotlib.axis.Axis.get_ticklabels() function is a method of the Axis class in Matplotlib. It is used to retrieve the tick labels of an axis as a list of Text instances. These tick labels represent the textual information displayed alongside the tick marks on an axis, providing context and scale to the plot.
Let’s start with a simple example to demonstrate the basic usage of Matplotlib.axis.Axis.get_ticklabels():
import matplotlib.pyplot as plt

# Create a simple plot
fig, ax = plt.subplots()
ax.plot([1, 2, 3, 4], [1, 4, 2, 3])

# Get the tick labels of the x-axis
x_tick_labels = ax.xaxis.get_ticklabels()

# Print the tick labels
for label in x_tick_labels:
    print(label.get_text())

plt.title("Basic usage of get_ticklabels() - how2matplotlib.com")
plt.show()
Output:
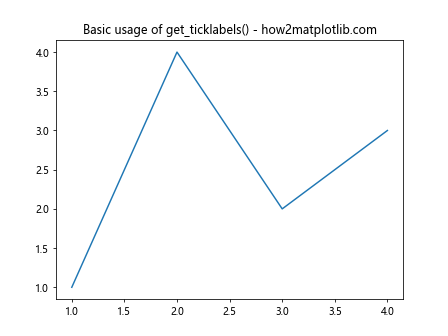
In this example, we create a simple line plot and use the Matplotlib.axis.Axis.get_ticklabels() function to retrieve the tick labels of the x-axis. We then iterate through the labels and print their text content.
Parameters of Matplotlib.axis.Axis.get_ticklabels()
The Matplotlib.axis.Axis.get_ticklabels() function accepts several optional parameters that allow you to customize the returned tick labels. Let’s explore these parameters in detail:
- minor (bool): If set to True, return the minor tick labels instead of the major tick labels.
- which (str): Determines which tick labels to return. Can be ‘major’, ‘minor’, or ‘both’.
Here’s an example demonstrating the usage of these parameters:
import matplotlib.pyplot as plt

fig, ax = plt.subplots()
ax.plot([1, 2, 3, 4], [1, 4, 2, 3])

# Get major tick labels
major_labels = ax.xaxis.get_ticklabels(minor=False)

# Get minor tick labels
minor_labels = ax.xaxis.get_ticklabels(minor=True)

# Get both major and minor tick labels
all_labels = ax.xaxis.get_ticklabels(which='both')

print("Major labels:", [label.get_text() for label in major_labels])
print("Minor labels:", [label.get_text() for label in minor_labels])
print("All labels:", [label.get_text() for label in all_labels])

plt.title("Parameters of get_ticklabels() - how2matplotlib.com")
plt.show()
Output:
This example demonstrates how to retrieve major, minor, and both types of tick labels using the Matplotlib.axis.Axis.get_ticklabels() function.
Customizing Tick Labels with Matplotlib.axis.Axis.get_ticklabels()
One of the most powerful features of the Matplotlib.axis.Axis.get_ticklabels() function is its ability to help you customize tick labels. You can modify various properties of the tick labels, such as their text, color, font size, and rotation.
Let’s explore some examples of customizing tick labels:
import matplotlib.pyplot as plt

fig, ax = plt.subplots()
ax.plot([1, 2, 3, 4], [1, 4, 2, 3])

# Get the tick labels
labels = ax.xaxis.get_ticklabels()

# Customize the labels
for i, label in enumerate(labels):
    label.set_text(f"X{i+1}")
    label.set_color('red')
    label.set_fontsize(12)
    label.set_rotation(45)

# Update the tick labels
ax.xaxis.set_ticklabels(labels)

plt.title("Customizing tick labels - how2matplotlib.com")
plt.show()
Output:
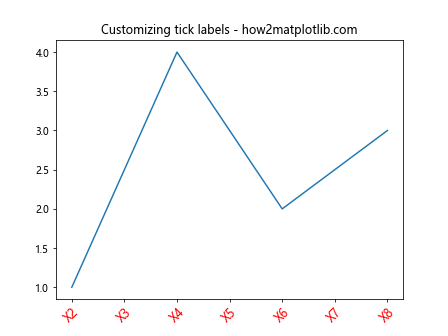
In this example, we retrieve the tick labels using Matplotlib.axis.Axis.get_ticklabels(), modify their text, color, font size, and rotation, and then update the axis with the customized labels.
Working with Date Tick Labels
The Matplotlib.axis.Axis.get_ticklabels() function is particularly useful when working with date-based plots. You can use it to retrieve and format date tick labels easily.
Here’s an example:
import matplotlib.pyplot as plt
import matplotlib.dates as mdates
from datetime import datetime, timedelta

# Generate some date data
dates = [datetime(2023, 1, 1) + timedelta(days=i) for i in range(10)]
values = [1, 3, 2, 4, 3, 5, 4, 6, 5, 7]

fig, ax = plt.subplots()
ax.plot(dates, values)

# Format x-axis as dates
ax.xaxis.set_major_formatter(mdates.DateFormatter('%Y-%m-%d'))

# Get the tick labels
labels = ax.xaxis.get_ticklabels()

# Customize the date labels
for label in labels:
    label.set_rotation(45)
    label.set_ha('right')

plt.title("Working with date tick labels - how2matplotlib.com")
plt.tight_layout()
plt.show()
Output:
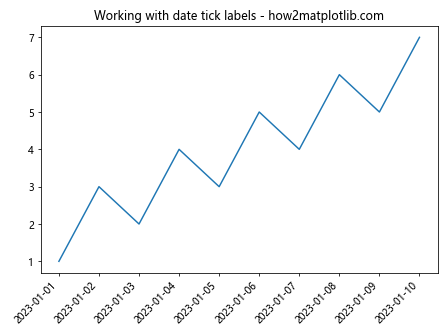
This example demonstrates how to use Matplotlib.axis.Axis.get_ticklabels() to retrieve and customize date tick labels in a time series plot.
Handling Overlapping Tick Labels
When dealing with dense data or long tick labels, you may encounter overlapping labels. The Matplotlib.axis.Axis.get_ticklabels() function can help you address this issue by allowing you to selectively show or hide labels.
Here’s an example of how to handle overlapping tick labels:
import matplotlib.pyplot as plt

fig, ax = plt.subplots(figsize=(10, 5))
ax.plot(range(20), range(20))

# Get the tick labels
labels = ax.xaxis.get_ticklabels()

# Show every nth label to avoid overlapping
n = 2
for i, label in enumerate(labels):
    if i % n != 0:
        label.set_visible(False)

plt.title("Handling overlapping tick labels - how2matplotlib.com")
plt.show()
Output:
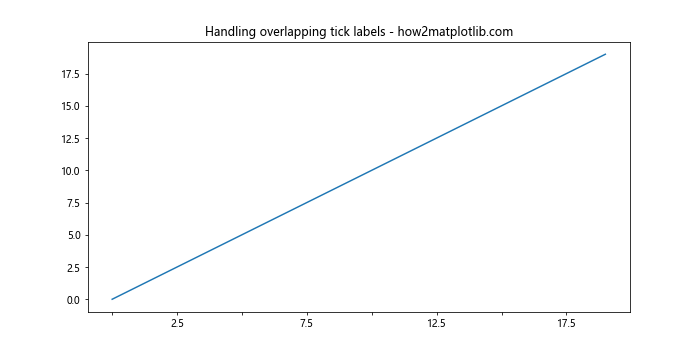
In this example, we use Matplotlib.axis.Axis.get_ticklabels() to retrieve the x-axis tick labels and then hide every other label to prevent overlapping.
Using Matplotlib.axis.Axis.get_ticklabels() with Subplots
The Matplotlib.axis.Axis.get_ticklabels() function is particularly useful when working with subplots, as it allows you to customize tick labels for individual subplots.
Here’s an example demonstrating this:
import matplotlib.pyplot as plt

fig, (ax1, ax2) = plt.subplots(2, 1, figsize=(8, 8))

ax1.plot([1, 2, 3, 4], [1, 4, 2, 3])
ax2.plot([1, 2, 3, 4], [3, 2, 4, 1])

# Customize tick labels for the first subplot
labels1 = ax1.xaxis.get_ticklabels()
for label in labels1:
    label.set_color('red')
    label.set_fontweight('bold')

# Customize tick labels for the second subplot
labels2 = ax2.xaxis.get_ticklabels()
for label in labels2:
    label.set_color('blue')
    label.set_fontsize(14)

plt.suptitle("Using get_ticklabels() with subplots - how2matplotlib.com")
plt.tight_layout()
plt.show()
Output:
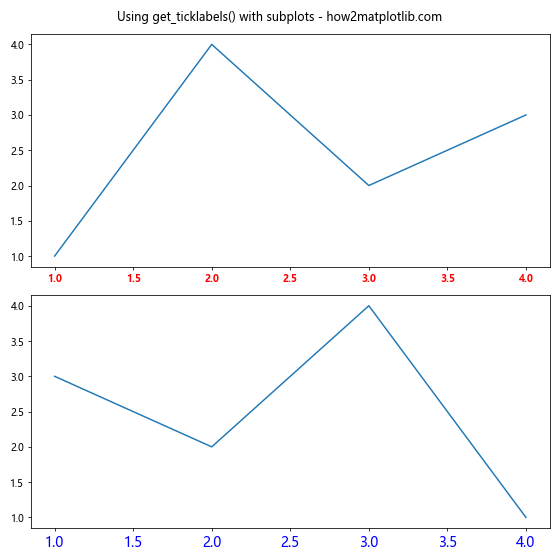
This example shows how to use Matplotlib.axis.Axis.get_ticklabels() to customize tick labels for different subplots independently.
Combining Matplotlib.axis.Axis.get_ticklabels() with Other Axis Methods
The Matplotlib.axis.Axis.get_ticklabels() function can be combined with other axis methods to achieve more complex customizations. Let’s explore some examples:
import matplotlib.pyplot as plt
import numpy as np

fig, ax = plt.subplots()
x = np.linspace(0, 2*np.pi, 100)
y = np.sin(x)
ax.plot(x, y)

# Get current tick locations
locs = ax.xaxis.get_ticklocs()

# Get tick labels
labels = ax.xaxis.get_ticklabels()

# Customize tick labels based on their position
for loc, label in zip(locs, labels):
    if loc < np.pi:
        label.set_color('red')
    else:
        label.set_color('blue')
    label.set_text(f"{loc:.2f}")

# Update tick labels
ax.xaxis.set_ticklabels(labels)

plt.title("Combining get_ticklabels() with other methods - how2matplotlib.com")
plt.show()
Output:
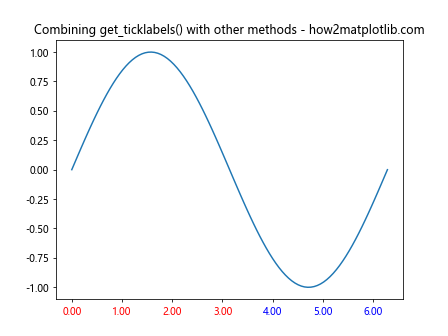
In this example, we combine Matplotlib.axis.Axis.get_ticklabels() with get_ticklocs() to customize tick labels based on their positions on the axis.
Handling Missing Tick Labels
Sometimes, you may encounter situations where some tick labels are missing. The Matplotlib.axis.Axis.get_ticklabels() function can help you identify and handle these cases.
Here's an example:
import matplotlib.pyplot as plt
import numpy as np

fig, ax = plt.subplots()
x = np.linspace(0, 10, 11)
y = x**2
ax.plot(x, y)

# Set some tick labels to empty strings
ax.set_xticklabels([''] * len(x))

# Get tick labels
labels = ax.xaxis.get_ticklabels()

# Replace empty labels with custom text
for i, label in enumerate(labels):
    if label.get_text() == '':
        label.set_text(f"X{i}")
    label.set_color('red')

plt.title("Handling missing tick labels - how2matplotlib.com")
plt.show()
Output:
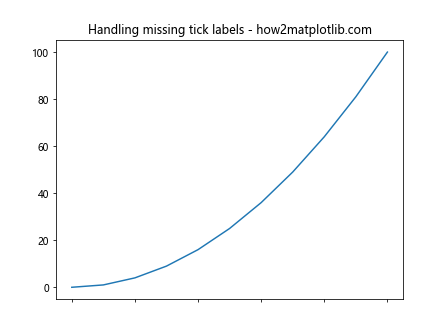
In this example, we intentionally set some tick labels to empty strings and then use Matplotlib.axis.Axis.get_ticklabels() to identify and replace these empty labels with custom text.
Using Matplotlib.axis.Axis.get_ticklabels() with Categorical Data
The Matplotlib.axis.Axis.get_ticklabels() function is particularly useful when working with categorical data. Here's an example:
import matplotlib.pyplot as plt

categories = ['A', 'B', 'C', 'D', 'E']
values = [3, 7, 2, 5, 8]

fig, ax = plt.subplots()
ax.bar(categories, values)

# Get tick labels
labels = ax.xaxis.get_ticklabels()

# Customize tick labels for categories
for label in labels:
    category = label.get_text()
    if category in ['A', 'E']:
        label.set_color('red')
        label.set_fontweight('bold')

plt.title("Using get_ticklabels() with categorical data - how2matplotlib.com")
plt.show()
Output:
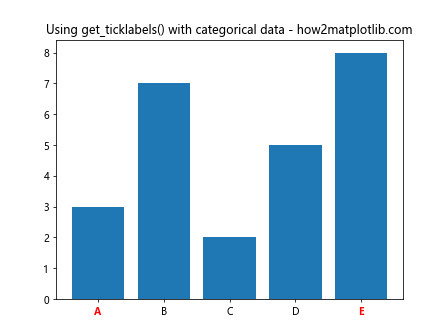
This example demonstrates how to use Matplotlib.axis.Axis.get_ticklabels() to customize tick labels for categorical data in a bar plot.
Applying Matplotlib.axis.Axis.get_ticklabels() to 3D Plots
The Matplotlib.axis.Axis.get_ticklabels() function can also be applied to 3D plots. Here's an example:
import matplotlib.pyplot as plt
from mpl_toolkits.mplot3d import Axes3D
import numpy as np

fig = plt.figure()
ax = fig.add_subplot(111, projection='3d')

x = np.linspace(-5, 5, 100)
y = np.linspace(-5, 5, 100)
X, Y = np.meshgrid(x, y)
Z = np.sin(np.sqrt(X**2 + Y**2))

ax.plot_surface(X, Y, Z)

# Get tick labels for all axes
x_labels = ax.xaxis.get_ticklabels()
y_labels = ax.yaxis.get_ticklabels()
z_labels = ax.zaxis.get_ticklabels()

# Customize tick labels for each axis
for labels in [x_labels, y_labels, z_labels]:
    for label in labels:
        label.set_fontsize(8)
        label.set_color('red')

plt.title("Using get_ticklabels() with 3D plots - how2matplotlib.com")
plt.show()
Output:
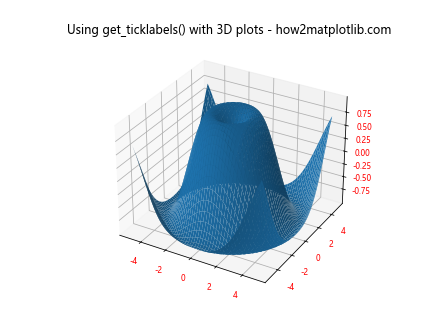
This example shows how to use Matplotlib.axis.Axis.get_ticklabels() to customize tick labels for all three axes in a 3D plot.
Combining Matplotlib.axis.Axis.get_ticklabels() with Seaborn
The Matplotlib.axis.Axis.get_ticklabels() function can be used in conjunction with other data visualization libraries that are built on top of Matplotlib, such as Seaborn. Here's an example:
import matplotlib.pyplot as plt
import seaborn as sns
import numpy as np

# Create a Seaborn plot
tips = sns.load_dataset("tips")
sns.scatterplot(data=tips, x="total_bill", y="tip")

# Get the current axes
ax = plt.gca()

# Get tick labels for both axes
x_labels = ax.xaxis.get_ticklabels()
y_labels = ax.yaxis.get_ticklabels()

# Customize tick labels
for labels in [x_labels, y_labels]:
    for label in labels:
        label.set_fontsize(8)
        label.set_rotation(45)

plt.title("Using get_ticklabels() with Seaborn - how2matplotlib.com")
plt.tight_layout()
plt.show()
Output:
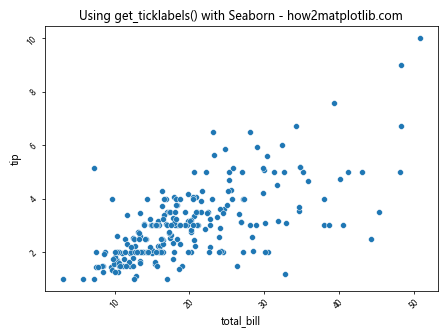
This example demonstrates how to use Matplotlib.axis.Axis.get_ticklabels() to customize tick labels in a Seaborn plot.
Advanced Techniques with Matplotlib.axis.Axis.get_ticklabels()
Let's explore some advanced techniques using the Matplotlib.axis.Axis.get_ticklabels() function:
1. Dynamic Tick Label Formatting
import matplotlib.pyplot as plt
import numpy as np

fig, ax = plt.subplots()
x = np.linspace(0, 1, 1000)
y = np.sin(2 * np.pi * x)
ax.plot(x, y)

# Get tick labels
labels = ax.xaxis.get_ticklabels()

# Dynamic formatting based on tick value
for label in labels:
    value = float(label.get_text())
    if value == 0:
        label.set_text("Zero")
    elif value == 0.5:
        label.set_text("Half")
    elif value == 1:
        label.set_text("One")
    else:
        label.set_text(f"{value:.2f}")

plt.title("Dynamic tick label formatting - how2matplotlib.com")
plt.show()
This example demonstrates how to dynamically format tick labels based on their values using Matplotlib.axis.Axis.get_ticklabels().
2. Conditional Tick Label Styling
import matplotlib.pyplot as plt
import numpy as np

fig, ax = plt.subplots()
x = np.linspace(-5, 5, 100)
y = x**2
ax.plot(x, y)

# Get tick labels
labels = ax.xaxis.get_ticklabels()

# Conditional styling
for label in labels:
    value = float(label.get_text())
    if value < 0:
        label.set_color('red')
    elif value > 0:
        label.set_color('blue')
    else:
        label.set_color('green')
        label.set_fontweight('bold')

plt.title("Conditional tick label styling - how2matplotlib.com")
plt.show()
This example shows how to apply conditional styling to tick labels based on their values using Matplotlib.axis.Axis.get_ticklabels().
3. Custom Tick Label Positioning
import matplotlib.pyplot as plt
import numpy as np

fig, ax = plt.subplots()
x = np.linspace(0, 10, 11)
y = x**2
ax.plot(x, y)

# Get tick labels and locations
labels = ax.xaxis.get_ticklabels()
locs = ax.xaxis.get_ticklocs()

# Custom positioning
for label, loc in zip(labels, locs):
    label.set_y(-0.05 * (loc % 2))  # Alternate label positions

plt.title("Custom tick label positioning - how2matplotlib.com")
plt.show()
Output:
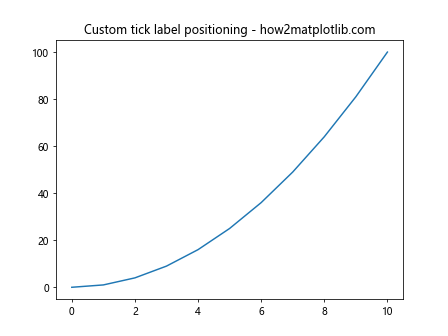
This example demonstrates how to customize the positioning of tick labels using Matplotlib.axis.Axis.get_ticklabels() in combination with get_ticklocs().
Best Practices for Using Matplotlib.axis.Axis.get_ticklabels()
When working with the Matplotlib.axis.Axis.get_ticklabels() function, it's important to keep in mind some best practices:
- Always update the axis with set_ticklabels() after modifying the labels.
- Be mindful of performance when working with large datasets or many subplots.
- Use tight_layout() or adjust_subplot() to prevent overlapping labels.
- Consider using locators and formatters for more complex tick label requirements.
- Test your visualizations with different data ranges to ensure readability.
Common Pitfalls and How to Avoid Them
When using Matplotlib.axis.Axis.get_ticklabels(), you might encounter some common issues. Here are a few pitfalls and how to avoid them:
- Empty label list: If get_ticklabels() returns an empty list, make sure you've plotted data and that the axis limits are set correctly.
Changes not reflected: Remember to call draw() or show() after modifying tick labels to see the changes.
Performance issues: For plots with many tick labels, consider using set_visible(False) for some labels instead of removing them entirely.
Inconsistent label appearance: Use a consistent style throughout your visualization by defining a style dictionary and applying it to all labels.
Conclusion
The Matplotlib.axis.Axis.get_ticklabels() function is a powerful tool for customizing and manipulating tick labels in Matplotlib plots. By mastering this function, you can create more informative and visually appealing data visualizations. Remember to experiment with different techniques and always consider the best practices to ensure your plots are clear and effective. In this comprehensive guide, we've explored various aspects of the Matplotlib.axis.Axis.get_ticklabels() function, including its basic usage, parameters, and advanced applications. We've covered topics such as customizing tick labels, working with date-based plots, handling overlapping labels, and applying the function to different types of plots.