Comprehensive Guide to Matplotlib.axis.Axis.get_ticklines() Function in Python
Matplotlib.axis.Axis.get_ticklines() function in Python is a powerful tool for customizing the appearance of tick lines in Matplotlib plots. This function allows you to access and modify the properties of tick lines, giving you fine-grained control over your visualizations. In this comprehensive guide, we’ll explore the Matplotlib.axis.Axis.get_ticklines() function in depth, covering its usage, parameters, and various applications.
Understanding the Matplotlib.axis.Axis.get_ticklines() Function
The Matplotlib.axis.Axis.get_ticklines() function is a method of the Axis class in Matplotlib. It returns a list of Line2D objects representing the tick lines for the specified axis. These tick lines are the small marks that indicate the position of tick labels on the axis.
Let’s start with a simple example to demonstrate how to use the Matplotlib.axis.Axis.get_ticklines() function:
import matplotlib.pyplot as plt

# Create a simple plot
fig, ax = plt.subplots()
ax.plot([1, 2, 3, 4], [1, 4, 2, 3])

# Get the tick lines for the x-axis
x_ticklines = ax.xaxis.get_ticklines()

# Customize the tick lines
for line in x_ticklines:
    line.set_color('red')
    line.set_markersize(10)
    line.set_markeredgewidth(2)

plt.title('How to use Matplotlib.axis.Axis.get_ticklines() - how2matplotlib.com')
plt.show()
Output:
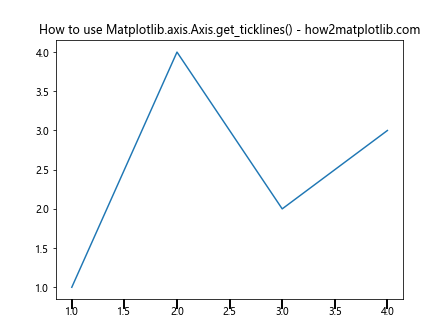
In this example, we create a simple line plot and then use the Matplotlib.axis.Axis.get_ticklines() function to access the tick lines of the x-axis. We then iterate through the returned list of Line2D objects and customize their appearance by changing the color, size, and width.
Customizing Tick Lines with Matplotlib.axis.Axis.get_ticklines()
The Matplotlib.axis.Axis.get_ticklines() function provides a powerful way to customize the appearance of tick lines. Let’s explore some common customizations:
Changing Tick Line Color
import matplotlib.pyplot as plt

fig, ax = plt.subplots()
ax.plot([1, 2, 3, 4], [1, 4, 2, 3])

ticklines = ax.xaxis.get_ticklines()
for line in ticklines:
    line.set_color('green')

ax.set_title('Custom Tick Line Color - how2matplotlib.com')
plt.show()
Output:
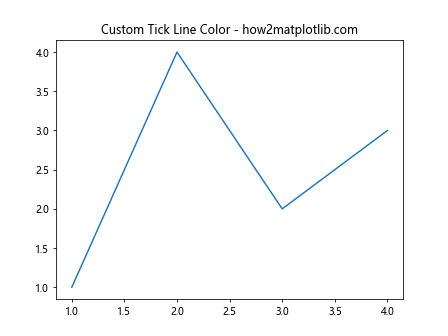
In this example, we use the Matplotlib.axis.Axis.get_ticklines() function to change the color of all x-axis tick lines to green.
Adjusting Tick Line Length
import matplotlib.pyplot as plt

fig, ax = plt.subplots()
ax.plot([1, 2, 3, 4], [1, 4, 2, 3])

ticklines = ax.xaxis.get_ticklines()
for line in ticklines:
    line.set_markersize(15)  # Increase tick line length

ax.set_title('Custom Tick Line Length - how2matplotlib.com')
plt.show()
Output:
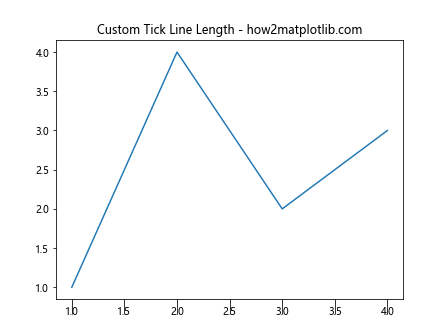
Here, we use the Matplotlib.axis.Axis.get_ticklines() function to increase the length of all x-axis tick lines.
Modifying Tick Line Width
import matplotlib.pyplot as plt

fig, ax = plt.subplots()
ax.plot([1, 2, 3, 4], [1, 4, 2, 3])

ticklines = ax.xaxis.get_ticklines()
for line in ticklines:
    line.set_linewidth(2)  # Increase tick line width

ax.set_title('Custom Tick Line Width - how2matplotlib.com')
plt.show()
Output:
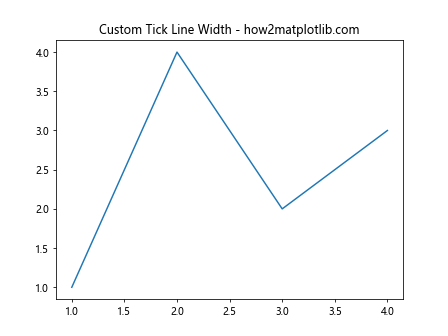
In this example, we use the Matplotlib.axis.Axis.get_ticklines() function to increase the width of all x-axis tick lines.
Customizing Tick Lines for Different Axes
The Matplotlib.axis.Axis.get_ticklines() function can be used to customize tick lines for different axes independently:
import matplotlib.pyplot as plt

fig, ax = plt.subplots()
ax.plot([1, 2, 3, 4], [1, 4, 2, 3])

x_ticklines = ax.xaxis.get_ticklines()
y_ticklines = ax.yaxis.get_ticklines()

for line in x_ticklines:
    line.set_color('red')
    line.set_markersize(10)

for line in y_ticklines:
    line.set_color('blue')
    line.set_markersize(8)

ax.set_title('Custom Tick Lines for Different Axes - how2matplotlib.com')
plt.show()
Output:
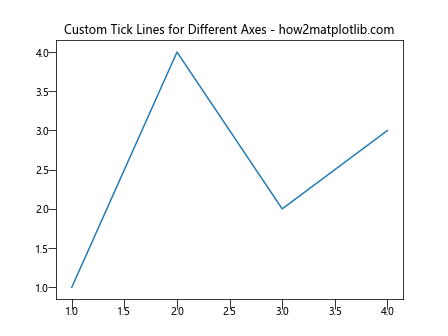
In this example, we use the Matplotlib.axis.Axis.get_ticklines() function to customize the x-axis and y-axis tick lines differently.
Advanced Applications of Matplotlib.axis.Axis.get_ticklines()
Now that we’ve covered the basics, let’s explore some more advanced applications of the Matplotlib.axis.Axis.get_ticklines() function.
Creating a Custom Tick Style
You can use the Matplotlib.axis.Axis.get_ticklines() function to create a custom tick style:
import matplotlib.pyplot as plt

fig, ax = plt.subplots()
ax.plot([1, 2, 3, 4], [1, 4, 2, 3])

ticklines = ax.xaxis.get_ticklines()
for i, line in enumerate(ticklines):
    if i % 2 == 0:
        line.set_color('red')
        line.set_markersize(15)
    else:
        line.set_color('blue')
        line.set_markersize(10)

ax.set_title('Custom Tick Style - how2matplotlib.com')
plt.show()
Output:
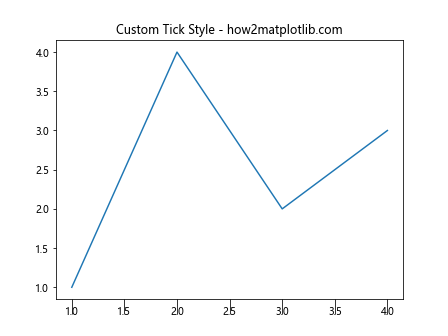
In this example, we use the Matplotlib.axis.Axis.get_ticklines() function to create alternating red and blue tick lines with different sizes.
Highlighting Specific Ticks
The Matplotlib.axis.Axis.get_ticklines() function can be used to highlight specific ticks:
import matplotlib.pyplot as plt

fig, ax = plt.subplots()
ax.plot([1, 2, 3, 4, 5], [1, 4, 2, 3, 5])

ticklines = ax.xaxis.get_ticklines()
for i, line in enumerate(ticklines):
    if i == 2:  # Highlight the third tick
        line.set_color('red')
        line.set_markersize(20)
        line.set_markeredgewidth(3)

ax.set_title('Highlighting Specific Ticks - how2matplotlib.com')
plt.show()
Output:
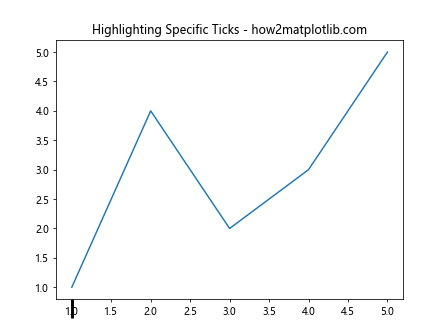
In this example, we use the Matplotlib.axis.Axis.get_ticklines() function to highlight the third tick on the x-axis.
Creating a Gradient Effect on Tick Lines
You can use the Matplotlib.axis.Axis.get_ticklines() function to create a gradient effect on tick lines:
import matplotlib.pyplot as plt
import matplotlib.colors as mcolors

fig, ax = plt.subplots()
ax.plot([1, 2, 3, 4, 5], [1, 4, 2, 3, 5])

ticklines = ax.xaxis.get_ticklines()
colors = plt.cm.viridis(np.linspace(0, 1, len(ticklines)))

for line, color in zip(ticklines, colors):
    line.set_color(color)
    line.set_markersize(10)

ax.set_title('Gradient Effect on Tick Lines - how2matplotlib.com')
plt.show()
In this example, we use the Matplotlib.axis.Axis.get_ticklines() function to create a gradient effect on the x-axis tick lines using the viridis colormap.
Combining Matplotlib.axis.Axis.get_ticklines() with Other Matplotlib Functions
The Matplotlib.axis.Axis.get_ticklines() function can be combined with other Matplotlib functions to create more complex visualizations. Let’s explore some examples:
Customizing Tick Lines in a Subplot Grid
import matplotlib.pyplot as plt

fig, axs = plt.subplots(2, 2, figsize=(10, 10))

for ax in axs.flat:
    ax.plot([1, 2, 3, 4], [1, 4, 2, 3])

    x_ticklines = ax.xaxis.get_ticklines()
    y_ticklines = ax.yaxis.get_ticklines()

    for line in x_ticklines:
        line.set_color('red')
        line.set_markersize(10)

    for line in y_ticklines:
        line.set_color('blue')
        line.set_markersize(8)

fig.suptitle('Customizing Tick Lines in a Subplot Grid - how2matplotlib.com')
plt.tight_layout()
plt.show()
Output:

In this example, we use the Matplotlib.axis.Axis.get_ticklines() function to customize tick lines in a 2×2 subplot grid.
Combining with Logarithmic Scales
import matplotlib.pyplot as plt
import numpy as np

fig, ax = plt.subplots()

x = np.logspace(0, 3, 50)
y = x**2

ax.loglog(x, y)

x_ticklines = ax.xaxis.get_ticklines()
y_ticklines = ax.yaxis.get_ticklines()

for line in x_ticklines:
    line.set_color('red')
    line.set_markersize(10)

for line in y_ticklines:
    line.set_color('blue')
    line.set_markersize(8)

ax.set_title('Customizing Tick Lines with Logarithmic Scales - how2matplotlib.com')
plt.show()
Output:
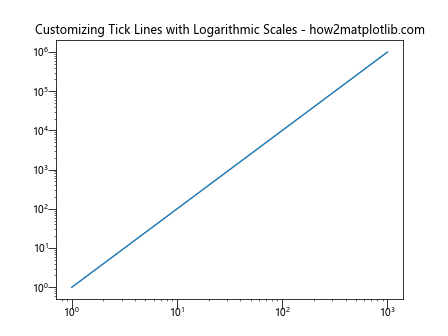
In this example, we combine the Matplotlib.axis.Axis.get_ticklines() function with logarithmic scales to customize tick lines in a log-log plot.
Customizing Tick Lines in Polar Plots
import matplotlib.pyplot as plt
import numpy as np

fig, ax = plt.subplots(subplot_kw=dict(projection='polar'))

r = np.arange(0, 2, 0.01)
theta = 2 * np.pi * r

ax.plot(theta, r)

r_ticklines = ax.yaxis.get_ticklines()
theta_ticklines = ax.xaxis.get_ticklines()

for line in r_ticklines:
    line.set_color('red')
    line.set_markersize(10)

for line in theta_ticklines:
    line.set_color('blue')
    line.set_markersize(8)

ax.set_title('Customizing Tick Lines in Polar Plots - how2matplotlib.com')
plt.show()
Output:
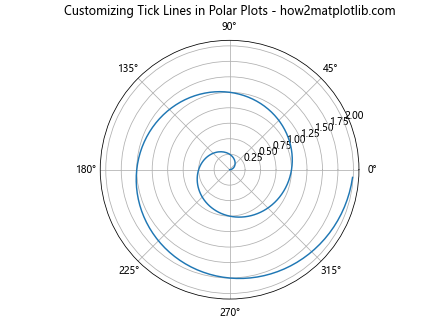
In this example, we use the Matplotlib.axis.Axis.get_ticklines() function to customize tick lines in a polar plot.
Best Practices for Using Matplotlib.axis.Axis.get_ticklines()
When working with the Matplotlib.axis.Axis.get_ticklines() function, it’s important to keep some best practices in mind:
- Consistency: Try to maintain a consistent style across your visualizations. If you’re customizing tick lines, consider doing it uniformly across all axes and subplots.
Readability: While customization can enhance your plots, make sure it doesn’t compromise readability. Avoid using colors or sizes that make the tick lines difficult to see.
Performance: If you’re working with large datasets or creating many subplots, be mindful of performance. Customizing every tick line individually can be computationally expensive.
Accessibility: Consider color blindness and other accessibility issues when choosing colors for your tick lines.
Documentation: If you’re creating complex customizations, consider adding comments to your code to explain your choices. This will help others (or yourself in the future) understand your visualization choices.
Let’s see an example that incorporates these best practices: