Comprehensive Guide to Matplotlib.axis.Axis.get_ticklocs() Function in Python
Matplotlib.axis.Axis.get_ticklocs() function in Python is an essential tool for manipulating and customizing plot axes in Matplotlib. This function allows you to retrieve the locations of the tick marks on an axis, providing valuable information for further customization and analysis of your plots. In this comprehensive guide, we’ll explore the Matplotlib.axis.Axis.get_ticklocs() function in depth, covering its usage, parameters, and various applications in data visualization.
Understanding the Basics of Matplotlib.axis.Axis.get_ticklocs()
The Matplotlib.axis.Axis.get_ticklocs() function is a method of the Axis class in Matplotlib. It returns an array of tick locations for the given axis. This function is particularly useful when you need to access or modify the positions of tick marks on your plot’s axes.
Let’s start with a simple example to demonstrate how to use the Matplotlib.axis.Axis.get_ticklocs() function:
import matplotlib.pyplot as plt
import numpy as np

# Create a simple plot
x = np.linspace(0, 10, 100)
y = np.sin(x)

fig, ax = plt.subplots()
ax.plot(x, y)

# Get tick locations for the x-axis
x_ticks = ax.xaxis.get_ticklocs()

print("X-axis tick locations:", x_ticks)

plt.title("How to use Matplotlib.axis.Axis.get_ticklocs() - how2matplotlib.com")
plt.show()
Output:
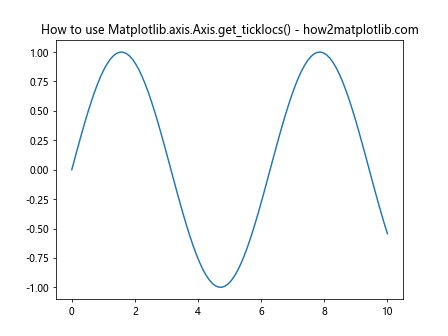
In this example, we create a simple sine wave plot and then use the Matplotlib.axis.Axis.get_ticklocs() function to retrieve the tick locations for the x-axis. The function returns an array of tick locations, which we then print to the console.
Parameters of Matplotlib.axis.Axis.get_ticklocs()
The Matplotlib.axis.Axis.get_ticklocs() function has a few optional parameters that allow you to customize its behavior:
- minor (bool, optional): If True, return the minor tick locations instead of the major tick locations. Default is False.
- original (bool, optional): If True, return the original tick locations, before any tick locator has been applied. Default is False.
Let’s explore these parameters with some examples:
import matplotlib.pyplot as plt
import numpy as np

# Create a simple plot
x = np.linspace(0, 10, 100)
y = np.sin(x)

fig, ax = plt.subplots()
ax.plot(x, y)

# Get major tick locations
major_ticks = ax.xaxis.get_ticklocs()

# Get minor tick locations
minor_ticks = ax.xaxis.get_ticklocs(minor=True)

print("Major tick locations:", major_ticks)
print("Minor tick locations:", minor_ticks)

plt.title("Major and Minor Ticks with get_ticklocs() - how2matplotlib.com")
plt.show()
Output:
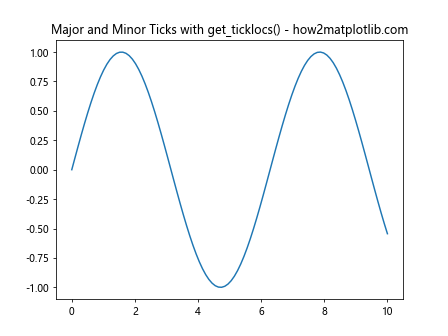
In this example, we demonstrate how to use the minor parameter to retrieve both major and minor tick locations. The minor=True argument allows us to access the minor tick locations, which are often used for more detailed axis markings.
Applications of Matplotlib.axis.Axis.get_ticklocs()
The Matplotlib.axis.Axis.get_ticklocs() function has numerous applications in data visualization and plot customization. Let’s explore some common use cases:
1. Customizing Tick Labels
One common application of Matplotlib.axis.Axis.get_ticklocs() is to customize tick labels. By retrieving the tick locations, you can create custom labels that correspond to those locations:
import matplotlib.pyplot as plt
import numpy as np

# Create a simple plot
x = np.linspace(0, 10, 100)
y = np.sin(x)

fig, ax = plt.subplots()
ax.plot(x, y)

# Get tick locations
tick_locs = ax.xaxis.get_ticklocs()

# Create custom labels
custom_labels = [f"Point {i}" for i in range(len(tick_locs))]

# Set custom tick labels
ax.set_xticks(tick_locs)
ax.set_xticklabels(custom_labels)

plt.title("Custom Tick Labels using get_ticklocs() - how2matplotlib.com")
plt.show()
Output:
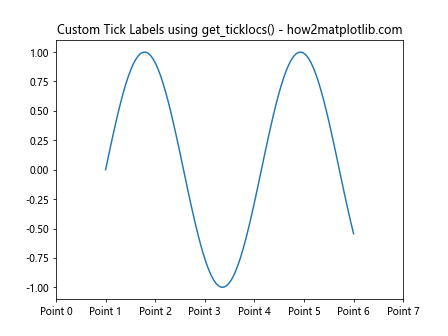
In this example, we use Matplotlib.axis.Axis.get_ticklocs() to retrieve the x-axis tick locations and then create custom labels for each tick. This technique is useful when you want to provide more descriptive or context-specific labels for your plot.
2. Adding Secondary Axis
The Matplotlib.axis.Axis.get_ticklocs() function can be helpful when adding a secondary axis to your plot. You can use it to ensure that the tick locations on both axes align properly:
import matplotlib.pyplot as plt
import numpy as np

# Create data
x = np.linspace(0, 10, 100)
y1 = np.sin(x)
y2 = np.cos(x)

fig, ax1 = plt.subplots()

# Plot on primary axis
ax1.plot(x, y1, 'b-', label='sin(x)')
ax1.set_xlabel('X-axis')
ax1.set_ylabel('Y-axis (sin)', color='b')

# Create secondary axis
ax2 = ax1.twinx()
ax2.plot(x, y2, 'r-', label='cos(x)')
ax2.set_ylabel('Y-axis (cos)', color='r')

# Get tick locations from primary axis
primary_ticks = ax1.xaxis.get_ticklocs()

# Set same tick locations on secondary axis
ax2.set_xticks(primary_ticks)

plt.title("Secondary Axis with Aligned Ticks - how2matplotlib.com")
plt.show()
Output:
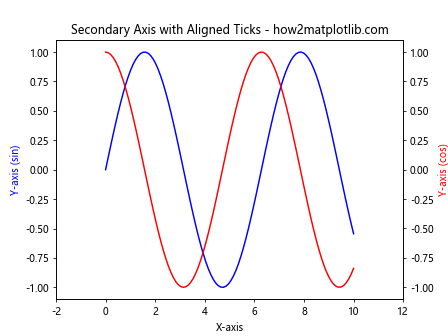
In this example, we create a plot with two y-axes. We use Matplotlib.axis.Axis.get_ticklocs() to retrieve the tick locations from the primary x-axis and then apply those same locations to the secondary axis, ensuring that the ticks align perfectly.
3. Creating Custom Grid Lines
The Matplotlib.axis.Axis.get_ticklocs() function can be used to create custom grid lines that align with your tick marks:
import matplotlib.pyplot as plt
import numpy as np

# Create data
x = np.linspace(0, 10, 100)
y = np.sin(x)

fig, ax = plt.subplots()
ax.plot(x, y)

# Get tick locations
x_ticks = ax.xaxis.get_ticklocs()
y_ticks = ax.yaxis.get_ticklocs()

# Add custom grid lines
for xtick in x_ticks:
    ax.axvline(x=xtick, color='gray', linestyle='--', alpha=0.5)
for ytick in y_ticks:
    ax.axhline(y=ytick, color='gray', linestyle='--', alpha=0.5)

plt.title("Custom Grid Lines using get_ticklocs() - how2matplotlib.com")
plt.show()
Output:
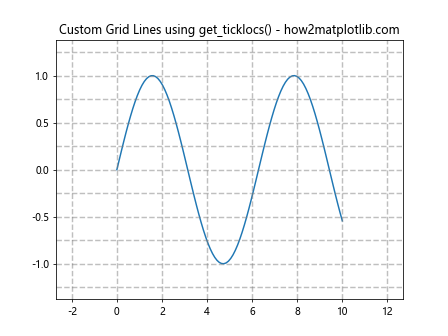
In this example, we use Matplotlib.axis.Axis.get_ticklocs() to retrieve both x and y-axis tick locations. We then use these locations to add custom vertical and horizontal grid lines that align perfectly with the tick marks.
4. Highlighting Specific Tick Ranges
You can use Matplotlib.axis.Axis.get_ticklocs() to highlight specific ranges on your plot based on tick locations:
import matplotlib.pyplot as plt
import numpy as np

# Create data
x = np.linspace(0, 10, 100)
y = np.sin(x)

fig, ax = plt.subplots()
ax.plot(x, y)

# Get tick locations
x_ticks = ax.xaxis.get_ticklocs()

# Highlight range between 2nd and 4th tick
ax.axvspan(x_ticks[1], x_ticks[3], alpha=0.3, color='yellow')

plt.title("Highlighting Tick Range - how2matplotlib.com")
plt.show()
Output:
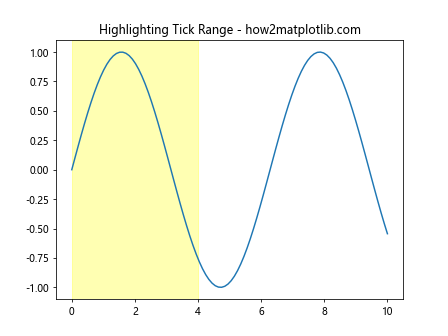
In this example, we use Matplotlib.axis.Axis.get_ticklocs() to retrieve the x-axis tick locations and then use ax.axvspan() to highlight the range between the second and fourth tick marks.
5. Creating Logarithmic Plots
The Matplotlib.axis.Axis.get_ticklocs() function can be particularly useful when working with logarithmic scales:
import matplotlib.pyplot as plt
import numpy as np

# Create data
x = np.logspace(0, 3, 100)
y = x**2

fig, ax = plt.subplots()
ax.loglog(x, y)

# Get tick locations
x_ticks = ax.xaxis.get_ticklocs()
y_ticks = ax.yaxis.get_ticklocs()

print("X-axis tick locations (log scale):", x_ticks)
print("Y-axis tick locations (log scale):", y_ticks)

plt.title("Logarithmic Plot with get_ticklocs() - how2matplotlib.com")
plt.show()
Output:
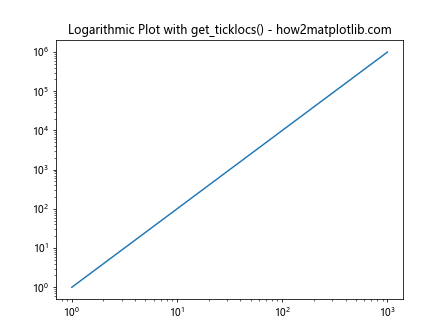
In this example, we create a logarithmic plot and use Matplotlib.axis.Axis.get_ticklocs() to retrieve the tick locations on both axes. This can be helpful for understanding how Matplotlib handles tick placement in logarithmic scales.
6. Customizing Tick Density
You can use Matplotlib.axis.Axis.get_ticklocs() in combination with other Matplotlib functions to customize the density of tick marks on your plot:
import matplotlib.pyplot as plt
import numpy as np

# Create data
x = np.linspace(0, 10, 100)
y = np.sin(x)

fig, ax = plt.subplots()
ax.plot(x, y)

# Get current tick locations
current_ticks = ax.xaxis.get_ticklocs()

# Increase tick density
new_ticks = np.linspace(current_ticks[0], current_ticks[-1], len(current_ticks) * 2)

ax.set_xticks(new_ticks)

plt.title("Customized Tick Density - how2matplotlib.com")
plt.show()
Output:
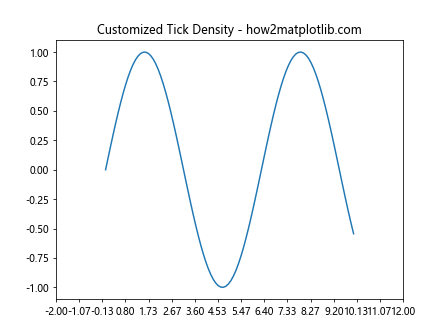
In this example, we use Matplotlib.axis.Axis.get_ticklocs() to retrieve the current tick locations and then create a new set of ticks with double the density. This technique allows you to fine-tune the level of detail on your plot’s axes.
7. Aligning Multiple Subplots
When creating multiple subplots, Matplotlib.axis.Axis.get_ticklocs() can help ensure that tick marks align across different plots:
import matplotlib.pyplot as plt
import numpy as np

# Create data
x = np.linspace(0, 10, 100)
y1 = np.sin(x)
y2 = np.cos(x)

fig, (ax1, ax2) = plt.subplots(2, 1, sharex=True)

ax1.plot(x, y1)
ax2.plot(x, y2)

# Get tick locations from the first subplot
x_ticks = ax1.xaxis.get_ticklocs()

# Apply the same tick locations to the second subplot
ax2.set_xticks(x_ticks)

plt.title("Aligned Subplots using get_ticklocs() - how2matplotlib.com")
plt.tight_layout()
plt.show()
Output:
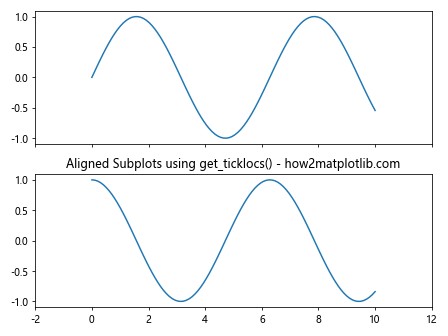
In this example, we create two subplots and use Matplotlib.axis.Axis.get_ticklocs() to retrieve the tick locations from the first subplot. We then apply these same locations to the second subplot, ensuring perfect alignment between the two.
8. Creating Custom Tick Formatters
The Matplotlib.axis.Axis.get_ticklocs() function can be used in combination with custom tick formatters to create more informative axis labels:
import matplotlib.pyplot as plt
import numpy as np

# Create data
x = np.linspace(0, 10, 100)
y = np.sin(x)

fig, ax = plt.subplots()
ax.plot(x, y)

# Get tick locations
x_ticks = ax.xaxis.get_ticklocs()

# Create a custom formatter function
def custom_formatter(x, pos):
    return f"Value: {x:.2f}"

# Apply the custom formatter
ax.xaxis.set_major_formatter(plt.FuncFormatter(custom_formatter))

plt.title("Custom Tick Formatter with get_ticklocs() - how2matplotlib.com")
plt.show()
Output:
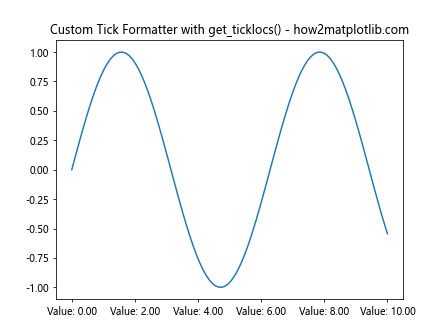
In this example, we use Matplotlib.axis.Axis.get_ticklocs() to retrieve the x-axis tick locations and then create a custom formatter function that adds a “Value:” prefix to each tick label. This technique allows for more descriptive and context-specific axis labels.
9. Adjusting Tick Positions
Sometimes you may want to adjust the positions of tick marks slightly. The Matplotlib.axis.Axis.get_ticklocs() function can help with this:
import matplotlib.pyplot as plt
import numpy as np

# Create data
x = np.linspace(0, 10, 100)
y = np.sin(x)

fig, ax = plt.subplots()
ax.plot(x, y)

# Get current tick locations
current_ticks = ax.xaxis.get_ticklocs()

# Adjust tick positions
adjusted_ticks = current_ticks + 0.5

ax.set_xticks(adjusted_ticks)

plt.title("Adjusted Tick Positions - how2matplotlib.com")
plt.show()
Output:
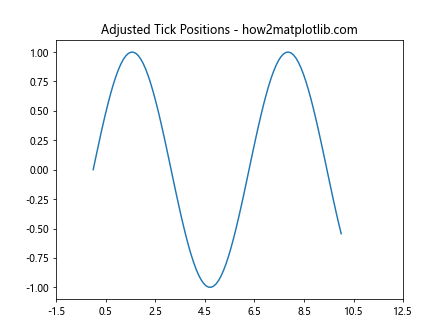
In this example, we use Matplotlib.axis.Axis.get_ticklocs() to retrieve the current tick locations and then shift them by 0.5 units. This can be useful when you want to fine-tune the placement of tick marks on your plot.
10. Creating Custom Tick Locators
The Matplotlib.axis.Axis.get_ticklocs() function can be used in conjunction with custom tick locators to create more complex tick placement schemes:
import matplotlib.pyplot as plt
import numpy as np
from matplotlib.ticker import FixedLocator

# Create data
x = np.linspace(0, 10, 100)
y = np.sin(x)

fig, ax = plt.subplots()
ax.plot(x, y)

# Get current tick locations
current_ticks = ax.xaxis.get_ticklocs()

# Create a custom locator that places ticks at multiples of pi
class PiLocator(FixedLocator):
    def __init__(self, frac=1., nbins=None):
        self.frac = frac
        self.nbins = nbins

    def __call__(self):
        vmin, vmax = self.axis.get_view_interval()
        return np.arange(np.ceil(vmin / (np.pi * self.frac)),
                         np.floor(vmax / (np.pi * self.frac)) + 1) * np.pi * self.frac

# Apply the custom locator
ax.xaxis.set_major_locator(PiLocator(frac=0.5))

# Format tick labels to show multiples of pi
ax.xaxis.set_major_formatter(plt.FuncFormatter(lambda val, pos: f'{val/np.pi:.1f}π'))

plt.title("Custom Tick Locator with get_ticklocs() - how2matplotlib.com")
plt.show()
Output:
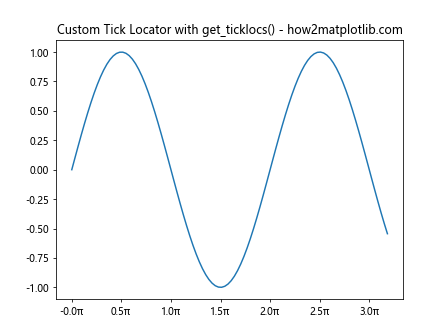
In this example, we create a custom tick locator that places ticks at multiples of π. We use Matplotlib.axis.Axis.get_ticklocs() to understand the current tick placement and then apply our custom locator to create a more mathematically meaningful x-axis.
Advanced Techniques with Matplotlib.axis.Axis.get_ticklocs()
Now that we’ve covered the basics and some common applications, let’s explore some more advanced techniques using the Matplotlib.axis.Axis.get_ticklocs() function.
1. Dynamic Tick Adjustment Based on Data Range
You can use Matplotlib.axis.Axis.get_ticklocs() to dynamically adjust the number of ticks based on the range of your data:
import matplotlib.pyplot as plt
import numpy as np

def adjust_ticks(ax, num_ticks):
    current_ticks = ax.xaxis.get_ticklocs()
    data_range = ax.get_xlim()[1] - ax.get_xlim()[0]
    tick_spacing = data_range / (num_ticks - 1)
    new_ticks = np.arange(ax.get_xlim()[0], ax.get_xlim()[1] + tick_spacing, tick_spacing)
    ax.set_xticks(new_ticks)

# Create data
x = np.linspace(0, 10, 100)
y = np.sin(x)

fig, ax = plt.subplots()
ax.plot(x, y)

# Adjust ticks to show 6 evenly spaced ticks
adjust_ticks(ax, 6)

plt.title("Dynamic Tick Adjustment - how2matplotlib.com")
plt.show()
Output:
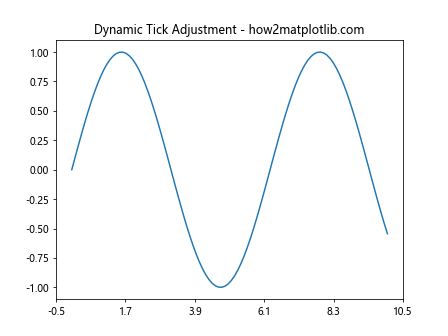
This example demonstrates how to use Matplotlib.axis.Axis.get_ticklocs() in a function that dynamically adjusts the number of ticks based on a desired count, ensuring even spacing across the data range.
2. Creating a Dual-Scale Axis
You can use Matplotlib.axis.Axis.get_ticklocs() to create a dual-scale axis, where the same data is represented on two different scales:
import matplotlib.pyplot as plt
import numpy as np

# Create data
x = np.linspace(0, 10, 100)
y = np.exp(x)

fig, ax1 = plt.subplots()

# Plot on primary y-axis
ax1.plot(x, y, 'b-')
ax1.set_ylabel('Exponential Scale', color='b')

# Create secondary y-axis
ax2 = ax1.twinx()
ax2.plot(x, y, 'r-')
ax2.set_yscale('log')
ax2.set_ylabel('Logarithmic Scale', color='r')

# Get tick locations from primary axis
primary_ticks = ax1.yaxis.get_ticklocs()

# Create custom tick locations for secondary axis
secondary_ticks = np.logspace(np.log10(primary_ticks[0]), np.log10(primary_ticks[-1]), len(primary_ticks))

ax2.set_yticks(secondary_ticks)

plt.title("Dual-Scale Axis using get_ticklocs() - how2matplotlib.com")
plt.show()
In this example, we use Matplotlib.axis.Axis.get_ticklocs() to retrieve the tick locations from the primary y-axis and then create corresponding logarithmic tick locations for the secondary y-axis.
3. Creating a Broken Axis
The Matplotlib.axis.Axis.get_ticklocs() function can be useful when creating a broken axis to represent discontinuous data ranges:
import matplotlib.pyplot as plt
import numpy as np

# Create data
x = np.linspace(0, 10, 100)
y1 = np.sin(x)
y2 = np.exp(x) + 10

fig, (ax1, ax2) = plt.subplots(2, 1, sharex=True)
fig.subplots_adjust(hspace=0.05)

# Plot data on both axes
ax1.plot(x, y2)
ax2.plot(x, y1)

# Break the y-axis
ax1.set_ylim(10, 25000)
ax2.set_ylim(-1.5, 1.5)

# Hide the spines between ax1 and ax2
ax1.spines['bottom'].set_visible(False)
ax2.spines['top'].set_visible(False)
ax1.xaxis.tick_top()
ax1.tick_params(labeltop=False)
ax2.xaxis.tick_bottom()

# Get tick locations
x_ticks = ax2.xaxis.get_ticklocs()

# Add diagonal lines to indicate the break
d = .015
kwargs = dict(transform=ax1.transAxes, color='k', clip_on=False)
ax1.plot((-d, +d), (-d, +d), **kwargs)
ax1.plot((1-d, 1+d), (-d, +d), **kwargs)

kwargs.update(transform=ax2.transAxes)
ax2.plot((-d, +d), (1-d, 1+d), **kwargs)
ax2.plot((1-d, 1+d), (1-d, 1+d), **kwargs)

plt.title("Broken Axis using get_ticklocs() - how2matplotlib.com")
plt.show()
Output:
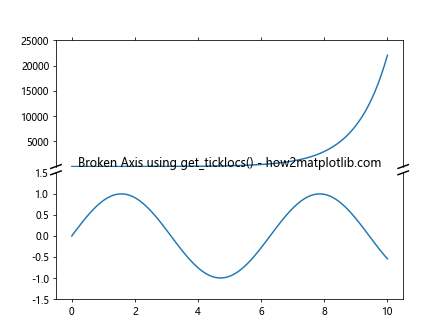
In this example, we use Matplotlib.axis.Axis.get_ticklocs() to ensure that the x-axis ticks are consistent across both parts of the broken axis plot.
4. Creating a Circular Plot
The Matplotlib.axis.Axis.get_ticklocs() function can be helpful when creating circular or polar plots:
import matplotlib.pyplot as plt
import numpy as np

# Create data
theta = np.linspace(0, 2*np.pi, 100)
r = np.sin(5*theta)

fig, ax = plt.subplots(subplot_kw=dict(projection='polar'))
ax.plot(theta, r)

# Get tick locations
theta_ticks = ax.xaxis.get_ticklocs()

# Customize theta tick labels
ax.set_xticks(theta_ticks)
ax.set_xticklabels([f'{t/np.pi:.1f}π' for t in theta_ticks])

plt.title("Circular Plot with Custom Ticks - how2matplotlib.com")
plt.show()
Output:
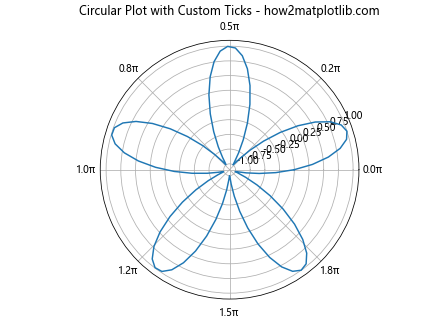
In this example, we use Matplotlib.axis.Axis.get_ticklocs() to retrieve the angular tick locations in a polar plot and then customize the tick labels to display multiples of π.
5. Creating a Heatmap with Custom Tick Locations
The Matplotlib.axis.Axis.get_ticklocs() function can be useful when creating heatmaps with custom tick placements:
import matplotlib.pyplot as plt
import numpy as np

# Create data
data = np.random.rand(10, 10)

fig, ax = plt.subplots()
im = ax.imshow(data, cmap='viridis')

# Get current tick locations
x_ticks = ax.xaxis.get_ticklocs()
y_ticks = ax.yaxis.get_ticklocs()

# Create custom tick labels
x_labels = [f'X{i}' for i in range(len(x_ticks))]
y_labels = [f'Y{i}' for i in range(len(y_ticks))]

ax.set_xticks(x_ticks)
ax.set_yticks(y_ticks)
ax.set_xticklabels(x_labels)
ax.set_yticklabels(y_labels)

plt.colorbar(im)
plt.title("Heatmap with Custom Ticks - how2matplotlib.com")
plt.show()
Output:
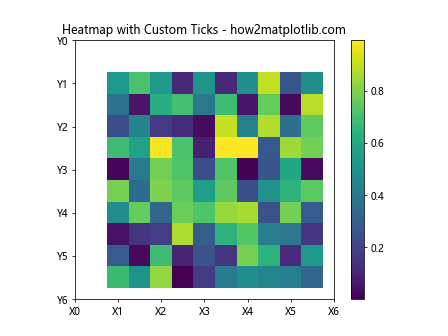
In this example, we use Matplotlib.axis.Axis.get_ticklocs() to retrieve the current tick locations for both x and y axes in a heatmap, and then create custom labels for these ticks.
Best Practices and Tips for Using Matplotlib.axis.Axis.get_ticklocs()
When working with the Matplotlib.axis.Axis.get_ticklocs() function, keep the following best practices and tips in mind:
- Always check the return value: The function returns an array of tick locations. Make sure to print or inspect this array to understand the current tick placement before making any modifications.
Use in combination with other Matplotlib functions: Matplotlib.axis.Axis.get_ticklocs() is most powerful when used in conjunction with other Matplotlib functions like set_xticks(), set_xticklabels(), and custom formatters or locators.
Be mindful of scale: If you’re working with logarithmic or other non-linear scales, remember that the tick locations returned by Matplotlib.axis.Axis.get_ticklocs() will be in the transformed scale.
Consider data range: When adjusting tick locations, always consider the range of your data to ensure that your new tick placements make sense and provide meaningful information.
Use for consistency: When creating multiple plots or subplots, use Matplotlib.axis.Axis.get_ticklocs() to ensure consistency in tick placement across different axes.
Experiment with minor ticks: Don’t forget about the minor parameter of Matplotlib.axis.Axis.get_ticklocs(). Minor ticks can add additional detail to your plots when used appropriately.
Combine with custom locators and formatters: For advanced tick customization, consider using Matplotlib.axis.Axis.get_ticklocs() in combination with custom tick locators and formatters.
Conclusion
The Matplotlib.axis.Axis.get_ticklocs() function is a powerful tool in the Matplotlib library that allows for fine-grained control over tick placement and customization in your plots. By understanding how to use this function effectively, you can create more informative, visually appealing, and customized data visualizations. From basic usage to advanced techniques, we’ve explored a wide range of applications for Matplotlib.axis.Axis.get_ticklocs(). Whether you’re adjusting tick density, creating custom labels, aligning multiple plots, or developing complex visualization schemes, this function provides the flexibility and control you need to perfect your plots.