Comprehensive Guide to Matplotlib.axis.Axis.grid() Function in Python
Matplotlib.axis.Axis.grid() function in Python is a powerful tool for adding grid lines to your plots. This function is an essential part of the Matplotlib library, which is widely used for creating static, animated, and interactive visualizations in Python. The grid() function allows you to customize the appearance of grid lines on either the x-axis, y-axis, or both, enhancing the readability and visual appeal of your plots. In this comprehensive guide, we’ll explore the Matplotlib.axis.Axis.grid() function in depth, covering its syntax, parameters, and various use cases with practical examples.
Understanding the Basics of Matplotlib.axis.Axis.grid() Function
The Matplotlib.axis.Axis.grid() function is a method of the Axis class in Matplotlib. It is used to toggle the visibility of grid lines and customize their appearance. This function can be applied to either the x-axis or y-axis of a plot, giving you fine-grained control over the grid’s appearance.
Let’s start with a basic example to demonstrate how to use the Matplotlib.axis.Axis.grid() function:
import matplotlib.pyplot as plt
import numpy as np

x = np.linspace(0, 10, 100)
y = np.sin(x)

plt.plot(x, y, label='sin(x)')
plt.title('Basic Plot with Grid - how2matplotlib.com')
plt.xlabel('X-axis')
plt.ylabel('Y-axis')
plt.legend()

plt.gca().xaxis.grid(True)
plt.gca().yaxis.grid(True)

plt.show()
Output:

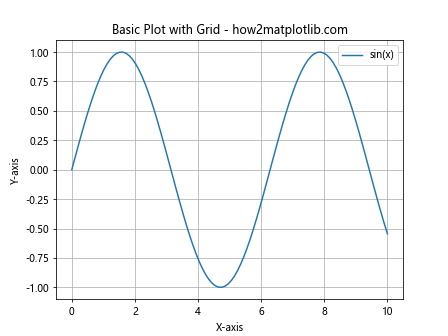
In this example, we create a simple sine wave plot and add grid lines to both the x-axis and y-axis using the Matplotlib.axis.Axis.grid() function. The plt.gca() function gets the current axis, and we apply the grid() method to both the x-axis and y-axis.
Syntax and Parameters of Matplotlib.axis.Axis.grid() Function
The Matplotlib.axis.Axis.grid() function has the following syntax:
Axis.grid(b=None, which='major', axis='both', **kwargs)
Let’s break down the parameters:
b: A boolean value or None. If True, the grid is shown. If False, the grid is hidden. If None, the grid visibility is toggled.which: A string specifying which grid lines to apply the changes to. It can be ‘major’, ‘minor’, or ‘both’.axis: A string specifying which axis the grid should apply to. It can be ‘x’, ‘y’, or ‘both’.**kwargs: Additional keyword arguments to control the appearance of the grid lines.
Now, let’s see an example that demonstrates the use of these parameters: