Comprehensive Guide to Matplotlib.axis.Axis.format_cursor_data() Function in Python
Matplotlib.axis.Axis.format_cursor_data() function in Python is an essential tool for customizing the display of cursor data in Matplotlib plots. This function allows developers to format the data displayed when hovering over points on a plot, providing a more user-friendly and informative experience. In this comprehensive guide, we’ll explore the Matplotlib.axis.Axis.format_cursor_data() function in depth, covering its usage, parameters, and various applications in data visualization.
Understanding the Matplotlib.axis.Axis.format_cursor_data() Function
The Matplotlib.axis.Axis.format_cursor_data() function is a method of the Axis class in Matplotlib. Its primary purpose is to format the data displayed when the cursor hovers over a point on the plot. By default, Matplotlib displays the raw coordinate values, but this function allows you to customize the format of these values.
Let’s start with a simple example to illustrate the basic usage of the Matplotlib.axis.Axis.format_cursor_data() function:
import matplotlib.pyplot as plt
import numpy as np
def format_coord(x, y):
return f'x={x:.2f}, y={y:.2f} (how2matplotlib.com)'
fig, ax = plt.subplots()
ax.plot(np.random.rand(10), np.random.rand(10), 'o')
ax.format_coord = format_coord
plt.title('Basic Matplotlib.axis.Axis.format_cursor_data() Example')
plt.show()
Output:
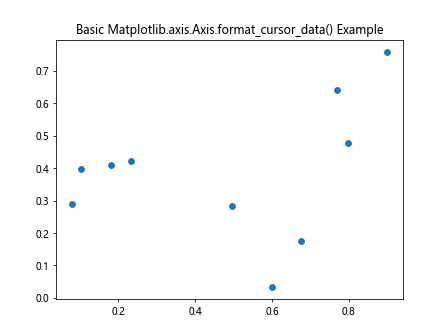
In this example, we define a custom format_coord function that formats the x and y coordinates with two decimal places. We then assign this function to the format_coord attribute of the axis object. This customizes the display of cursor data when hovering over the plot.
Customizing Cursor Data Format with Matplotlib.axis.Axis.format_cursor_data()
The Matplotlib.axis.Axis.format_cursor_data() function provides great flexibility in formatting cursor data. You can customize the display to show additional information, change the number format, or even add custom labels.
Here’s an example that demonstrates more advanced formatting:
import matplotlib.pyplot as plt
import numpy as np
def format_cursor_data(x):
return f'Value: {x:.3f} units (how2matplotlib.com)'
fig, ax = plt.subplots()
x = np.linspace(0, 10, 100)
y = np.sin(x)
line, = ax.plot(x, y)
ax.xaxis.format_cursor_data = format_cursor_data
ax.yaxis.format_cursor_data = format_cursor_data
plt.title('Advanced Matplotlib.axis.Axis.format_cursor_data() Example')
plt.show()
Output:
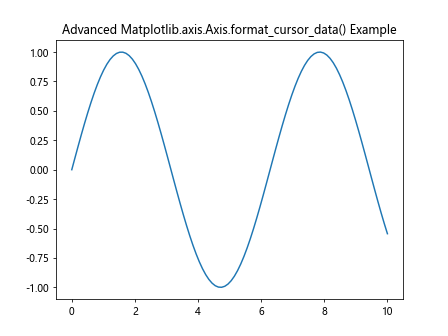
In this example, we define a custom format_cursor_data function that adds the word “units” to the formatted value. We then apply this function to both the x and y axes separately.
Applying Matplotlib.axis.Axis.format_cursor_data() to Different Plot Types
The Matplotlib.axis.Axis.format_cursor_data() function can be applied to various types of plots in Matplotlib. Let’s explore how to use it with different plot types.
Scatter Plots
Scatter plots are commonly used to display the relationship between two variables. Here’s how you can customize the cursor data format for a scatter plot:
import matplotlib.pyplot as plt
import numpy as np
def format_scatter_data(x):
return f'Point: {x:.2f} (how2matplotlib.com)'
fig, ax = plt.subplots()
x = np.random.rand(50)
y = np.random.rand(50)
scatter = ax.scatter(x, y, c=np.random.rand(50), s=500*np.random.rand(50))
ax.xaxis.format_cursor_data = format_scatter_data
ax.yaxis.format_cursor_data = format_scatter_data
plt.title('Scatter Plot with Matplotlib.axis.Axis.format_cursor_data()')
plt.colorbar(scatter)
plt.show()
Output:
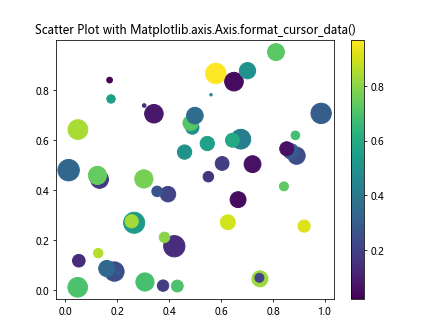
In this example, we create a scatter plot with randomly colored and sized points. The cursor data format is customized to display “Point: ” before the coordinate value.
Bar Charts
Bar charts are useful for comparing quantities across different categories. Here’s how to apply the Matplotlib.axis.Axis.format_cursor_data() function to a bar chart:
import matplotlib.pyplot as plt
import numpy as np
def format_bar_data(x):
return f'Bar height: {x:.1f} (how2matplotlib.com)'
fig, ax = plt.subplots()
categories = ['A', 'B', 'C', 'D', 'E']
values = np.random.randint(1, 100, 5)
bars = ax.bar(categories, values)
ax.yaxis.format_cursor_data = format_bar_data
plt.title('Bar Chart with Matplotlib.axis.Axis.format_cursor_data()')
plt.show()
Output:
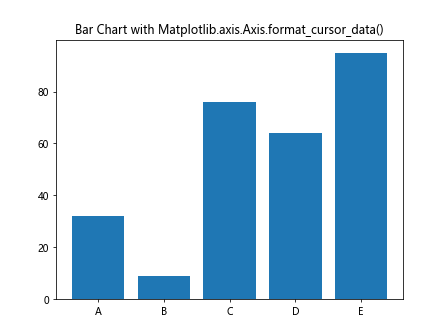
In this bar chart example, we customize the y-axis cursor data to display “Bar height: ” followed by the value with one decimal place.
Line Plots
Line plots are commonly used to show trends over time or other continuous variables. Here’s how to use the Matplotlib.axis.Axis.format_cursor_data() function with a line plot:
import matplotlib.pyplot as plt
import numpy as np
def format_line_data(x):
return f'Data point: {x:.3f} (how2matplotlib.com)'
fig, ax = plt.subplots()
x = np.linspace(0, 10, 100)
y = np.sin(x) * np.exp(-0.1 * x)
line, = ax.plot(x, y)
ax.xaxis.format_cursor_data = format_line_data
ax.yaxis.format_cursor_data = format_line_data
plt.title('Line Plot with Matplotlib.axis.Axis.format_cursor_data()')
plt.show()
Output:
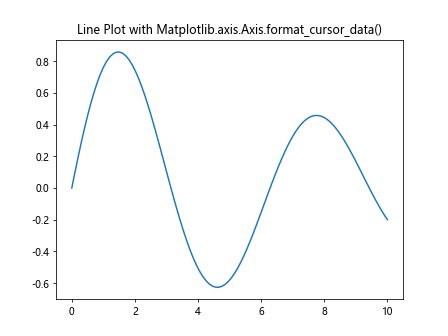
In this line plot example, we format both x and y axis cursor data to display “Data point: ” followed by the value with three decimal places.
Advanced Techniques with Matplotlib.axis.Axis.format_cursor_data()
The Matplotlib.axis.Axis.format_cursor_data() function can be used in more advanced ways to provide even more informative cursor data. Let’s explore some advanced techniques.
Displaying Multiple Data Points
In some cases, you might want to display information about multiple data points when hovering over a plot. Here’s an example that shows how to achieve this:
import matplotlib.pyplot as plt
import numpy as np
def format_multi_data(x):
index = np.argmin(np.abs(x_data - x))
return f'X: {x_data[index]:.2f}, Y1: {y1_data[index]:.2f}, Y2: {y2_data[index]:.2f} (how2matplotlib.com)'
fig, ax = plt.subplots()
x_data = np.linspace(0, 10, 100)
y1_data = np.sin(x_data)
y2_data = np.cos(x_data)
ax.plot(x_data, y1_data, label='sin')
ax.plot(x_data, y2_data, label='cos')
ax.xaxis.format_cursor_data = format_multi_data
plt.title('Multiple Data Points with Matplotlib.axis.Axis.format_cursor_data()')
plt.legend()
plt.show()
Output:
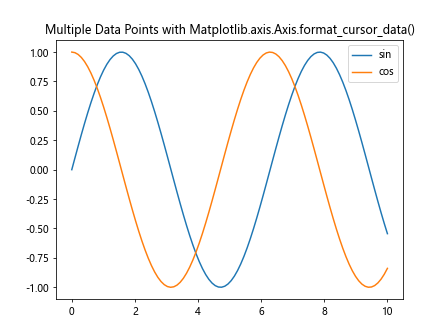
In this example, we plot two lines (sine and cosine) and display the values of both functions for the x-coordinate under the cursor.
Formatting Date Data
When working with time series data, it’s often useful to format the date information in a readable way. Here’s how you can use the Matplotlib.axis.Axis.format_cursor_data() function with date data:
import matplotlib.pyplot as plt
import numpy as np
from datetime import datetime, timedelta
def format_date_data(x):
date = start_date + timedelta(days=int(x))
return f'Date: {date.strftime("%Y-%m-%d")}, Value: {y_data[int(x)]:.2f} (how2matplotlib.com)'
fig, ax = plt.subplots()
start_date = datetime(2023, 1, 1)
dates = [start_date + timedelta(days=i) for i in range(100)]
y_data = np.cumsum(np.random.randn(100))
ax.plot(dates, y_data)
ax.xaxis.format_cursor_data = format_date_data
plt.title('Date Formatting with Matplotlib.axis.Axis.format_cursor_data()')
plt.gcf().autofmt_xdate()
plt.show()
Output:
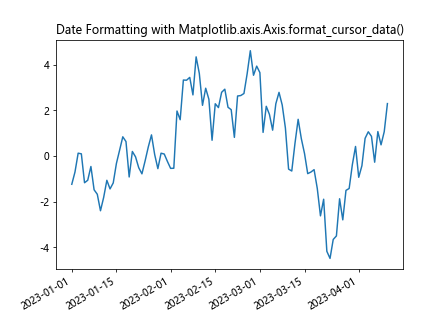
In this example, we create a time series plot and format the x-axis cursor data to display the date in a readable format along with the corresponding y-value.
Combining Matplotlib.axis.Axis.format_cursor_data() with Other Matplotlib Features
The Matplotlib.axis.Axis.format_cursor_data() function can be combined with other Matplotlib features to create more interactive and informative plots. Let’s explore some of these combinations.
Using format_cursor_data() with Subplots
When working with multiple subplots, you can apply different formatting to each subplot’s cursor data. Here’s an example:
import matplotlib.pyplot as plt
import numpy as np
def format_data_1(x):
return f'Subplot 1: {x:.2f} (how2matplotlib.com)'
def format_data_2(x):
return f'Subplot 2: {x:.3f} (how2matplotlib.com)'
fig, (ax1, ax2) = plt.subplots(2, 1, figsize=(8, 8))
x = np.linspace(0, 10, 100)
ax1.plot(x, np.sin(x))
ax2.plot(x, np.cos(x))
ax1.xaxis.format_cursor_data = format_data_1
ax2.xaxis.format_cursor_data = format_data_2
plt.suptitle('Subplots with Matplotlib.axis.Axis.format_cursor_data()')
plt.tight_layout()
plt.show()
Output:
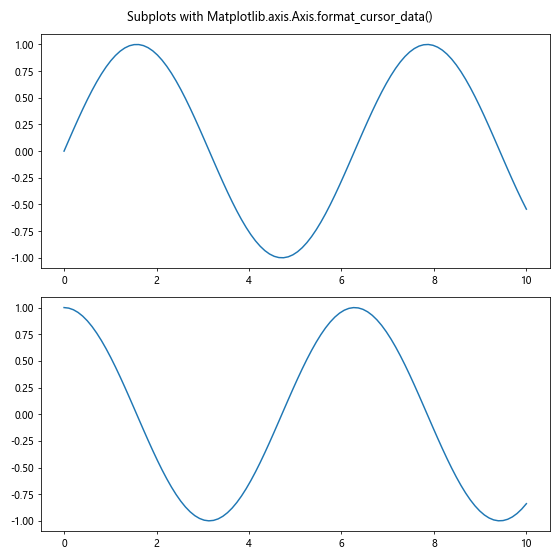
In this example, we create two subplots and apply different formatting to the cursor data of each subplot.
Combining format_cursor_data() with Annotations
You can use the Matplotlib.axis.Axis.format_cursor_data() function in combination with annotations to provide additional context to your plots. Here’s an example:
import matplotlib.pyplot as plt
import numpy as np
def format_annotated_data(x):
index = np.argmin(np.abs(x_data - x))
return f'X: {x_data[index]:.2f}, Y: {y_data[index]:.2f}, Annotation: {annotations[index]} (how2matplotlib.com)'
fig, ax = plt.subplots()
x_data = np.linspace(0, 10, 10)
y_data = np.sin(x_data)
annotations = ['Point ' + str(i) for i in range(10)]
ax.plot(x_data, y_data, 'o-')
for i, (x, y, annot) in enumerate(zip(x_data, y_data, annotations)):
ax.annotate(annot, (x, y), xytext=(5, 5), textcoords='offset points')
ax.xaxis.format_cursor_data = format_annotated_data
plt.title('Annotations with Matplotlib.axis.Axis.format_cursor_data()')
plt.show()
Output:
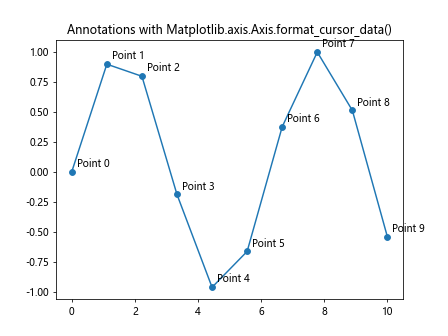
In this example, we create a plot with annotations and include the annotation text in the cursor data format.
Best Practices for Using Matplotlib.axis.Axis.format_cursor_data()
When using the Matplotlib.axis.Axis.format_cursor_data() function, it’s important to follow some best practices to ensure your plots are informative and user-friendly. Here are some tips:
- Keep it concise: While it’s tempting to include a lot of information in the cursor data, try to keep it concise and relevant. Too much information can be overwhelming for users.
-
Use appropriate precision: Format numerical values with an appropriate number of decimal places. Too many decimal places can be distracting, while too few might not provide enough precision.
-
Consider the context: Think about what information would be most useful to users in the context of your plot. For example, in a time series plot, showing the date and value might be more useful than showing raw x and y coordinates.
-
Be consistent: If you’re using the Matplotlib.axis.Axis.format_cursor_data() function across multiple plots in a project, try to maintain a consistent formatting style.
-
Handle edge cases: Make sure your formatting function can handle edge cases, such as NaN values or data points that fall outside the plot range.
Here’s an example that demonstrates these best practices:
import matplotlib.pyplot as plt
import numpy as np
from datetime import datetime, timedelta
def format_cursor_data(x):
index = np.argmin(np.abs(dates - x))
date = dates[index]
value = values[index]
change = changes[index]
if np.isnan(value):
return f'Date: {date:%Y-%m-%d}, Value: N/A (how2matplotlib.com)'
else:
return f'Date: {date:%Y-%m-%d}, Value: {value:.2f}, Change: {change:+.2f}% (how2matplotlib.com)'
fig, ax = plt.subplots(figsize=(10, 6))
dates = [datetime(2023, 1, 1) + timedelta(days=i) for i in range(100)]
values = np.cumsum(np.random.randn(100)) + 100
changes = np.diff(values, prepend=values[0]) / values * 100
ax.plot(dates, values)
ax.xaxis.format_cursor_data = format_cursor_data
plt.title('Best Practices for Matplotlib.axis.Axis.format_cursor_data()')
plt.gcf().autofmt_xdate()
plt.show()
Output:
This example demonstrates a time series plot with cursor data that shows the date, value, and percentage change. It handles NaN values and uses appropriate formatting for dates and numerical values.
Common Pitfalls and How to Avoid Them
When working with the Matplotlib.axis.Axis.format_cursor_data() function, there are some common pitfalls that developers might encounter. Let’s discuss these issues and how to avoid them.
Pitfall 1: Incorrect Data Mapping
One common issue is incorrectly mapping the cursor position to data points, especially when working with discrete data or data with irregular spacing.
Solution: Use numpy’s argmin function to find the nearest data point to the cursor position. Here’s an example:
import matplotlib.pyplot as plt
import numpy as np
def format_cursor_data(x):
index = np.argmin(np.abs(x_data - x))
return f'X: {x_data[index]:.2f}, Y: {y_data[index]:.2f} (how2matplotlib.com)'
fig, ax = plt.subplots()
x_data = np.array([0, 1, 3, 6, 10])
y_data = np.array([2, 4, 1, 5, 3])
ax.plot(x_data, y_data, 'o-')
ax.xaxis.format_cursor_data = format_cursor_data
plt.title('Correct Data Mapping with Matplotlib.axis.Axis.format_cursor_data()')
plt.show()
Output:
This example ensures that the cursor data always corresponds to an actual data point, even when the data is irregularly spaced.
Pitfall 2: Performance Issues with Large Datasets
When working with large datasets, searching for the nearest point in the format_cursor_data function can become slow, leading to a laggy user experience.
Solution: For large datasets, consider using more efficient data structures or algorithms for nearest neighbor search, such as KDTree. Here’s an example:
import matplotlib.pyplot as plt
import numpy as np
from scipy.spatial import cKDTree
def format_cursor_data(x):
distance, index = tree.query([x, 0])
return f'X: {x_data[index]:.2f}, Y: {y_data[index]:.2f} (how2matplotlib.com)'
fig, ax = plt.subplots()
x_data = np.random.rand(10000)
y_data = np.random.rand(10000)
ax.plot(x_data, y_data, 'o', markersize=1)
tree = cKDTree(np.column_stack((x_data, np.zeros_like(x_data))))
ax.xaxis.format_cursor_data = format_cursor_data
plt.title('Efficient Data Mapping with Matplotlib.axis.Axis.format_cursor_data()')
plt.show()
Output:
This example uses a KDTree for efficient nearest neighbor search, which can significantly improve performance for large datasets.
Pitfall 3: Inconsistent Formatting Across Axes
When working with multiple axes or subplots, it’s easy to forget to apply consistent formatting to all axes, leading to a confusing user experience.
Solution: Create a single formatting function and apply it to all relevant axes. Here’s an example:
import matplotlib.pyplot as plt
import numpy as np
def format_cursor_data(x):
return f'Value: {x:.2f} (how2matplotlib.com)'
fig, (ax1, ax2) = plt.subplots(1, 2, figsize=(12, 5))
x = np.linspace(0, 10, 100)
ax1.plot(x, np.sin(x))
ax2.plot(x, np.cos(x))
for ax in [ax1, ax2]:
ax.xaxis.format_cursor_data = format_cursor_data
ax.yaxis.format_cursor_data = format_cursor_data
plt.suptitle('Consistent Formatting with Matplotlib.axis.Axis.format_cursor_data()')
plt.tight_layout()
plt.show()
Output:
This example applies the same formatting function to both x and y axes of both subplots, ensuring a consistent user experience.
Advanced Applications of Matplotlib.axis.Axis.format_cursor_data()
The Matplotlib.axis.Axis.format_cursor_data() function can be used in more advanced ways to create highly interactive and informative plots. Let’s explore some advanced applications.
Interactive Data Exploration
You can use the Matplotlib.axis.Axis.format_cursor_data() function in combination with other interactive features to create tools for data exploration. Here’s an example that combines cursor data formatting with a hover annotation:
import matplotlib.pyplot as plt
import numpy as np
class InteractiveScatter:
def __init__(self, x, y):
self.x = x
self.y = y
self.fig, self.ax = plt.subplots()
self.sc = self.ax.scatter(x, y)
self.annot = self.ax.annotate("", xy=(0,0), xytext=(20,20),
textcoords="offset points",
bbox=dict(boxstyle="round", fc="w"),
arrowprops=dict(arrowstyle="->"))
self.annot.set_visible(False)
self.fig.canvas.mpl_connect("motion_notify_event", self.hover)
def format_cursor_data(self, ind):
return f'X: {self.x[ind]:.2f}, Y: {self.y[ind]:.2f} (how2matplotlib.com)'
def hover(self, event):
vis = self.annot.get_visible()
if event.inaxes == self.ax:
cont, ind = self.sc.contains(event)
if cont:
self.annot.xy = (self.x[ind["ind"][0]], self.y[ind["ind"][0]])
text = self.format_cursor_data(ind["ind"][0])
self.annot.set_text(text)
self.annot.set_visible(True)
self.fig.canvas.draw_idle()
else:
if vis:
self.annot.set_visible(False)
self.fig.canvas.draw_idle()
x = np.random.rand(100)
y = np.random.rand(100)
interactive_scatter = InteractiveScatter(x, y)
plt.title('Interactive Data Exploration with Matplotlib.axis.Axis.format_cursor_data()')
plt.show()
Output:
This example creates an interactive scatter plot where hovering over a point displays its coordinates in a formatted annotation.
Custom Cursor Data for Complex Plots
For more complex plots, you might want to display different information depending on which part of the plot the cursor is over. Here’s an example that demonstrates this:
import matplotlib.pyplot as plt
import numpy as np
def format_cursor_data(x, y):
if y > 0:
return f'Upper half - X: {x:.2f}, Y: {y:.2f} (how2matplotlib.com)'
else:
return f'Lower half - X: {x:.2f}, Y: {y:.2f} (how2matplotlib.com)'
fig, ax = plt.subplots()
x = np.linspace(-5, 5, 100)
y1 = np.sin(x)
y2 = np.cos(x)
ax.plot(x, y1, label='sin')
ax.plot(x, y2, label='cos')
ax.axhline(y=0, color='k', linestyle='--')
def format_coord(x, y):
return format_cursor_data(x, y)
ax.format_coord = format_coord
plt.title('Complex Plot with Custom Matplotlib.axis.Axis.format_cursor_data()')
plt.legend()
plt.show()
Output:
In this example, the cursor data format changes depending on whether the cursor is in the upper or lower half of the plot.
Integrating Matplotlib.axis.Axis.format_cursor_data() with Other Libraries
The Matplotlib.axis.Axis.format_cursor_data() function can be integrated with other Python libraries to create more powerful data visualization tools. Let’s explore some examples.
Integration with Pandas
Pandas is a popular library for data manipulation and analysis. Here’s an example of how to use Matplotlib.axis.Axis.format_cursor_data() with Pandas data:
import matplotlib.pyplot as plt
import pandas as pd
import numpy as np
# Create a sample DataFrame
df = pd.DataFrame({
'Date': pd.date_range(start='2023-01-01', periods=100),
'Value': np.cumsum(np.random.randn(100))
})
def format_cursor_data(x):
date = pd.to_datetime(x, unit='D', origin='2023-01-01')
row = df.loc[df['Date'] == date]
if not row.empty:
return f"Date: {date:%Y-%m-%d}, Value: {row['Value'].values[0]:.2f} (how2matplotlib.com)"
return "No data"
fig, ax = plt.subplots(figsize=(10, 6))
ax.plot(df['Date'], df['Value'])
ax.xaxis.format_cursor_data = format_cursor_data
plt.title('Pandas Integration with Matplotlib.axis.Axis.format_cursor_data()')
plt.gcf().autofmt_xdate()
plt.show()
Output:
This example demonstrates how to format cursor data for a time series plot using data from a Pandas DataFrame.
Integration with Seaborn
Seaborn is a statistical data visualization library built on top of Matplotlib. Here’s how you can use Matplotlib.axis.Axis.format_cursor_data() with Seaborn plots:
import matplotlib.pyplot as plt
import seaborn as sns
import numpy as np
def format_cursor_data(x):
return f"Value: {x:.2f} (how2matplotlib.com)"
sns.set_theme(style="whitegrid")
tips = sns.load_dataset("tips")
fig, ax = plt.subplots(figsize=(10, 6))
sns.boxplot(x="day", y="total_bill", data=tips, ax=ax)
ax.yaxis.format_cursor_data = format_cursor_data
plt.title('Seaborn Integration with Matplotlib.axis.Axis.format_cursor_data()')
plt.show()
Output:
This example shows how to apply custom cursor data formatting to a Seaborn boxplot.
Troubleshooting Common Issues with Matplotlib.axis.Axis.format_cursor_data()
When working with the Matplotlib.axis.Axis.format_cursor_data() function, you might encounter some issues. Here are some common problems and their solutions:
Issue 1: Cursor Data Not Updating
If you find that the cursor data is not updating as you move the mouse over the plot, it might be because the formatting function is not being called.
Solution: Make sure you’ve assigned the formatting function correctly. Here’s an example of the correct way to do it:
import matplotlib.pyplot as plt
import numpy as np
def format_cursor_data(x):
return f"X: {x:.2f} (how2matplotlib.com)"
fig, ax = plt.subplots()
x = np.linspace(0, 10, 100)
y = np.sin(x)
ax.plot(x, y)
ax.xaxis.format_cursor_data = format_cursor_data
plt.title('Correct Cursor Data Updating with Matplotlib.axis.Axis.format_cursor_data()')
plt.show()
Output:
Issue 2: Formatting Applied to Wrong Axis
Sometimes, you might find that the formatting is applied to the wrong axis.
Solution: Double-check which axis you’re applying the formatting to. Remember that ax.xaxis
refers to the x-axis and ax.yaxis
refers to the y-axis. Here’s an example:
import matplotlib.pyplot as plt
import numpy as np
def format_x_data(x):
return f"X: {x:.2f} (how2matplotlib.com)"
def format_y_data(y):
return f"Y: {y:.2f} (how2matplotlib.com)"
fig, ax = plt.subplots()
x = np.linspace(0, 10, 100)
y = np.sin(x)
ax.plot(x, y)
ax.xaxis.format_cursor_data = format_x_data
ax.yaxis.format_cursor_data = format_y_data
plt.title('Correct Axis Formatting with Matplotlib.axis.Axis.format_cursor_data()')
plt.show()
Output:
Issue 3: Formatting Not Working with Certain Plot Types
Some plot types might not work well with the default implementation of format_cursor_data.
Solution: For these cases, you might need to use the more general ax.format_coord
method. Here’s an example with a contour plot:
import matplotlib.pyplot as plt
import numpy as np
def format_coord(x, y):
return f'X: {x:.2f}, Y: {y:.2f}, Z: {z[int(y), int(x)]:.2f} (how2matplotlib.com)'
fig, ax = plt.subplots()
x = np.linspace(-3, 3, 100)
y = np.linspace(-3, 3, 100)
X, Y = np.meshgrid(x, y)
Z = np.sin(X) * np.cos(Y)
z = ax.contourf(X, Y, Z)
ax.format_coord = format_coord
plt.title('Contour Plot with Matplotlib.axis.Axis.format_cursor_data()')
plt.colorbar(z)
plt.show()
Output:
This example shows how to format cursor data for a contour plot, which requires accessing the Z values directly.
Conclusion
The Matplotlib.axis.Axis.format_cursor_data() function is a powerful tool for enhancing the interactivity and informativeness of your Matplotlib plots. By customizing the display of cursor data, you can provide users with more relevant and easily interpretable information as they explore your visualizations.
Throughout this comprehensive guide, we’ve covered the basics of using Matplotlib.axis.Axis.format_cursor_data(), explored advanced techniques, discussed best practices, and looked at ways to integrate this function with other libraries and complex plot types. We’ve also addressed common pitfalls and troubleshooting issues that you might encounter when working with this function.