Comprehensive Guide to Matplotlib.axis.Axis.findobj() Function in Python
Matplotlib.axis.Axis.findobj() function in Python is a powerful tool for locating and manipulating objects within Matplotlib plots. This function is part of the Matplotlib library, which is widely used for creating static, animated, and interactive visualizations in Python. The findobj() method allows users to search for and retrieve specific objects within an Axis instance, making it easier to modify plot elements after they have been created. In this comprehensive guide, we will explore the Matplotlib.axis.Axis.findobj() function in detail, covering its syntax, parameters, return values, and various use cases with practical examples.
Understanding the Basics of Matplotlib.axis.Axis.findobj() Function
The Matplotlib.axis.Axis.findobj() function is a method of the Axis class in Matplotlib. It is used to find objects that match certain criteria within an Axis instance. This function is particularly useful when you need to locate specific elements of a plot, such as lines, text, or other artists, for further manipulation or customization.
The basic syntax of the Matplotlib.axis.Axis.findobj() function is as follows:
Axis.findobj(match=None, include_self=True)
Let’s break down the parameters:
match: This parameter can be None, a callable function, or a class. It determines the criteria for matching objects.include_self: A boolean value that specifies whether to include the Axis instance itself in the search.
The Matplotlib.axis.Axis.findobj() function returns a list of objects that match the specified criteria.
Simple Example of Using Matplotlib.axis.Axis.findobj()
To get started with the Matplotlib.axis.Axis.findobj() function, let’s look at a simple example:
import matplotlib.pyplot as plt

# Create a plot
fig, ax = plt.subplots()
ax.plot([1, 2, 3, 4], [1, 4, 2, 3], label='how2matplotlib.com')
ax.set_title('Simple Plot')

# Find all Line2D objects in the Axis
lines = ax.findobj(plt.Line2D)

# Print the number of Line2D objects found
print(f"Number of Line2D objects found: {len(lines)}")

plt.show()
Output:
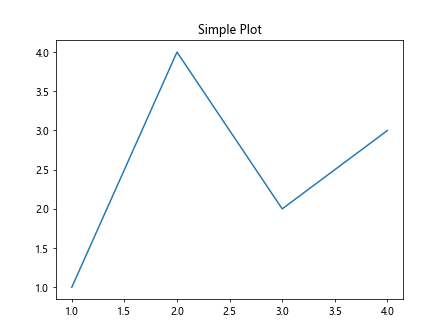
In this example, we create a simple plot using Matplotlib and then use the findobj() function to locate all Line2D objects within the Axis. The function returns a list of matching objects, which we can then use for further manipulation or analysis.
Advanced Usage of Matplotlib.axis.Axis.findobj() Function
The Matplotlib.axis.Axis.findobj() function becomes even more powerful when used with custom matching criteria. You can pass a callable function as the match parameter to define specific conditions for object selection.
Here’s an example that demonstrates how to use a custom matching function:
import matplotlib.pyplot as plt

def custom_match(obj):
    return isinstance(obj, plt.Text) and 'how2matplotlib.com' in obj.get_text()

fig, ax = plt.subplots()
ax.plot([1, 2, 3, 4], [1, 4, 2, 3])
ax.set_title('Plot with Custom Text')
ax.text(2, 3, 'Visit how2matplotlib.com for more info')

# Find all Text objects containing 'how2matplotlib.com'
matching_texts = ax.findobj(match=custom_match)

print(f"Number of matching Text objects: {len(matching_texts)}")

plt.show()
Output:
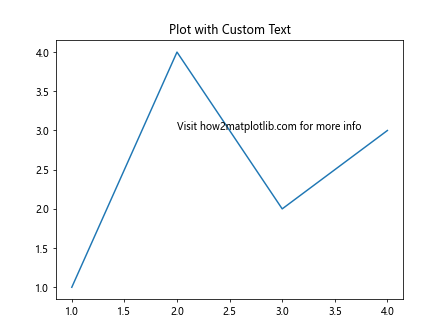
In this example, we define a custom matching function that looks for Text objects containing the string ‘how2matplotlib.com’. The findobj() function then uses this custom criteria to locate matching objects within the Axis.
Practical Applications of Matplotlib.axis.Axis.findobj() Function
The Matplotlib.axis.Axis.findobj() function has numerous practical applications in data visualization and plot customization. Let’s explore some common use cases:
1. Modifying Line Properties
One common use of the findobj() function is to modify the properties of specific lines in a plot after they have been created. Here’s an example:
import matplotlib.pyplot as plt

fig, ax = plt.subplots()
ax.plot([1, 2, 3, 4], [1, 4, 2, 3], label='Line 1')
ax.plot([1, 2, 3, 4], [2, 3, 1, 4], label='Line 2')
ax.set_title('Multiple Lines Plot - how2matplotlib.com')

# Find all Line2D objects
lines = ax.findobj(plt.Line2D)

# Modify the properties of the first line
if lines:
    lines[0].set_linewidth(3)
    lines[0].set_color('red')

plt.legend()
plt.show()
Output:
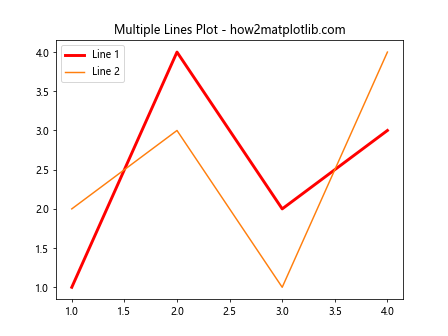
In this example, we use findobj() to locate all Line2D objects and then modify the properties of the first line, making it thicker and changing its color to red.
2. Updating Text Elements
The Matplotlib.axis.Axis.findobj() function is also useful for updating text elements in a plot. Here’s an example that demonstrates how to update the font size of all text elements:
import matplotlib.pyplot as plt

fig, ax = plt.subplots()
ax.plot([1, 2, 3, 4], [1, 4, 2, 3])
ax.set_title('Plot with Text Elements - how2matplotlib.com')
ax.set_xlabel('X-axis')
ax.set_ylabel('Y-axis')
ax.text(2, 3, 'Sample Text')

# Find all Text objects
text_objects = ax.findobj(plt.Text)

# Update font size for all text elements
for text in text_objects:
    text.set_fontsize(14)

plt.show()
Output:
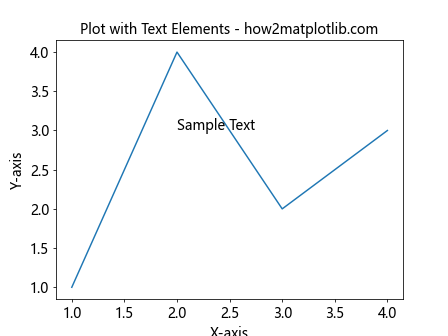
This example uses findobj() to locate all Text objects in the plot and then updates their font size to 14.
3. Removing Specific Elements
The Matplotlib.axis.Axis.findobj() function can also be used to remove specific elements from a plot. Here’s an example that removes all text elements containing a specific string:
import matplotlib.pyplot as plt

fig, ax = plt.subplots()
ax.plot([1, 2, 3, 4], [1, 4, 2, 3])
ax.set_title('Plot with Removable Elements - how2matplotlib.com')
ax.text(1, 4, 'Keep this text')
ax.text(3, 2, 'Remove this text')

def remove_text(obj):
    return isinstance(obj, plt.Text) and 'Remove' in obj.get_text()

# Find and remove text objects containing 'Remove'
for obj in ax.findobj(match=remove_text):
    obj.remove()

plt.show()
Output:
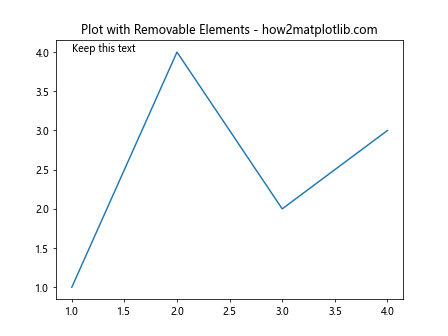
In this example, we use a custom matching function to find Text objects containing the word ‘Remove’ and then remove them from the plot.
Advanced Techniques with Matplotlib.axis.Axis.findobj() Function
As we delve deeper into the capabilities of the Matplotlib.axis.Axis.findobj() function, we can explore more advanced techniques for plot manipulation and customization.
1. Chaining findobj() Calls
You can chain multiple findobj() calls to narrow down your search criteria. Here’s an example:
import matplotlib.pyplot as plt

fig, ax = plt.subplots()
ax.plot([1, 2, 3, 4], [1, 4, 2, 3], color='red', label='Red Line')
ax.plot([1, 2, 3, 4], [2, 1, 3, 4], color='blue', label='Blue Line')
ax.set_title('Chained findobj() Example - how2matplotlib.com')

# Find red lines
red_lines = ax.findobj(plt.Line2D).findobj(lambda x: x.get_color() == 'red')

# Modify red lines
for line in red_lines:
    line.set_linestyle('--')
    line.set_linewidth(3)

plt.legend()
plt.show()
In this example, we first find all Line2D objects, and then further filter to find only the red lines. We then modify these red lines to have a dashed style and increased line width.
2. Using findobj() with Custom Artist Classes
If you’ve created custom artist classes, you can use findobj() to locate instances of these classes in your plots. Here’s an example:
import matplotlib.pyplot as plt
from matplotlib.patches import Circle

class CustomCircle(Circle):
    def __init__(self, *args, **kwargs):
        super().__init__(*args, **kwargs)
        self.set_facecolor('lightblue')

fig, ax = plt.subplots()
ax.add_patch(CustomCircle((0.5, 0.5), 0.2))
ax.add_patch(Circle((0.2, 0.2), 0.1, color='red'))
ax.set_title('Custom Artist Example - how2matplotlib.com')

# Find all CustomCircle instances
custom_circles = ax.findobj(CustomCircle)

# Modify CustomCircle instances
for circle in custom_circles:
    circle.set_edgecolor('darkblue')
    circle.set_linewidth(2)

plt.xlim(0, 1)
plt.ylim(0, 1)
plt.show()
Output:
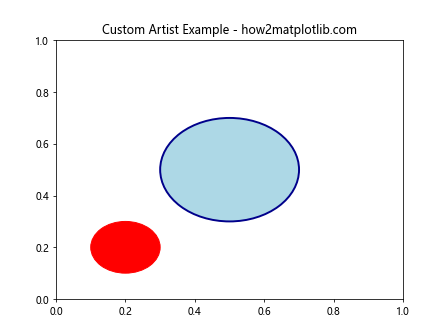
In this example, we define a CustomCircle class and use findobj() to locate instances of this class in the plot. We then modify the edge color and line width of these custom circles.
3. Using findobj() for Dynamic Plot Updates
The Matplotlib.axis.Axis.findobj() function can be particularly useful for creating dynamic plots that update in real-time. Here’s an example that demonstrates this:
import matplotlib.pyplot as plt
import numpy as np
from matplotlib.animation import FuncAnimation

fig, ax = plt.subplots()
line, = ax.plot([], [], label='Dynamic Line - how2matplotlib.com')
ax.set_xlim(0, 10)
ax.set_ylim(-1, 1)

def update(frame):
    x = np.linspace(0, 10, 100)
    y = np.sin(x + frame / 10)
    line.set_data(x, y)

    # Use findobj() to update the line color dynamically
    lines = ax.findobj(plt.Line2D)
    for line in lines:
        line.set_color(plt.cm.viridis(frame / 100))

    return line,

ani = FuncAnimation(fig, update, frames=100, interval=50, blit=True)
plt.legend()
plt.show()
In this example, we create an animated plot where the line color changes dynamically. We use findobj() to locate the Line2D object in each frame and update its color based on the current frame number.
Best Practices for Using Matplotlib.axis.Axis.findobj() Function
When working with the Matplotlib.axis.Axis.findobj() function, it’s important to keep some best practices in mind to ensure efficient and effective use of this powerful tool.
1. Use Specific Matching Criteria
While it’s possible to use findobj() without any matching criteria, it’s generally more efficient to provide specific matching conditions. This helps to narrow down the search and improve performance, especially in complex plots with many objects.
Here’s an example demonstrating this practice:
import matplotlib.pyplot as plt

fig, ax = plt.subplots()
ax.plot([1, 2, 3, 4], [1, 4, 2, 3], label='Line 1')
ax.plot([1, 2, 3, 4], [2, 3, 1, 4], label='Line 2')
ax.set_title('Best Practices Example - how2matplotlib.com')

# Inefficient: Finding all objects and then filtering
all_objects = ax.findobj()
lines = [obj for obj in all_objects if isinstance(obj, plt.Line2D)]

# Efficient: Using specific matching criteria
lines = ax.findobj(plt.Line2D)

# Modify lines
for line in lines:
    line.set_linewidth(2)

plt.legend()
plt.show()
Output:
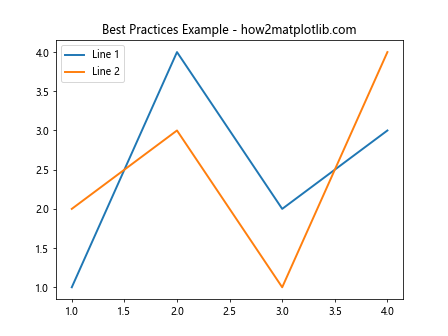
In this example, we demonstrate the difference between finding all objects and then filtering, versus using specific matching criteria directly in the findobj() call.
2. Combine findobj() with Other Matplotlib Methods
The Matplotlib.axis.Axis.findobj() function can be even more powerful when combined with other Matplotlib methods. For example, you can use it in conjunction with set_* methods to efficiently update multiple plot elements.
Here’s an example:
import matplotlib.pyplot as plt

fig, ax = plt.subplots()
ax.plot([1, 2, 3, 4], [1, 4, 2, 3], label='Line 1')
ax.plot([1, 2, 3, 4], [2, 3, 1, 4], label='Line 2')
ax.set_title('Combining Methods Example - how2matplotlib.com')

# Find all lines and update their properties
lines = ax.findobj(plt.Line2D)
plt.setp(lines, linestyle='--', linewidth=2)

# Find all text objects and update their properties
texts = ax.findobj(plt.Text)
plt.setp(texts, fontsize=12, fontweight='bold')

plt.legend()
plt.show()
Output:
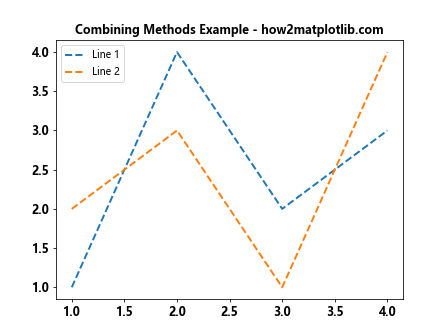
In this example, we use findobj() to locate all Line2D and Text objects, and then use plt.setp() to efficiently update their properties in a single call.
3. Use Type Annotations for Better Code Readability
When working with the Matplotlib.axis.Axis.findobj() function, it can be helpful to use type annotations to improve code readability and maintainability. Here’s an example:
import matplotlib.pyplot as plt
from typing import List

fig, ax = plt.subplots()
ax.plot([1, 2, 3, 4], [1, 4, 2, 3], label='Line 1')
ax.plot([1, 2, 3, 4], [2, 3, 1, 4], label='Line 2')
ax.set_title('Type Annotations Example - how2matplotlib.com')

def update_line_colors(axis: plt.Axes) -> None:
    lines: List[plt.Line2D] = axis.findobj(plt.Line2D)
    for i, line in enumerate(lines):
        line.set_color(plt.cm.viridis(i / len(lines)))

update_line_colors(ax)
plt.legend()
plt.show()
Output:
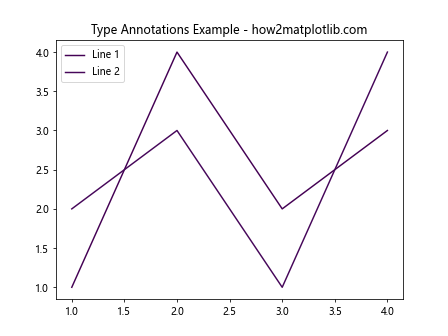
In this example, we use type annotations to clearly indicate that the findobj() function is expected to return a list of Line2D objects. This can help prevent errors and make the code easier to understand and maintain.
Common Pitfalls and How to Avoid Them
While the Matplotlib.axis.Axis.findobj() function is a powerful tool, there are some common pitfalls that users should be aware of:
1. Forgetting to Include Self
By default, the findobj() function includes the Axis object itself in the search results. If you’re only interested in child objects, make sure to set include_self=False:
import matplotlib.pyplot as plt

fig, ax = plt.subplots()
ax.plot([1, 2, 3, 4], [1, 4, 2, 3])
ax.set_title('Avoiding Pitfalls - how2matplotlib.com')

# Incorrect: This will include the Axis object itself
all_objects = ax.findobj()

# Correct: This will only find child objects
child_objects = ax.findobj(include_self=False)

print(f"Number of objects (including self): {len(all_objects)}")
print(f"Number of child objects: {len(child_objects)}")

plt.show()
Output:
This example demonstrates the difference between including and excluding the Axis object itself in the search results.
2. Using Overly Broad Matching Criteria
Using overly broad matching criteria can lead tounexpected results and performance issues. It’s generally better to use more specific criteria when possible. Here’s an example illustrating this pitfall:
import matplotlib.pyplot as plt

fig, ax = plt.subplots()
ax.plot([1, 2, 3, 4], [1, 4, 2, 3], label='Line 1')
ax.plot([1, 2, 3, 4], [2, 3, 1, 4], label='Line 2')
ax.set_title('Specific vs. Broad Criteria - how2matplotlib.com')

# Overly broad: This will find all objects
all_objects = ax.findobj()

# Specific: This will only find Line2D objects
lines = ax.findobj(plt.Line2D)

print(f"Number of all objects: {len(all_objects)}")
print(f"Number of Line2D objects: {len(lines)}")

plt.legend()
plt.show()
Output:
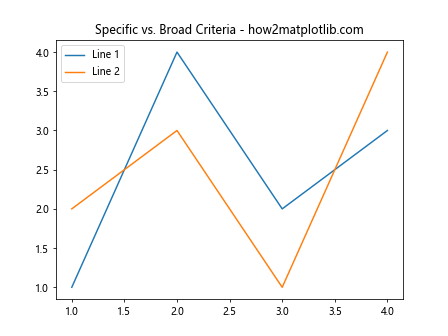
In this example, we show the difference between using overly broad criteria (which finds all objects) and specific criteria (which only finds Line2D objects).
3. Not Handling Empty Results
When using findobj(), it’s important to handle cases where no matching objects are found. Here’s an example of how to do this:
import matplotlib.pyplot as plt

fig, ax = plt.subplots()
ax.plot([1, 2, 3, 4], [1, 4, 2, 3])
ax.set_title('Handling Empty Results - how2matplotlib.com')

# Find objects that don't exist in the plot
non_existent_objects = ax.findobj(plt.Rectangle)

if non_existent_objects:
    print("Found Rectangle objects")
    for obj in non_existent_objects:
        obj.set_facecolor('red')
else:
    print("No Rectangle objects found")

plt.show()
Output:
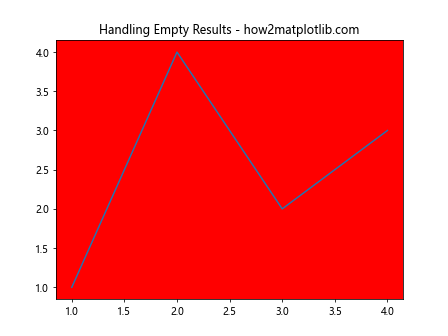
In this example, we search for Rectangle objects, which don’t exist in the plot. We then handle the case where no objects are found, preventing potential errors.
Advanced Applications of Matplotlib.axis.Axis.findobj() Function
The Matplotlib.axis.Axis.findobj() function can be used in more advanced scenarios to create complex and interactive visualizations. Let’s explore some of these applications:
1. Creating Interactive Legends
You can use findobj() to create interactive legends that allow users to toggle the visibility of plot elements. Here’s an example:
import matplotlib.pyplot as plt

fig, ax = plt.subplots()
line1, = ax.plot([1, 2, 3, 4], [1, 4, 2, 3], label='Line 1')
line2, = ax.plot([1, 2, 3, 4], [2, 3, 1, 4], label='Line 2')
ax.set_title('Interactive Legend - how2matplotlib.com')

def on_pick(event):
    legend = event.artist
    isvisible = legend.get_visible()

    lines = ax.findobj(plt.Line2D)
    for line in lines:
        if line.get_label() == legend.get_text():
            line.set_visible(not isvisible)

    legend.set_visible(not isvisible)
    fig.canvas.draw()

leg = plt.legend()
for legline in leg.get_lines():
    legline.set_picker(5)  # 5 points tolerance

fig.canvas.mpl_connect('pick_event', on_pick)
plt.show()
Output:
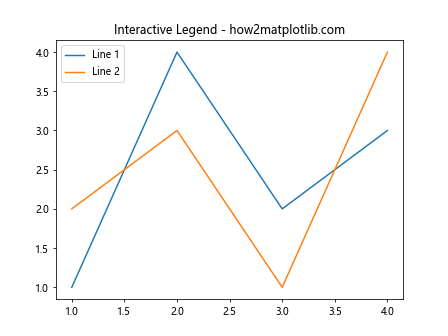
In this example, we use findobj() to locate Line2D objects and toggle their visibility when the corresponding legend item is clicked.
2. Implementing Custom Styling Based on Data
The Matplotlib.axis.Axis.findobj() function can be used to implement custom styling based on data values. Here’s an example that colors data points based on their y-values:
import matplotlib.pyplot as plt
import numpy as np

fig, ax = plt.subplots()
x = np.linspace(0, 10, 100)
y = np.sin(x)
scatter = ax.scatter(x, y)
ax.set_title('Custom Styling Based on Data - how2matplotlib.com')

# Color points based on y-values
points = ax.findobj(plt.PathCollection)
for point in points:
    colors = plt.cm.viridis(y / 2 + 0.5)  # Map y-values to color scale
    point.set_color(colors)

plt.colorbar(scatter)
plt.show()
In this example, we use findobj() to locate the PathCollection object (which represents the scattered points) and then set custom colors based on the y-values of the data.
3. Creating Animated Plots with Dynamic Object Manipulation
The Matplotlib.axis.Axis.findobj() function can be particularly useful in creating animated plots where objects need to be dynamically manipulated. Here’s an example of an animated plot where the color and size of points change over time:
import matplotlib.pyplot as plt
import numpy as np
from matplotlib.animation import FuncAnimation

fig, ax = plt.subplots()
x = np.random.rand(20)
y = np.random.rand(20)
scatter = ax.scatter(x, y)
ax.set_title('Animated Plot with Dynamic Objects - how2matplotlib.com')

def update(frame):
    points = ax.findobj(plt.PathCollection)
    for point in points:
        sizes = 100 + 50 * np.sin(frame / 10 + x * 2 * np.pi)
        colors = plt.cm.viridis(frame / 100 + y)
        point.set_sizes(sizes)
        point.set_color(colors)
    return points

ani = FuncAnimation(fig, update, frames=100, interval=50, blit=True)
plt.show()
In this example, we use findobj() to locate the PathCollection object in each frame of the animation, and then dynamically update the size and color of the points based on the current frame number.
Conclusion: Mastering Matplotlib.axis.Axis.findobj() Function
The Matplotlib.axis.Axis.findobj() function is a powerful tool in the Matplotlib library that allows for precise control and manipulation of plot elements. Throughout this comprehensive guide, we’ve explored various aspects of this function, from basic usage to advanced applications.
We’ve seen how Matplotlib.axis.Axis.findobj() can be used to:
- Locate specific types of objects within a plot
- Apply custom matching criteria to find objects
- Modify properties of multiple objects efficiently
- Create interactive and dynamic visualizations
- Implement advanced styling based on data values
By mastering the Matplotlib.axis.Axis.findobj() function, you can take your data visualization skills to the next level, creating more sophisticated, interactive, and customized plots.