Comprehensive Guide to Matplotlib.axis.Axis.get_label_text() Function in Python
Matplotlib.axis.Axis.get_label_text() function in Python is an essential method for retrieving the text of an axis label in Matplotlib plots. This function is part of the Matplotlib library, which is widely used for creating static, animated, and interactive visualizations in Python. In this comprehensive guide, we’ll explore the Matplotlib.axis.Axis.get_label_text() function in detail, covering its usage, parameters, return values, and practical applications in various plotting scenarios.
Understanding the Matplotlib.axis.Axis.get_label_text() Function
The Matplotlib.axis.Axis.get_label_text() function is a method of the Axis class in Matplotlib. Its primary purpose is to retrieve the text of the label associated with a specific axis. This function is particularly useful when you need to access or manipulate the existing label text programmatically.
Let’s start with a simple example to demonstrate how to use the Matplotlib.axis.Axis.get_label_text() function:
import matplotlib.pyplot as plt

# Create a simple plot
fig, ax = plt.subplots()
ax.plot([1, 2, 3, 4], [1, 4, 2, 3])

# Set the x-axis label
ax.set_xlabel("X-axis label for how2matplotlib.com")

# Get the x-axis label text using get_label_text()
x_label = ax.xaxis.get_label_text()

print(f"X-axis label: {x_label}")

plt.show()
Output:
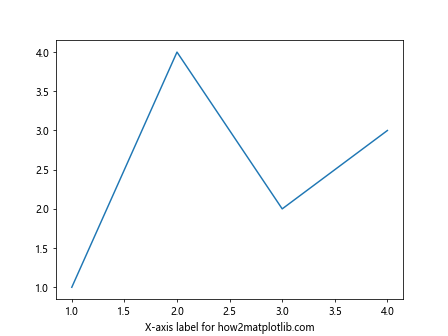
In this example, we create a simple line plot and set the x-axis label using the set_xlabel() method. Then, we use the get_label_text() function to retrieve the label text and print it.
Syntax and Parameters of Matplotlib.axis.Axis.get_label_text()
The Matplotlib.axis.Axis.get_label_text() function has a simple syntax:
Axis.get_label_text()
This function doesn’t take any parameters, making it straightforward to use. It can be called on either the x-axis or y-axis of a Matplotlib plot.
Return Value of Matplotlib.axis.Axis.get_label_text()
The Matplotlib.axis.Axis.get_label_text() function returns a string containing the text of the axis label. If no label has been set, it returns an empty string.
Let’s look at an example that demonstrates the return value:
import matplotlib.pyplot as plt

fig, ax = plt.subplots()

# Set labels for both axes
ax.set_xlabel("X-axis label for how2matplotlib.com")
ax.set_ylabel("Y-axis label for how2matplotlib.com")

# Get label text for both axes
x_label = ax.xaxis.get_label_text()
y_label = ax.yaxis.get_label_text()

print(f"X-axis label: {x_label}")
print(f"Y-axis label: {y_label}")

# Try to get label text for an axis without a label
ax2 = fig.add_subplot(122)
empty_label = ax2.xaxis.get_label_text()

print(f"Empty label: '{empty_label}'")

plt.show()
Output:
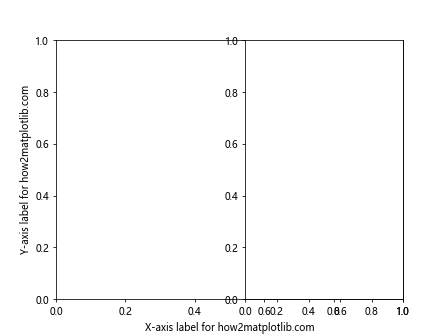
In this example, we set labels for both x and y axes, then retrieve and print them using get_label_text(). We also demonstrate that calling get_label_text() on an axis without a label returns an empty string.
Practical Applications of Matplotlib.axis.Axis.get_label_text()
The Matplotlib.axis.Axis.get_label_text() function has several practical applications in data visualization and plot customization. Let’s explore some common use cases:
1. Modifying Existing Labels
One common use case for the Matplotlib.axis.Axis.get_label_text() function is to modify existing labels. For example, you might want to append additional information to an existing label:
import matplotlib.pyplot as plt

fig, ax = plt.subplots()
ax.plot([1, 2, 3, 4], [1, 4, 2, 3])

# Set initial x-axis label
ax.set_xlabel("Temperature (°C) - how2matplotlib.com")

# Get the current label and modify it
current_label = ax.xaxis.get_label_text()
new_label = current_label + " (Measured at noon)"

# Set the modified label
ax.set_xlabel(new_label)

print(f"Modified label: {ax.xaxis.get_label_text()}")

plt.show()
Output:
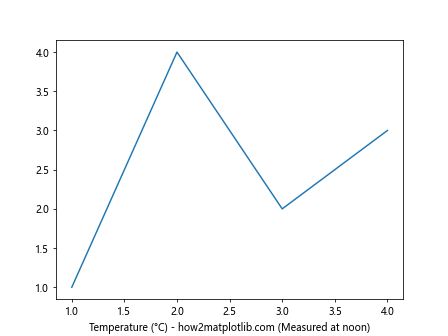
In this example, we retrieve the current x-axis label, append additional information, and then set the modified label back to the axis.
2. Conditional Label Formatting
The Matplotlib.axis.Axis.get_label_text() function can be useful for applying conditional formatting to labels based on their content:
import matplotlib.pyplot as plt

fig, ax = plt.subplots()
ax.plot([1, 2, 3, 4], [1, 4, 2, 3])

# Set initial x-axis label
ax.set_xlabel("Temperature (°C) - how2matplotlib.com")

# Get the current label
current_label = ax.xaxis.get_label_text()

# Apply conditional formatting
if "Temperature" in current_label:
    ax.xaxis.label.set_color("red")
    ax.xaxis.label.set_fontweight("bold")

plt.show()
Output:
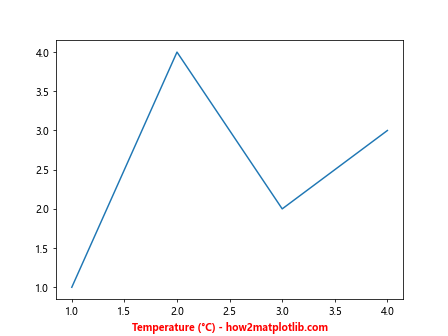
In this example, we check if the word “Temperature” is in the label text and apply special formatting (red color and bold font) if it is.
3. Creating Dynamic Titles
The Matplotlib.axis.Axis.get_label_text() function can be used to create dynamic titles that incorporate information from axis labels:
import matplotlib.pyplot as plt

fig, ax = plt.subplots()
ax.plot([1, 2, 3, 4], [1, 4, 2, 3])

ax.set_xlabel("Time (s) - how2matplotlib.com")
ax.set_ylabel("Voltage (V) - how2matplotlib.com")

# Create a dynamic title using label information
x_label = ax.xaxis.get_label_text()
y_label = ax.yaxis.get_label_text()
plt.title(f"{y_label} vs {x_label}")

plt.show()
Output:
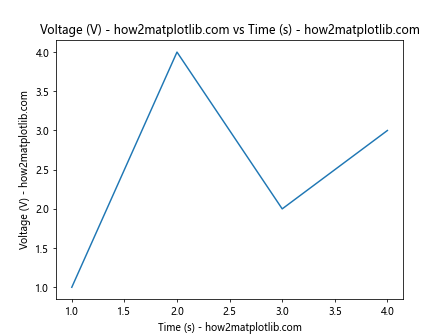
This example demonstrates how to create a title that automatically includes the x and y axis label information.
4. Label Consistency Checks
The Matplotlib.axis.Axis.get_label_text() function can be used to perform consistency checks across multiple subplots:
import matplotlib.pyplot as plt

fig, (ax1, ax2) = plt.subplots(1, 2, figsize=(10, 4))

ax1.plot([1, 2, 3, 4], [1, 4, 2, 3])
ax1.set_xlabel("Time (s) - how2matplotlib.com")
ax1.set_ylabel("Voltage (V) - how2matplotlib.com")

ax2.plot([1, 2, 3, 4], [3, 1, 4, 2])
ax2.set_xlabel("Time (s) - how2matplotlib.com")
ax2.set_ylabel("Current (A) - how2matplotlib.com")

# Check label consistency
if ax1.xaxis.get_label_text() == ax2.xaxis.get_label_text():
    print("X-axis labels are consistent across subplots")
else:
    print("Warning: X-axis labels are inconsistent")

plt.tight_layout()
plt.show()
Output:
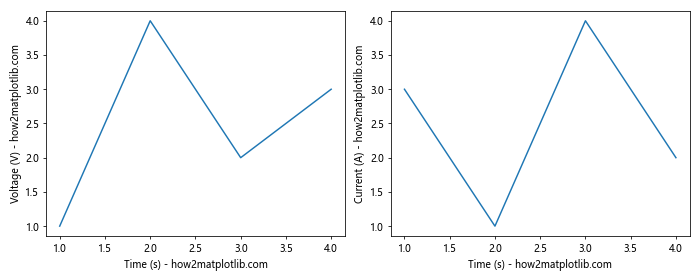
This example shows how to check if the x-axis labels are consistent across two subplots.
Advanced Usage of Matplotlib.axis.Axis.get_label_text()
While the basic usage of Matplotlib.axis.Axis.get_label_text() is straightforward, there are some advanced techniques and considerations to keep in mind:
1. Handling Unicode Characters
The Matplotlib.axis.Axis.get_label_text() function can handle Unicode characters in labels. This is useful for displaying non-ASCII characters, such as Greek letters or mathematical symbols:
import matplotlib.pyplot as plt

fig, ax = plt.subplots()
ax.plot([1, 2, 3, 4], [1, 4, 2, 3])

# Set a label with Unicode characters
ax.set_xlabel("Temperature (°C) - α, β, γ - how2matplotlib.com")

# Get and print the label text
label_text = ax.xaxis.get_label_text()
print(f"Label with Unicode: {label_text}")

plt.show()
Output:
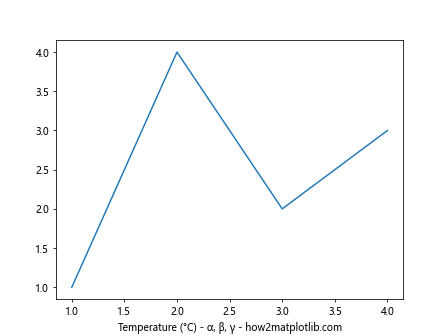
This example demonstrates that get_label_text() correctly retrieves labels containing Unicode characters.
2. Working with LaTeX-formatted Labels
Matplotlib supports LaTeX-formatted labels. The Matplotlib.axis.Axis.get_label_text() function returns the raw LaTeX string, which can be useful for further processing:
import matplotlib.pyplot as plt

plt.rcParams['text.usetex'] = True  # Enable LaTeX rendering

fig, ax = plt.subplots()
ax.plot([1, 2, 3, 4], [1, 4, 2, 3])

# Set a LaTeX-formatted label
ax.set_xlabel(r'$\mathcal{T}$ (K) - $\frac{\partial V}{\partial t}$ - how2matplotlib.com')

# Get and print the raw LaTeX string
latex_label = ax.xaxis.get_label_text()
print(f"LaTeX label: {latex_label}")

plt.show()
In this example, we set a LaTeX-formatted label and use get_label_text() to retrieve the raw LaTeX string.
3. Handling Multi-line Labels
The Matplotlib.axis.Axis.get_label_text() function can handle multi-line labels. It returns the entire label text, including newline characters:
import matplotlib.pyplot as plt

fig, ax = plt.subplots()
ax.plot([1, 2, 3, 4], [1, 4, 2, 3])

# Set a multi-line label
ax.set_xlabel("Temperature (°C)\nMeasured at noon\nhow2matplotlib.com")

# Get and print the multi-line label
multiline_label = ax.xaxis.get_label_text()
print(f"Multi-line label:\n{multiline_label}")

plt.show()
Output:
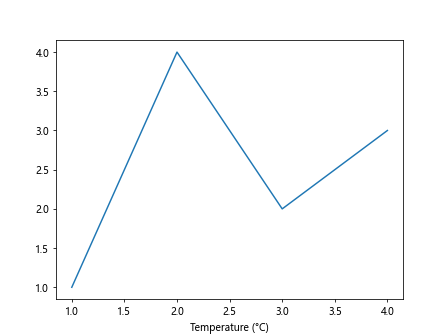
This example shows how get_label_text() handles multi-line labels, preserving the line breaks.
4. Combining with Other Axis Methods
The Matplotlib.axis.Axis.get_label_text() function can be combined with other axis methods for more complex label manipulations:
import matplotlib.pyplot as plt

fig, ax = plt.subplots()
ax.plot([1, 2, 3, 4], [1, 4, 2, 3])

# Set initial label
ax.set_xlabel("Temperature (°C) - how2matplotlib.com")

# Get current label text
current_label = ax.xaxis.get_label_text()

# Modify label properties
ax.xaxis.label.set_style('italic')
ax.xaxis.label.set_color('blue')

# Append to the label
new_label = current_label + "\n(Updated)"
ax.set_xlabel(new_label)

print(f"Final label: {ax.xaxis.get_label_text()}")

plt.show()
Output:
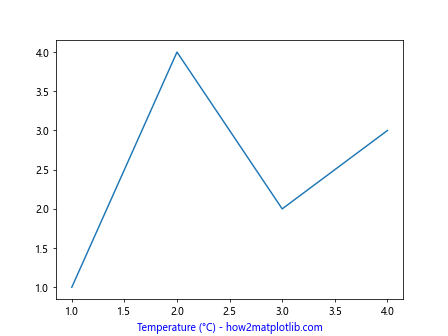
This example demonstrates how to combine get_label_text() with other label manipulation methods to achieve more complex label customizations.
Common Pitfalls and Best Practices
When working with the Matplotlib.axis.Axis.get_label_text() function, there are some common pitfalls to avoid and best practices to follow:
1. Distinguishing between Axis Label and Tick Labels
It’s important to note that get_label_text() retrieves the axis label, not the tick labels. For tick labels, you would use different methods. Here’s an example to illustrate the difference:
import matplotlib.pyplot as plt

fig, ax = plt.subplots()
ax.plot([1, 2, 3, 4], [1, 4, 2, 3])

# Set axis label and tick labels
ax.set_xlabel("X-axis Label - how2matplotlib.com")
ax.set_xticks([1, 2, 3, 4])
ax.set_xticklabels(['A', 'B', 'C', 'D'])

# Get and print axis label
axis_label = ax.xaxis.get_label_text()
print(f"Axis label: {axis_label}")

# Get and print tick labels (different method)
tick_labels = [label.get_text() for label in ax.get_xticklabels()]
print(f"Tick labels: {tick_labels}")

plt.show()
Output:
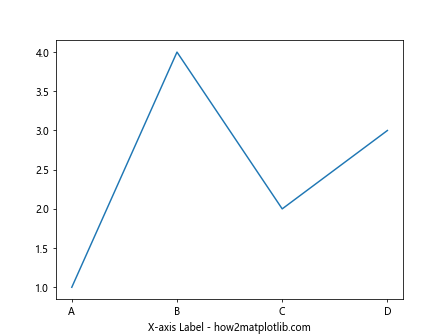
This example shows the difference between retrieving the axis label and tick labels.
2. Handling Missing Labels
When using get_label_text(), it’s a good practice to check if a label exists before performing operations on it:
import matplotlib.pyplot as plt

fig, ax = plt.subplots()
ax.plot([1, 2, 3, 4], [1, 4, 2, 3])

# Try to get label text when no label is set
label_text = ax.xaxis.get_label_text()

if label_text:
    print(f"Label: {label_text}")
else:
    print("No label set")
    ax.set_xlabel("Default Label - how2matplotlib.com")

plt.show()
Output:
This example demonstrates how to handle cases where no label is set, avoiding potential errors in label manipulation.
3. Updating Labels Efficiently
When you need to update labels frequently, it’s more efficient to keep a reference to the label object rather than repeatedly calling get_label_text() and set_xlabel():
import matplotlib.pyplot as plt

fig, ax = plt.subplots()
ax.plot([1, 2, 3, 4], [1, 4, 2, 3])

# Set initial label
ax.set_xlabel("Initial Label - how2matplotlib.com")

# Get label object
label_obj = ax.xaxis.get_label()

# Update label text directly
label_obj.set_text("Updated Label - how2matplotlib.com")

print(f"Final label: {ax.xaxis.get_label_text()}")

plt.show()
Output:
This approach is more efficient for frequent label updates.
Integration with Other Matplotlib Features
The Matplotlib.axis.Axis.get_label_text() function can be integrated with other Matplotlib features to create more complex and informative visualizations. Let’s explore some examples:
1. Combining with Legend
You can use get_label_text() to create dynamic legends that incorporate axis label information:
import matplotlib.pyplot as plt

fig, ax = plt.subplots()

ax.plot([1, 2, 3, 4], [1, 4, 2, 3], label='Series 1')
ax.plot([1, 2, 3, 4], [3, 2, 4, 1], label='Series 2')

ax.set_xlabel("Time (s) - how2matplotlib.com")
ax.set_ylabel("Value - how2matplotlib.com")

# Create a legend title using axis labels
x_label = ax.xaxis.get_label_text()
y_label = ax.yaxis.get_label_text()
ax.legend(title=f"{y_label} vs {x_label}")

plt.show()
Output:
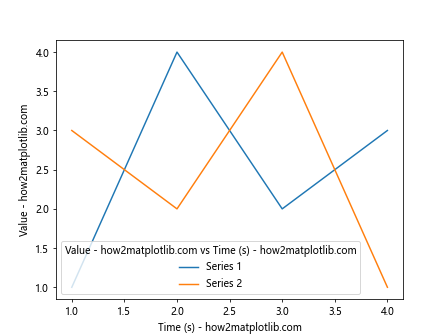
This example uses the axis labels to create a dynamic legend title.
2. Annotating Plots
The get_label_text() function can be useful when adding annotations to your plots:
import matplotlib.pyplot as plt

fig, ax = plt.subplots()

ax.plot([1, 2, 3, 4], [1, 4, 2, 3])
ax.set_xlabel("Time (s) - how2matplotlib.com")
ax.set_ylabel("Voltage (V) - how2matplotlib.com")

# Add annotation using label information
x_label = ax.xaxis.get_label_text()
y_label = ax.yaxis.get_label_text()
ax.annotate(f"Peak {y_label}", xy=(2, 4), xytext=(2.5, 3.5),
            arrowprops=dict(facecolor='black', shrink=0.05))

plt.show()
Output:
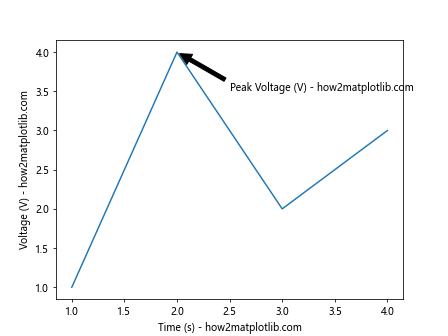
This example demonstrates how to use axis label information in plot annotations.
3. Customizing Colorbar Labels
When working with colorbars, you can use get_label_text() to customize the colorbar label based on the main plot’s axis labels:
import matplotlib.pyplot as plt
import numpy as np

fig, ax = plt.subplots()

# Create a sample 2D plot
data = np.random.rand(10, 10)
im = ax.imshow(data, cmap='viridis')

ax.set_xlabel("X-axis - how2matplotlib.com")
ax.set_ylabel("Y-axis - how2matplotlib.com")

# Create colorbar and set its label based on axis labels
cbar = fig.colorbar(im)
x_label = ax.xaxis.get_label_text()
y_label = ax.yaxis.get_label_text()
cbar.set_label(f"{x_label} vs {y_label} Intensity")

plt.show()
Output:
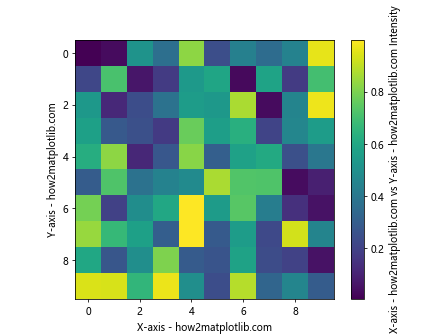
This example shows how to use axis label information to create a meaningful colorbar label.
Performance Considerations
While the Matplotlib.axis.Axis.get_label_text() function is generally fast and efficient, there are some performance considerations to keep in mind when working with large or complex plots:
- Frequent Label Access: If you need to access the label text frequently in a loop or animation, it’s more efficient to store the label text in a variable rather than calling
get_label_text()repeatedly. Large Plots: For plots with a large number of subplots, accessing label text for each subplot might impact performance. In such cases, consider storing label information in a separate data structure.
Memory Usage: The
get_label_text()function returns a string, which is generally lightweight. However, if you’re working with very long labels or a large number of plots, be mindful of memory usage.
Here’s an example demonstrating efficient label handling in a multi-subplot scenario: