Comprehensive Guide to Matplotlib.axis.Axis.get_label_position() Function in Python
Matplotlib.axis.Axis.get_label_position() function in Python is an essential tool for managing axis labels in Matplotlib plots. This function allows you to retrieve the current position of the axis label, which can be crucial for fine-tuning the appearance of your visualizations. In this comprehensive guide, we’ll explore the Matplotlib.axis.Axis.get_label_position() function in depth, covering its usage, parameters, return values, and practical applications.
Understanding the Basics of Matplotlib.axis.Axis.get_label_position()
The Matplotlib.axis.Axis.get_label_position() function is part of the Matplotlib library, specifically within the axis module. It is used to obtain the current position of the axis label for a given axis. This function is particularly useful when you need to know the label’s position before making any adjustments or when you want to ensure consistency across multiple plots.
Let’s start with a simple example to demonstrate how to use the Matplotlib.axis.Axis.get_label_position() function:
import matplotlib.pyplot as plt

# Create a simple plot
fig, ax = plt.subplots()
ax.plot([1, 2, 3, 4], [1, 4, 2, 3])

# Get the x-axis label position
x_label_position = ax.xaxis.get_label_position()
print(f"X-axis label position: {x_label_position}")

# Get the y-axis label position
y_label_position = ax.yaxis.get_label_position()
print(f"Y-axis label position: {y_label_position}")

plt.title("How to use Matplotlib.axis.Axis.get_label_position() - how2matplotlib.com")
plt.show()
Output:
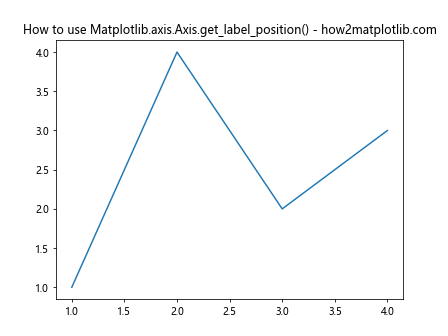
In this example, we create a simple line plot and then use the Matplotlib.axis.Axis.get_label_position() function to retrieve the positions of both the x-axis and y-axis labels. The function is called on the xaxis and yaxis objects of the Axes instance.
Exploring the Return Values of Matplotlib.axis.Axis.get_label_position()
The Matplotlib.axis.Axis.get_label_position() function returns a string that represents the current position of the axis label. The possible return values are:
- ‘bottom’: For x-axis labels positioned below the axis
- ‘top’: For x-axis labels positioned above the axis
- ‘left’: For y-axis labels positioned to the left of the axis
- ‘right’: For y-axis labels positioned to the right of the axis
Let’s create an example that demonstrates how to interpret these return values:
import matplotlib.pyplot as plt

# Create a figure with subplots
fig, ((ax1, ax2), (ax3, ax4)) = plt.subplots(2, 2, figsize=(10, 10))

# Plot 1: Default label positions
ax1.plot([1, 2, 3], [1, 2, 3])
ax1.set_title("Default Label Positions")
print(f"Plot 1 - X-axis: {ax1.xaxis.get_label_position()}, Y-axis: {ax1.yaxis.get_label_position()}")

# Plot 2: X-axis label on top
ax2.plot([1, 2, 3], [1, 2, 3])
ax2.xaxis.set_label_position('top')
ax2.set_title("X-axis Label on Top")
print(f"Plot 2 - X-axis: {ax2.xaxis.get_label_position()}, Y-axis: {ax2.yaxis.get_label_position()}")

# Plot 3: Y-axis label on right
ax3.plot([1, 2, 3], [1, 2, 3])
ax3.yaxis.set_label_position('right')
ax3.set_title("Y-axis Label on Right")
print(f"Plot 3 - X-axis: {ax3.xaxis.get_label_position()}, Y-axis: {ax3.yaxis.get_label_position()}")

# Plot 4: Both labels on opposite sides
ax4.plot([1, 2, 3], [1, 2, 3])
ax4.xaxis.set_label_position('top')
ax4.yaxis.set_label_position('right')
ax4.set_title("Both Labels on Opposite Sides")
print(f"Plot 4 - X-axis: {ax4.xaxis.get_label_position()}, Y-axis: {ax4.yaxis.get_label_position()}")

plt.tight_layout()
plt.suptitle("Matplotlib.axis.Axis.get_label_position() Examples - how2matplotlib.com", fontsize=16)
plt.show()
Output:
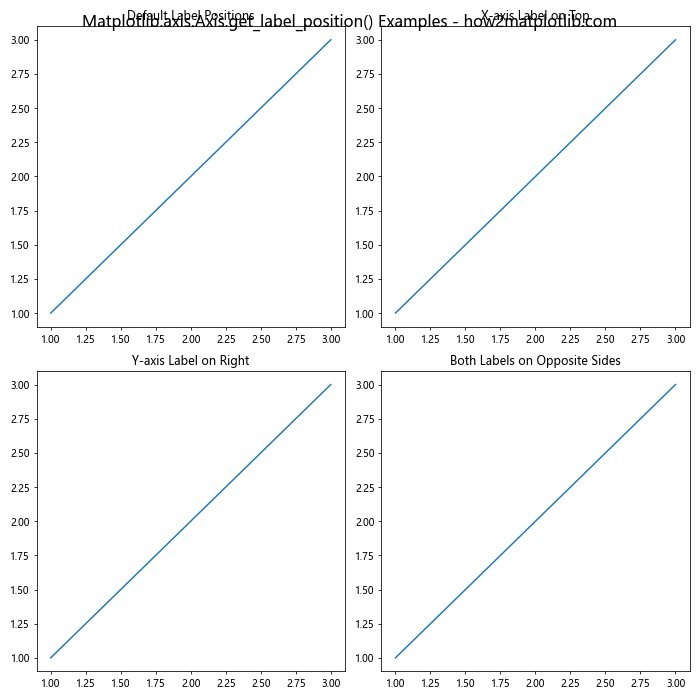
This example creates four subplots with different label positions and demonstrates how the Matplotlib.axis.Axis.get_label_position() function returns the correct position for each case.
Practical Applications of Matplotlib.axis.Axis.get_label_position()
The Matplotlib.axis.Axis.get_label_position() function has several practical applications in data visualization and plot customization. Let’s explore some of these use cases:
1. Conditional Formatting Based on Label Position
You can use the Matplotlib.axis.Axis.get_label_position() function to apply conditional formatting to your plots based on the current label position. Here’s an example:
import matplotlib.pyplot as plt

def format_plot_based_on_label_position(ax):
    x_pos = ax.xaxis.get_label_position()
    y_pos = ax.yaxis.get_label_position()

    if x_pos == 'top':
        ax.xaxis.label.set_color('red')
    else:
        ax.xaxis.label.set_color('blue')

    if y_pos == 'right':
        ax.yaxis.label.set_color('green')
    else:
        ax.yaxis.label.set_color('purple')

# Create a plot
fig, ax = plt.subplots()
ax.plot([1, 2, 3, 4], [1, 4, 2, 3])

# Set label positions
ax.xaxis.set_label_position('top')
ax.yaxis.set_label_position('right')

# Set labels
ax.set_xlabel("X-axis Label")
ax.set_ylabel("Y-axis Label")

# Apply formatting
format_plot_based_on_label_position(ax)

plt.title("Conditional Formatting with get_label_position() - how2matplotlib.com")
plt.show()
Output:
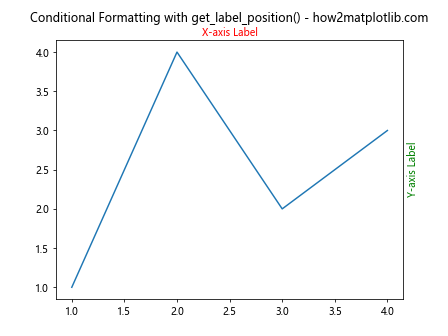
In this example, we define a function that applies different colors to the axis labels based on their positions. The Matplotlib.axis.Axis.get_label_position() function is used to determine the current position of each label.
2. Ensuring Consistent Label Positions Across Multiple Plots
When creating multiple plots, you may want to ensure that all plots have consistent label positions. The Matplotlib.axis.Axis.get_label_position() function can help you achieve this:
import matplotlib.pyplot as plt

def ensure_consistent_label_positions(axes_list):
    reference_ax = axes_list[0]
    x_pos = reference_ax.xaxis.get_label_position()
    y_pos = reference_ax.yaxis.get_label_position()

    for ax in axes_list[1:]:
        ax.xaxis.set_label_position(x_pos)
        ax.yaxis.set_label_position(y_pos)

# Create multiple plots
fig, (ax1, ax2, ax3) = plt.subplots(1, 3, figsize=(15, 5))

# Set label positions for the first plot
ax1.xaxis.set_label_position('top')
ax1.yaxis.set_label_position('right')

# Ensure consistent label positions across all plots
ensure_consistent_label_positions([ax1, ax2, ax3])

# Add some data and labels to each plot
for ax in (ax1, ax2, ax3):
    ax.plot([1, 2, 3, 4], [1, 4, 2, 3])
    ax.set_xlabel("X-axis")
    ax.set_ylabel("Y-axis")

plt.suptitle("Consistent Label Positions with get_label_position() - how2matplotlib.com")
plt.tight_layout()
plt.show()
Output:
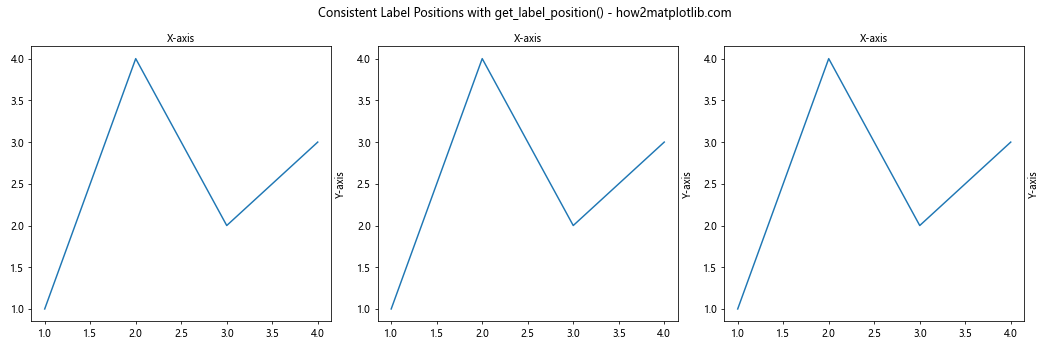
This example demonstrates how to use the Matplotlib.axis.Axis.get_label_position() function to ensure that all subplots have consistent label positions based on the first subplot’s configuration.
Common Pitfalls and Best Practices
When working with the Matplotlib.axis.Axis.get_label_position() function, there are some common pitfalls to avoid and best practices to follow:
1. Checking for Axis Existence
Before using Matplotlib.axis.Axis.get_label_position(), it’s a good practice to ensure that the axis object exists. Here’s an example of how to do this safely:
import matplotlib.pyplot as plt

fig, ax = plt.subplots()

# Safe way to get label position
def safe_get_label_position(axis):
    if axis is not None:
        return axis.get_label_position()
    return None

# Plot some data
ax.plot([1, 2, 3, 4], [1, 4, 2, 3])

# Get label positions safely
x_pos = safe_get_label_position(getattr(ax, 'xaxis', None))
y_pos = safe_get_label_position(getattr(ax, 'yaxis', None))

print(f"X-axis label position: {x_pos}")
print(f"Y-axis label position: {y_pos}")

plt.title("Safe Usage of get_label_position() - how2matplotlib.com")
plt.show()
Output:
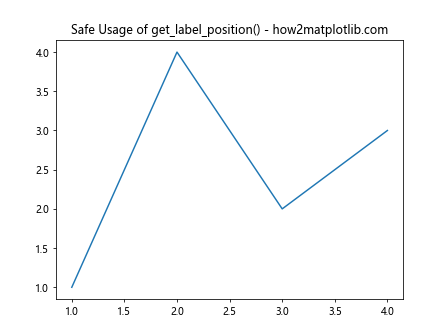
This example demonstrates a safe way to use Matplotlib.axis.Axis.get_label_position() by first checking if the axis object exists.
2. Handling 3D Plots
When working with 3D plots, the Matplotlib.axis.Axis.get_label_position() function behaves differently. Here’s an example that illustrates this:
import matplotlib.pyplot as plt
from mpl_toolkits.mplot3d import Axes3D

fig = plt.figure()
ax = fig.add_subplot(111, projection='3d')

# Plot a simple 3D line
ax.plot([1, 2, 3], [1, 2, 3], [1, 2, 3])

# Try to get label positions
x_pos = ax.xaxis.get_label_position()
y_pos = ax.yaxis.get_label_position()
z_pos = ax.zaxis.get_label_position()

print(f"X-axis label position: {x_pos}")
print(f"Y-axis label position: {y_pos}")
print(f"Z-axis label position: {z_pos}")

ax.set_xlabel("X Label")
ax.set_ylabel("Y Label")
ax.set_zlabel("Z Label")

plt.title("3D Plot and get_label_position() - how2matplotlib.com")
plt.show()
Output:
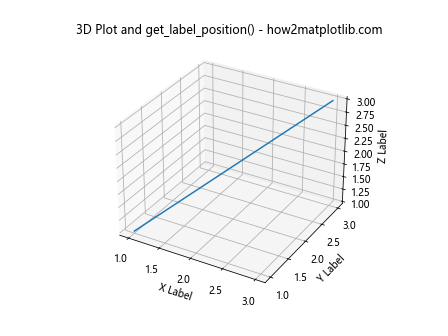
In 3D plots, the Matplotlib.axis.Axis.get_label_position() function may not return the expected values, as the concept of “top”, “bottom”, “left”, and “right” doesn’t directly apply to 3D space.
Integrating get_label_position() with Other Matplotlib Features
The Matplotlib.axis.Axis.get_label_position() function can be integrated with other Matplotlib features to create more complex and informative visualizations. Let’s explore some examples:
1. Using get_label_position() with Twin Axes
When working with twin axes, you can use Matplotlib.axis.Axis.get_label_position() to ensure that labels are positioned correctly:
import matplotlib.pyplot as plt
import numpy as np

# Create data
x = np.linspace(0, 10, 100)
y1 = np.sin(x)
y2 = np.cos(x)

# Create plot with twin axes
fig, ax1 = plt.subplots()
ax2 = ax1.twinx()

# Plot data
ax1.plot(x, y1, 'b-', label='sin(x)')
ax2.plot(x, y2, 'r-', label='cos(x)')

# Set labels
ax1.set_xlabel("X-axis")
ax1.set_ylabel("sin(x)", color='b')
ax2.set_ylabel("cos(x)", color='r')

# Get and print label positions
print(f"X-axis label position: {ax1.xaxis.get_label_position()}")
print(f"Y-axis label position (ax1): {ax1.yaxis.get_label_position()}")
print(f"Y-axis label position (ax2): {ax2.yaxis.get_label_position()}")

plt.title("Twin Axes with get_label_position() - how2matplotlib.com")
plt.show()
Output:
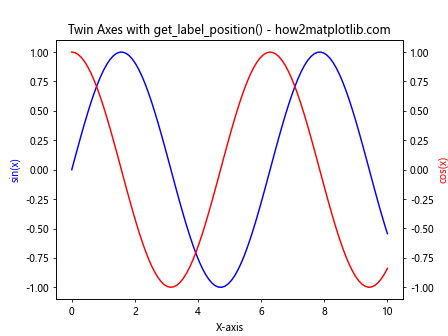
This example demonstrates how to use Matplotlib.axis.Axis.get_label_position() with twin axes to ensure that the labels are positioned correctly on both y-axes.
2. Combining get_label_position() with Annotations
You can use the Matplotlib.axis.Axis.get_label_position() function to dynamically position annotations based on the current label positions:
import matplotlib.pyplot as plt

fig, ax = plt.subplots()

# Plot some data
ax.plot([1, 2, 3, 4], [1, 4, 2, 3])

# Set labels
ax.set_xlabel("X-axis Label")
ax.set_ylabel("Y-axis Label")

# Get label positions
x_pos = ax.xaxis.get_label_position()
y_pos = ax.yaxis.get_label_position()

# Add annotations based on label positions
if x_pos == 'bottom':
    ax.annotate("X-label is at the bottom", xy=(0.5, 0), xytext=(0.5, -0.2),
                xycoords='axes fraction', textcoords='axes fraction',
                ha='center', va='center', bbox=dict(boxstyle='round', fc='w'))
else:
    ax.annotate("X-label is at the top", xy=(0.5, 1), xytext=(0.5, 1.2),
                xycoords='axes fraction', textcoords='axes fraction',
                ha='center', va='center', bbox=dict(boxstyle='round', fc='w'))

if y_pos == 'left':
    ax.annotate("Y-label is on the left", xy=(0, 0.5), xytext=(-0.2, 0.5),
                xycoords='axes fraction', textcoords='axes fraction',
                ha='center', va='center', rotation=90, bbox=dict(boxstyle='round', fc='w'))
else:
    ax.annotate("Y-label is on the right", xy=(1, 0.5), xytext=(1.2, 0.5),
                xycoords='axes fraction', textcoords='axes fraction',
                ha='center', va='center', rotation=-90, bbox=dict(boxstyle='round', fc='w'))

plt.title("Annotations Based on Label Positions - how2matplotlib.com")
plt.tight_layout()
plt.show()
Output:
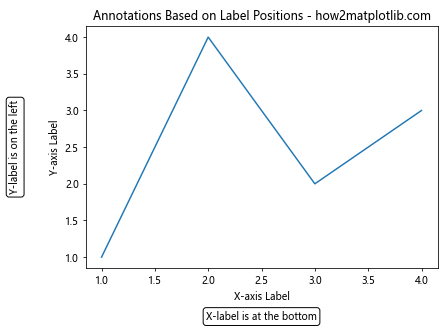
This example shows how to use Matplotlib.axis.Axis.get_label_position() to add annotations that describe the current positions of the axis labels.
Performance Considerations
While the Matplotlib.axis.Axis.get_label_position() function is generally fast and efficient, it’s important to consider performance when using it in large or complex visualizations. Here are some tips to optimize performance:
- Minimize repeated calls: If you need to use the label position multiple times, store it in a variable instead of calling the function repeatedly.
Use it judiciously in animations: If you’re creating animated plots, be cautious about calling Matplotlib.axis.Axis.get_label_position() in each frame, as it may impact performance.
Batch operations: If you’re working with multiple subplots, consider getting all label positions at once and storing them, rather than calling the function for each subplot individually.
Here’s an example that demonstrates these performance considerations: