Comprehensive Guide to Matplotlib.axis.Axis.get_gridlines() Function in Python
Matplotlib.axis.Axis.get_gridlines() function in Python is a powerful tool for managing and manipulating gridlines in Matplotlib plots. This function is an essential part of the Matplotlib library, which is widely used for creating static, animated, and interactive visualizations in Python. The get_gridlines() function specifically allows users to access and modify the gridlines of an axis, providing fine-grained control over the appearance and behavior of plots.
In this comprehensive guide, we’ll explore the Matplotlib.axis.Axis.get_gridlines() function in depth, covering its usage, parameters, return values, and practical applications. We’ll also provide numerous examples to illustrate how this function can be used in various scenarios to enhance your data visualization projects.
Understanding the Basics of Matplotlib.axis.Axis.get_gridlines()
Before diving into the specifics of the Matplotlib.axis.Axis.get_gridlines() function, it’s important to understand its role within the Matplotlib library. This function is a method of the Axis class, which represents either the x-axis or y-axis of a plot. The get_gridlines() function returns a list of Line2D objects that represent the gridlines for that axis.
Let’s start with a simple example to demonstrate how to use the Matplotlib.axis.Axis.get_gridlines() function:
import matplotlib.pyplot as plt

# Create a simple plot
fig, ax = plt.subplots()
ax.plot([1, 2, 3, 4], [1, 4, 2, 3])

# Get the gridlines for the x-axis
x_gridlines = ax.xaxis.get_gridlines()

# Print the number of gridlines
print(f"Number of x-axis gridlines: {len(x_gridlines)}")

plt.title("How2matplotlib.com - Basic Gridlines Example")
plt.show()
Output:
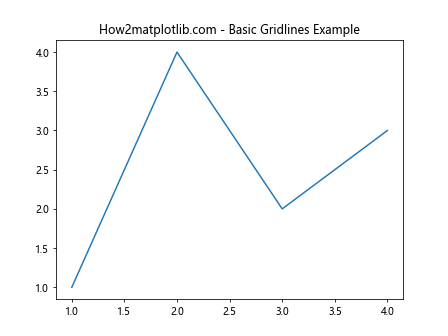
In this example, we create a simple line plot and then use the get_gridlines() function to retrieve the gridlines for the x-axis. The function returns a list of Line2D objects, which we can then manipulate or analyze as needed.
Exploring the Parameters of Matplotlib.axis.Axis.get_gridlines()
One of the key features of the Matplotlib.axis.Axis.get_gridlines() function is its simplicity – it doesn’t accept any parameters. This means that calling the function is straightforward and always returns the current gridlines for the specified axis.
However, it’s important to note that the behavior of get_gridlines() can be influenced by other Matplotlib settings and functions. For example, the visibility and appearance of gridlines can be controlled using methods like grid() or tick_params().
Let’s look at an example that demonstrates how these settings can affect the output of get_gridlines():
import matplotlib.pyplot as plt

# Create a plot with custom grid settings
fig, ax = plt.subplots()
ax.plot([1, 2, 3, 4], [1, 4, 2, 3])

# Customize grid appearance
ax.grid(True, linestyle='--', color='red', alpha=0.5)

# Get the gridlines for both axes
x_gridlines = ax.xaxis.get_gridlines()
y_gridlines = ax.yaxis.get_gridlines()

# Print information about the gridlines
print(f"Number of x-axis gridlines: {len(x_gridlines)}")
print(f"Number of y-axis gridlines: {len(y_gridlines)}")
print(f"X-axis gridline color: {x_gridlines[0].get_color()}")
print(f"Y-axis gridline style: {y_gridlines[0].get_linestyle()}")

plt.title("How2matplotlib.com - Custom Grid Settings")
plt.show()
Output:
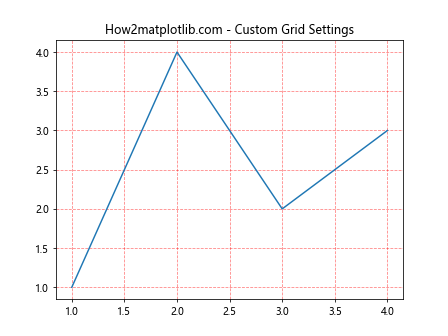
In this example, we customize the grid appearance using the grid() function before calling get_gridlines(). The returned Line2D objects reflect these custom settings, allowing us to inspect and further modify the gridlines as needed.
Understanding the Return Value of Matplotlib.axis.Axis.get_gridlines()
The Matplotlib.axis.Axis.get_gridlines() function returns a list of Line2D objects. Each Line2D object represents a single gridline and provides a wide range of properties and methods for customization.
Some of the key properties of Line2D objects include:
- color: The color of the gridline
- linestyle: The style of the line (solid, dashed, dotted, etc.)
- linewidth: The width of the line
- alpha: The transparency of the line
- visible: Whether the line is visible or not
Let’s create an example that demonstrates how to access and modify these properties:
import matplotlib.pyplot as plt

# Create a plot
fig, ax = plt.subplots()
ax.plot([1, 2, 3, 4], [1, 4, 2, 3])

# Get the gridlines for the y-axis
y_gridlines = ax.yaxis.get_gridlines()

# Customize each gridline individually
for i, line in enumerate(y_gridlines):
    line.set_color(f'C{i}')  # Set different colors for each line
    line.set_linestyle(':')  # Set dotted style
    line.set_linewidth(i + 1)  # Increase width for each line
    line.set_alpha(0.5)  # Set transparency

ax.grid(True)  # Ensure grid is visible

plt.title("How2matplotlib.com - Customized Gridlines")
plt.show()
Output:
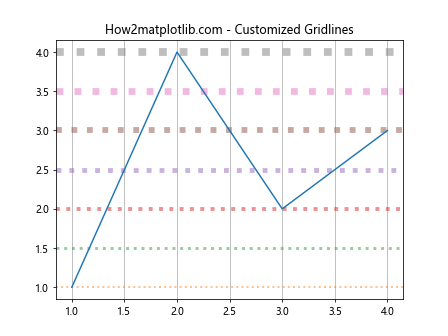
In this example, we retrieve the y-axis gridlines and then customize each one individually, setting different colors, styles, widths, and transparency levels. This demonstrates the fine-grained control that the get_gridlines() function provides over plot appearance.
Practical Applications of Matplotlib.axis.Axis.get_gridlines()
The Matplotlib.axis.Axis.get_gridlines() function has numerous practical applications in data visualization and plot customization. Here are some common use cases:
- Selective gridline visibility
- Dynamic gridline styling
- Gridline animation
- Custom grid patterns
- Axis-specific grid customization
Let’s explore each of these applications with detailed examples.
Selective Gridline Visibility
Sometimes, you may want to show gridlines only for specific tick marks. The get_gridlines() function allows you to achieve this by manipulating the visibility of individual gridlines.
import matplotlib.pyplot as plt
import numpy as np

# Create a plot
fig, ax = plt.subplots()
x = np.linspace(0, 10, 100)
ax.plot(x, np.sin(x))

# Get the x-axis gridlines
x_gridlines = ax.xaxis.get_gridlines()

# Make every other gridline invisible
for i, line in enumerate(x_gridlines):
    line.set_visible(i % 2 == 0)

ax.grid(True)
plt.title("How2matplotlib.com - Selective Gridline Visibility")
plt.show()
Output:
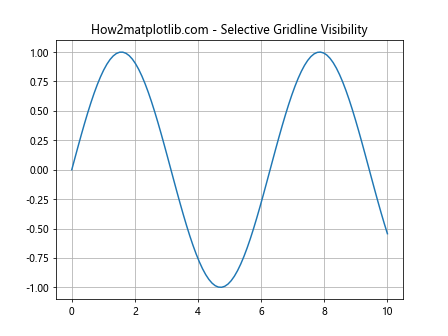
In this example, we create a sine wave plot and then use get_gridlines() to access the x-axis gridlines. We then set every other gridline to be invisible, creating a custom grid pattern.
Dynamic Gridline Styling
The Matplotlib.axis.Axis.get_gridlines() function can be used to create dynamic gridline styles that change based on data or other conditions.
import matplotlib.pyplot as plt
import numpy as np

# Create a plot
fig, ax = plt.subplots()
x = np.linspace(0, 10, 100)
y = np.sin(x)
ax.plot(x, y)

# Get the y-axis gridlines
y_gridlines = ax.yaxis.get_gridlines()

# Style gridlines based on y-value
for line, y_val in zip(y_gridlines, ax.get_yticks()):
    if y_val > 0:
        line.set_color('green')
    elif y_val < 0:
        line.set_color('red')
    else:
        line.set_color('black')
    line.set_linewidth(2)

ax.grid(True)
plt.title("How2matplotlib.com - Dynamic Gridline Styling")
plt.show()
Output:
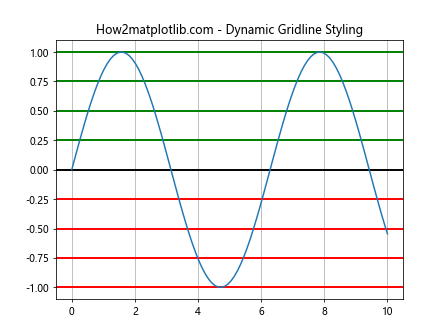
In this example, we style the y-axis gridlines based on their corresponding y-values. Positive values are green, negative values are red, and zero is black. This creates a visually informative grid that highlights the sign of the y-values.
Gridline Animation
The Matplotlib.axis.Axis.get_gridlines() function can be used in conjunction with animation features to create dynamic, animated grids.
import matplotlib.pyplot as plt
import matplotlib.animation as animation
import numpy as np

# Create a plot
fig, ax = plt.subplots()
x = np.linspace(0, 10, 100)
line, = ax.plot(x, np.sin(x))

# Get the gridlines
x_gridlines = ax.xaxis.get_gridlines()
y_gridlines = ax.yaxis.get_gridlines()

# Animation function
def animate(frame):
    # Update the sine wave
    line.set_ydata(np.sin(x + frame / 10))

    # Animate gridlines
    for gl in x_gridlines + y_gridlines:
        gl.set_alpha(0.5 + 0.5 * np.sin(frame / 5))

    return [line] + x_gridlines + y_gridlines

# Create the animation
ani = animation.FuncAnimation(fig, animate, frames=100, blit=True)

ax.grid(True)
plt.title("How2matplotlib.com - Animated Gridlines")
plt.show()
Output:
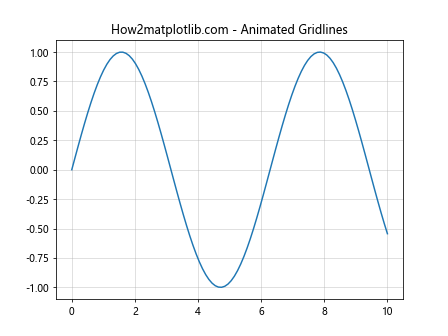
In this example, we create an animated plot where both the sine wave and the gridlines are animated. The gridlines' transparency changes over time, creating a pulsing effect.
Custom Grid Patterns
The Matplotlib.axis.Axis.get_gridlines() function allows for the creation of custom grid patterns by selectively styling or hiding gridlines.
import matplotlib.pyplot as plt
import numpy as np

# Create a plot
fig, ax = plt.subplots()
x = np.linspace(0, 10, 100)
ax.plot(x, np.sin(x))

# Get the gridlines
x_gridlines = ax.xaxis.get_gridlines()
y_gridlines = ax.yaxis.get_gridlines()

# Create a checkerboard pattern
for i, x_line in enumerate(x_gridlines):
    for j, y_line in enumerate(y_gridlines):
        if (i + j) % 2 == 0:
            x_line.set_visible(True)
            y_line.set_visible(True)
        else:
            x_line.set_visible(False)
            y_line.set_visible(False)

ax.grid(True)
plt.title("How2matplotlib.com - Custom Grid Pattern")
plt.show()
Output:
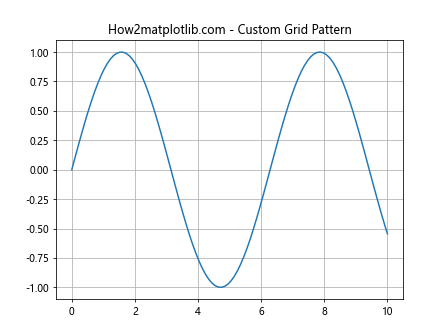
In this example, we create a checkerboard grid pattern by selectively hiding gridlines based on their position.
Axis-Specific Grid Customization
The Matplotlib.axis.Axis.get_gridlines() function allows for separate customization of x-axis and y-axis gridlines.
import matplotlib.pyplot as plt
import numpy as np

# Create a plot
fig, ax = plt.subplots()
x = np.linspace(0, 10, 100)
ax.plot(x, np.sin(x))

# Get the gridlines
x_gridlines = ax.xaxis.get_gridlines()
y_gridlines = ax.yaxis.get_gridlines()

# Customize x-axis gridlines
for line in x_gridlines:
    line.set_color('red')
    line.set_linestyle(':')

# Customize y-axis gridlines
for line in y_gridlines:
    line.set_color('blue')
    line.set_linestyle('--')

ax.grid(True)
plt.title("How2matplotlib.com - Axis-Specific Grid Customization")
plt.show()
Output:
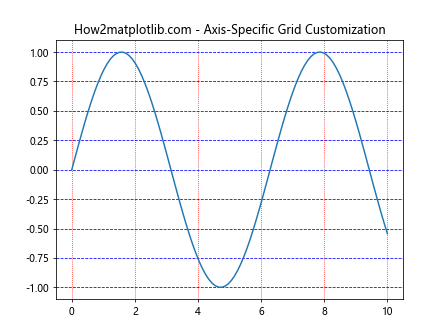
In this example, we customize the x-axis and y-axis gridlines separately, giving them different colors and line styles.
Advanced Techniques with Matplotlib.axis.Axis.get_gridlines()
While the basic usage of Matplotlib.axis.Axis.get_gridlines() is straightforward, there are several advanced techniques that can enhance your plots and provide even more control over gridline appearance and behavior.
Combining get_gridlines() with set_visible()
One powerful technique is to combine get_gridlines() with the set_visible() method to create dynamic, interactive plots where gridlines can be toggled on and off.
import matplotlib.pyplot as plt
from matplotlib.widgets import CheckButtons

# Create a plot
fig, ax = plt.subplots()
x = range(0, 10)
y = [i**2 for i in x]
ax.plot(x, y)

# Get the gridlines
x_gridlines = ax.xaxis.get_gridlines()
y_gridlines = ax.yaxis.get_gridlines()

# Create check buttons for toggling gridlines
ax_check = plt.axes([0.02, 0.85, 0.15, 0.1])
check = CheckButtons(ax_check, ['X Grid', 'Y Grid'], [True, True])

def toggle_grid(label):
    if label == 'X Grid':
        for line in x_gridlines:
            line.set_visible(not line.get_visible())
    elif label == 'Y Grid':
        for line in y_gridlines:
            line.set_visible(not line.get_visible())
    plt.draw()

check.on_clicked(toggle_grid)

ax.grid(True)
plt.title("How2matplotlib.com - Interactive Gridlines")
plt.show()
Output:
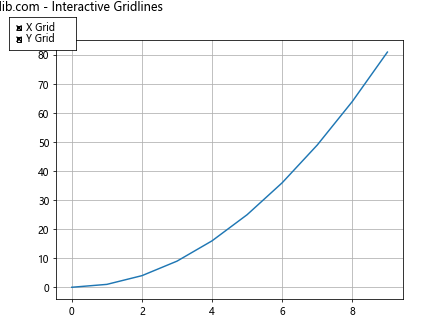
In this example, we create check buttons that allow the user to toggle the visibility of x-axis and y-axis gridlines independently.
Using get_gridlines() with Polar Plots
The Matplotlib.axis.Axis.get_gridlines() function can also be used with polar plots to customize radial and angular gridlines.
import matplotlib.pyplot as plt
import numpy as np

# Create a polar plot
fig, ax = plt.subplots(subplot_kw=dict(projection='polar'))
r = np.linspace(0, 1, 100)
theta = 2 * np.pi * r
ax.plot(theta, r)

# Get the gridlines
r_gridlines = ax.yaxis.get_gridlines()
theta_gridlines = ax.xaxis.get_gridlines()

# Customize radial gridlines
for line in r_gridlines:
    line.set_color('red')
    line.set_linestyle(':')

# Customize angular gridlines
for line in theta_gridlines:
    line.set_color('blue')
    line.set_linestyle('--')

ax.grid(True)
plt.title("How2matplotlib.com - Polar Plot Gridlines")
plt.show()
Output:
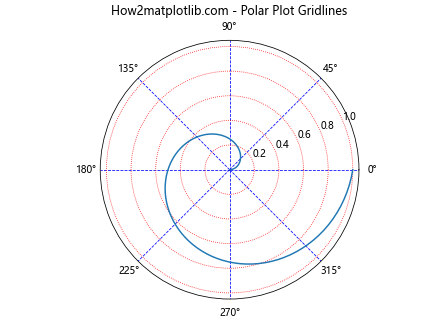
In this example, we customize the radial and angular gridlines of a polar plot separately, demonstrating how get_gridlines() can be used with different plot types.
Combining get_gridlines() with Colormaps
Another advanced technique is to combine get_gridlines() with Matplotlib's colormap functionality to create gradient-colored gridlines.
import matplotlib.pyplot as plt
import numpy as np

# Create a plot
fig, ax = plt.subplots()
x = np.linspace(0, 10, 100)
ax.plot(x, np.sin(x))

# Get the gridlines
y_gridlines = ax.yaxis.get_gridlines()

# Create a colormap
cmap = plt.get_cmap('viridis')

# Color gridlines based on their position
for i, line in enumerate(y_gridlines):
    color = cmap(i / len(y_gridlines))
    line.set_color(color)
    line.set_linewidth(2)

ax.grid(True)
plt.title("How2matplotlib.com - Gradient Colored Gridlines")
plt.show()
Output:
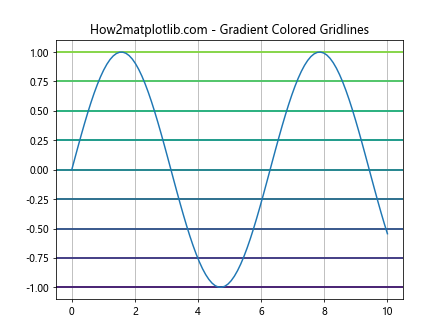
In this example, we color the y-axis gridlines usinga gradient based on their position, creating a visually striking effect that can help highlight different regions of the plot.
Using get_gridlines() with 3D Plots
The Matplotlib.axis.Axis.get_gridlines() function can also be used with 3D plots to customize gridlines in three-dimensional space.
import matplotlib.pyplot as plt
from mpl_toolkits.mplot3d import Axes3D
import numpy as np

# Create a 3D plot
fig = plt.figure()
ax = fig.add_subplot(111, projection='3d')

# Generate some sample data
x = np.linspace(-5, 5, 100)
y = np.linspace(-5, 5, 100)
X, Y = np.meshgrid(x, y)
Z = np.sin(np.sqrt(X**2 + Y**2))

# Plot the surface
surf = ax.plot_surface(X, Y, Z, cmap='viridis')

# Get the gridlines
x_gridlines = ax.xaxis.get_gridlines()
y_gridlines = ax.yaxis.get_gridlines()
z_gridlines = ax.zaxis.get_gridlines()

# Customize gridlines
for line in x_gridlines + y_gridlines + z_gridlines:
    line.set_color('red')
    line.set_linestyle(':')
    line.set_linewidth(0.5)

ax.grid(True)
plt.title("How2matplotlib.com - 3D Plot Gridlines")
plt.show()
Output:
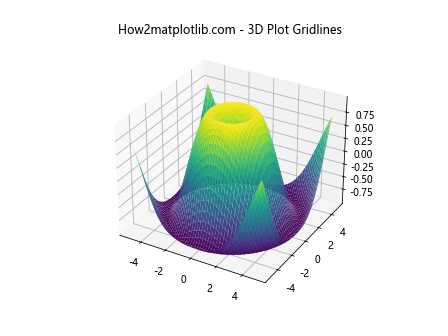
In this example, we create a 3D surface plot and customize the gridlines for all three axes, demonstrating how get_gridlines() can be used in more complex, multi-dimensional visualizations.
Best Practices for Using Matplotlib.axis.Axis.get_gridlines()
When working with the Matplotlib.axis.Axis.get_gridlines() function, there are several best practices to keep in mind:
- Performance Considerations: Modifying gridlines individually can be computationally expensive, especially for plots with many gridlines. If performance is a concern, consider using built-in Matplotlib functions like grid() for basic customization.
Consistency: When customizing gridlines, try to maintain consistency with the overall style of your plot. Overly complex or visually distracting gridlines can detract from the data you're trying to present.
Accessibility: When customizing gridlines, consider color blindness and other accessibility issues. Ensure that your gridlines are visible and distinguishable for all users.
Documentation: If you're creating complex or custom gridline styles, be sure to document your approach. This will make it easier for others (or yourself in the future) to understand and modify the plot if needed.
Combining with Other Matplotlib Features: The get_gridlines() function can be powerful when combined with other Matplotlib features like legends, annotations, and subplots. Experiment with different combinations to create informative and visually appealing plots.
Let's look at an example that incorporates some of these best practices: