Comprehensive Guide to Matplotlib.axis.Axis.cla() Function in Python:

Comprehensive Guide to Matplotlib.axis.Axis.cla() Function in Python:

Matplotlib.axis.Axis.cla() function in Python is a powerful tool for clearing the content of an axis in Matplotlib plots. This function is essential for resetting an axis to its default state, allowing you to create new plots or modify existing ones without interference from previous content. In this comprehensive guide, we’ll explore the Matplotlib.axis.Axis.cla() function in depth, covering its usage, benefits, and various applications in data visualization.

Understanding the Matplotlib.axis.Axis.cla() Function

The Matplotlib.axis.Axis.cla() function is a method of the Axis class in Matplotlib. It stands for “clear axis” and is used to remove all the content from a specific axis, including lines, text, and other plot elements. This function is particularly useful when you want to reuse an existing figure or axis for a new plot without creating an entirely new figure.

Let’s start with a simple example to demonstrate the basic usage of Matplotlib.axis.Axis.cla():

import matplotlib.pyplot as plt
import numpy as np

# Create a figure and axis
fig, ax = plt.subplots()

# Plot some data
x = np.linspace(0, 10, 100)
y = np.sin(x)
ax.plot(x, y, label='Sin(x)')
ax.set_title('How2matplotlib.com: Sin(x) Plot')
ax.legend()

# Clear the axis
ax.cla()

# Plot new data
y_new = np.cos(x)
ax.plot(x, y_new, label='Cos(x)')
ax.set_title('How2matplotlib.com: Cos(x) Plot')
ax.legend()

plt.show()

Output:
Comprehensive Guide to Matplotlib.axis.Axis.cla() Function in Python:

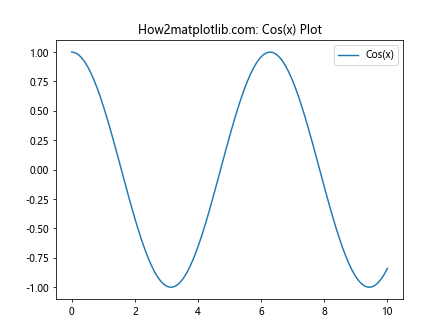
In this example, we first create a plot of sin(x), then use Matplotlib.axis.Axis.cla() to clear the axis content, and finally plot cos(x) on the same axis. The Matplotlib.axis.Axis.cla() function removes all the previous plot elements, allowing us to create a new plot without any interference from the previous one.

Benefits of Using Matplotlib.axis.Axis.cla()

The Matplotlib.axis.Axis.cla() function offers several advantages when working with Matplotlib plots:

  1. Memory efficiency: By clearing and reusing existing axes, you can reduce memory usage, especially when creating multiple plots in a loop.

  2. Cleaner code: It allows you to update plots in-place, leading to more concise and readable code.

  3. Interactive plotting: When creating interactive applications or animations, Matplotlib.axis.Axis.cla() is essential for updating plot content dynamically.

  4. Flexibility: You can selectively clear specific axes in a multi-plot figure, giving you fine-grained control over your visualizations.

Let’s explore these benefits with more examples.

Memory Efficiency with Matplotlib.axis.Axis.cla()

When creating multiple plots in a loop, using Matplotlib.axis.Axis.cla() can help manage memory usage effectively:

import matplotlib.pyplot as plt
import numpy as np

fig, ax = plt.subplots()

for i in range(5):
    x = np.linspace(0, 10, 100)
    y = np.sin(x + i)

    ax.cla()  # Clear the axis before each new plot
    ax.plot(x, y)
    ax.set_title(f'How2matplotlib.com: Sin(x + {i}) Plot')
    plt.pause(0.5)  # Pause to display each plot

plt.show()

Output:

Comprehensive Guide to Matplotlib.axis.Axis.cla() Function in Python:

In this example, we create a series of sine wave plots with different phase shifts. By using Matplotlib.axis.Axis.cla() before each new plot, we ensure that only one plot is stored in memory at a time, reducing overall memory usage.

Cleaner Code with Matplotlib.axis.Axis.cla()

The Matplotlib.axis.Axis.cla() function can help you write cleaner, more maintainable code by allowing you to update plots in-place:

import matplotlib.pyplot as plt
import numpy as np

def update_plot(ax, func, title):
    ax.cla()
    x = np.linspace(0, 10, 100)
    y = func(x)
    ax.plot(x, y)
    ax.set_title(f'How2matplotlib.com: {title}')

fig, ax = plt.subplots()

update_plot(ax, np.sin, 'Sin(x) Plot')
plt.pause(1)

update_plot(ax, np.cos, 'Cos(x) Plot')
plt.pause(1)

update_plot(ax, lambda x: x**2, 'x^2 Plot')
plt.show()

Output:

Comprehensive Guide to Matplotlib.axis.Axis.cla() Function in Python:

In this example, we define a function update_plot that uses Matplotlib.axis.Axis.cla() to clear the axis before plotting new data. This approach allows us to reuse the same axis for different plots, resulting in cleaner and more modular code.

Advanced Usage of Matplotlib.axis.Axis.cla()

The Matplotlib.axis.Axis.cla() function can be used in more advanced scenarios to create complex visualizations and interactive plots. Let’s explore some of these applications.

Animating Plots with Matplotlib.axis.Axis.cla()

Matplotlib.axis.Axis.cla() is particularly useful when creating animations. Here’s an example of a simple animation using this function:

import matplotlib.pyplot as plt
import numpy as np
from matplotlib.animation import FuncAnimation

fig, ax = plt.subplots()

def animate(frame):
    ax.cla()
    x = np.linspace(0, 10, 100)
    y = np.sin(x + frame / 10)
    ax.plot(x, y)
    ax.set_title(f'How2matplotlib.com: Animated Sin Wave (Frame {frame})')
    ax.set_ylim(-1.5, 1.5)

anim = FuncAnimation(fig, animate, frames=100, interval=50)
plt.show()

Output:

Comprehensive Guide to Matplotlib.axis.Axis.cla() Function in Python:

In this animation, we use Matplotlib.axis.Axis.cla() to clear the axis before drawing each frame. This ensures that each frame is drawn on a clean canvas, preventing overlapping plots and maintaining smooth animation.

Selective Clearing in Subplots

When working with multiple subplots, Matplotlib.axis.Axis.cla() allows you to selectively clear specific axes:

import matplotlib.pyplot as plt
import numpy as np

fig, (ax1, ax2) = plt.subplots(1, 2, figsize=(10, 4))

x = np.linspace(0, 10, 100)
y1 = np.sin(x)
y2 = np.cos(x)

ax1.plot(x, y1)
ax1.set_title('How2matplotlib.com: Sin(x)')

ax2.plot(x, y2)
ax2.set_title('How2matplotlib.com: Cos(x)')

plt.pause(2)

# Clear only the second subplot
ax2.cla()
ax2.plot(x, x**2)
ax2.set_title('How2matplotlib.com: x^2')

plt.show()

Output:

Comprehensive Guide to Matplotlib.axis.Axis.cla() Function in Python:

In this example, we create two subplots and then use Matplotlib.axis.Axis.cla() to clear only the second subplot, replacing its content with a new plot.

Common Pitfalls and Best Practices

While Matplotlib.axis.Axis.cla() is a powerful function, there are some common pitfalls to avoid and best practices to follow:

  1. Resetting axis limits: After using Matplotlib.axis.Axis.cla(), you may need to reset the axis limits if you want to maintain a specific view:
import matplotlib.pyplot as plt
import numpy as np

fig, ax = plt.subplots()

x = np.linspace(0, 10, 100)
y = np.sin(x)

ax.plot(x, y)
ax.set_title('How2matplotlib.com: Sin(x) with Fixed Limits')
ax.set_ylim(-1.5, 1.5)

plt.pause(1)

ax.cla()
y_new = 2 * np.sin(x)
ax.plot(x, y_new)
ax.set_title('How2matplotlib.com: 2*Sin(x) with Reset Limits')
ax.set_ylim(-3, 3)  # Reset limits after clearing

plt.show()

Output:

Comprehensive Guide to Matplotlib.axis.Axis.cla() Function in Python:

  1. Preserving axis properties: If you want to preserve certain axis properties after clearing, you’ll need to reapply them:
import matplotlib.pyplot as plt
import numpy as np

fig, ax = plt.subplots()

x = np.linspace(0, 10, 100)
y = np.sin(x)

ax.plot(x, y)
ax.set_title('How2matplotlib.com: Sin(x) with Custom Properties')
ax.set_facecolor('lightgray')
ax.grid(True, linestyle='--')

plt.pause(1)

ax.cla()
y_new = np.cos(x)
ax.plot(x, y_new)
ax.set_title('How2matplotlib.com: Cos(x) with Preserved Properties')
ax.set_facecolor('lightgray')  # Reapply facecolor
ax.grid(True, linestyle='--')  # Reapply grid

plt.show()

Output:

Comprehensive Guide to Matplotlib.axis.Axis.cla() Function in Python:

  1. Clearing vs. removing: Matplotlib.axis.Axis.cla() clears the content of an axis but doesn’t remove the axis itself. If you want to remove an entire subplot, use fig.delaxes(ax) instead:
import matplotlib.pyplot as plt
import numpy as np

fig, (ax1, ax2) = plt.subplots(1, 2, figsize=(10, 4))

x = np.linspace(0, 10, 100)
y1 = np.sin(x)
y2 = np.cos(x)

ax1.plot(x, y1)
ax1.set_title('How2matplotlib.com: Sin(x)')

ax2.plot(x, y2)
ax2.set_title('How2matplotlib.com: Cos(x)')

plt.pause(1)

# Remove the second subplot entirely
fig.delaxes(ax2)
fig.suptitle('How2matplotlib.com: Subplot Removed')

plt.show()

Output:

Comprehensive Guide to Matplotlib.axis.Axis.cla() Function in Python:

Combining Matplotlib.axis.Axis.cla() with Other Matplotlib Functions

The Matplotlib.axis.Axis.cla() function can be effectively combined with other Matplotlib functions to create more complex and dynamic visualizations. Let’s explore some examples:

Updating Plot Styles

You can use Matplotlib.axis.Axis.cla() to switch between different plot styles:

import matplotlib.pyplot as plt
import numpy as np

fig, ax = plt.subplots()

x = np.linspace(0, 10, 100)
y = np.sin(x)

# Initial line plot
ax.plot(x, y)
ax.set_title('How2matplotlib.com: Sin(x) Line Plot')
plt.pause(1)

# Switch to scatter plot
ax.cla()
ax.scatter(x, y, c=y, cmap='viridis')
ax.set_title('How2matplotlib.com: Sin(x) Scatter Plot')
plt.pause(1)

# Switch to step plot
ax.cla()
ax.step(x, y, where='mid')
ax.set_title('How2matplotlib.com: Sin(x) Step Plot')

plt.show()

Output:

Comprehensive Guide to Matplotlib.axis.Axis.cla() Function in Python:

Combining Multiple Plot Types

Matplotlib.axis.Axis.cla() allows you to create complex plots by combining different plot types:

import matplotlib.pyplot as plt
import numpy as np

fig, ax = plt.subplots()

x = np.linspace(0, 10, 100)
y1 = np.sin(x)
y2 = np.cos(x)

# Plot sin(x)
ax.plot(x, y1, label='Sin(x)')
ax.set_title('How2matplotlib.com: Sin(x)')
ax.legend()
plt.pause(1)

# Add cos(x) to the plot
ax.plot(x, y2, label='Cos(x)')
ax.set_title('How2matplotlib.com: Sin(x) and Cos(x)')
ax.legend()
plt.pause(1)

# Clear and create a new combined plot
ax.cla()
ax.plot(x, y1, label='Sin(x)')
ax.scatter(x, y2, c='red', s=20, label='Cos(x)')
ax.set_title('How2matplotlib.com: Sin(x) Line and Cos(x) Scatter')
ax.legend()

plt.show()

Output:

Comprehensive Guide to Matplotlib.axis.Axis.cla() Function in Python:

Creating Interactive Plots

Matplotlib.axis.Axis.cla() is particularly useful for creating interactive plots that respond to user input:

import matplotlib.pyplot as plt
import numpy as np

fig, ax = plt.subplots()

def update_plot(event):
    if event.key == 'left':
        func = np.sin
        title = 'Sin(x)'
    elif event.key == 'right':
        func = np.cos
        title = 'Cos(x)'
    else:
        return

    ax.cla()
    x = np.linspace(0, 10, 100)
    y = func(x)
    ax.plot(x, y)
    ax.set_title(f'How2matplotlib.com: {title}')
    fig.canvas.draw()

fig.canvas.mpl_connect('key_press_event', update_plot)

ax.text(0.5, 0.5, 'Press left arrow for Sin(x)\nPress right arrow for Cos(x)',
        ha='center', va='center', transform=ax.transAxes)

plt.show()

Output:

Comprehensive Guide to Matplotlib.axis.Axis.cla() Function in Python:

In this interactive example, pressing the left arrow key displays a sine wave, while pressing the right arrow key displays a cosine wave. The Matplotlib.axis.Axis.cla() function is used to clear the axis before drawing each new plot.

Performance Considerations

While Matplotlib.axis.Axis.cla() is a useful function, it’s important to consider its performance implications, especially when working with large datasets or creating animations:

  1. Frequent clearing: Calling Matplotlib.axis.Axis.cla() too frequently can impact performance, especially in animations. Consider using blitting techniques for smoother animations with large datasets.

  2. Memory management: Although Matplotlib.axis.Axis.cla() helps manage memory by clearing plot content, it doesn’t guarantee immediate memory release. For long-running applications or scripts that create many plots, you may need to explicitly close figures to free up memory.

  3. Redrawing overhead: Clearing and redrawing an entire axis can be computationally expensive. For simple updates, consider using more targeted methods like updating data directly or using set_data() for line plots.

Here’s an example demonstrating a more efficient approach for updating plots:

import matplotlib.pyplot as plt
import numpy as np

fig, ax = plt.subplots()

x = np.linspace(0, 10, 100)
line, = ax.plot(x, np.sin(x))
ax.set_title('How2matplotlib.com: Efficient Plot Updating')

for i in range(100):
    y = np.sin(x + i/10)
    line.set_ydata(y)
    ax.set_title(f'How2matplotlib.com: Sin(x + {i/10:.2f})')
    plt.pause(0.05)

plt.show()

Output:

Comprehensive Guide to Matplotlib.axis.Axis.cla() Function in Python:

In this example, instead of using Matplotlib.axis.Axis.cla() to clear and redraw the entire plot for each frame, we update only the y-data of the existing line object. This approach is more efficient for animations or frequently updated plots.

Alternatives to Matplotlib.axis.Axis.cla()

While Matplotlib.axis.Axis.cla() is a versatile function, there are alternative approaches for managing plot content in Matplotlib:

  1. plt.clf(): Clears the entire current figure
  2. plt.cla(): Clearsthe current axes
  3. ax.clear(): An alias for Matplotlib.axis.Axis.cla()
  4. fig.clear(): Clears all axes in the figure

Let’s explore these alternatives with examples:

Using plt.clf() to Clear the Entire Figure

import matplotlib.pyplot as plt
import numpy as np

x = np.linspace(0, 10, 100)
y1 = np.sin(x)
y2 = np.cos(x)

plt.plot(x, y1)
plt.title('How2matplotlib.com: Sin(x)')
plt.pause(1)

plt.clf()  # Clear the entire figure

plt.plot(x, y2)
plt.title('How2matplotlib.com: Cos(x)')
plt.show()

Output:

Comprehensive Guide to Matplotlib.axis.Axis.cla() Function in Python:

In this example, plt.clf() is used to clear the entire figure before creating a new plot.

Using plt.cla() to Clear the Current Axes

import matplotlib.pyplot as plt
import numpy as np

fig, (ax1, ax2) = plt.subplots(1, 2, figsize=(10, 4))

x = np.linspace(0, 10, 100)
y1 = np.sin(x)
y2 = np.cos(x)

ax1.plot(x, y1)
ax1.set_title('How2matplotlib.com: Sin(x)')

ax2.plot(x, y2)
ax2.set_title('How2matplotlib.com: Cos(x)')

plt.pause(1)

plt.sca(ax2)  # Set the current axes to ax2
plt.cla()  # Clear only the current axes (ax2)

ax2.plot(x, x**2)
ax2.set_title('How2matplotlib.com: x^2')

plt.show()

Output:

Comprehensive Guide to Matplotlib.axis.Axis.cla() Function in Python:

Here, plt.cla() is used to clear only the current axes (ax2) while leaving ax1 unchanged.

Using ax.clear() as an Alternative to Matplotlib.axis.Axis.cla()

import matplotlib.pyplot as plt
import numpy as np

fig, ax = plt.subplots()

x = np.linspace(0, 10, 100)
y1 = np.sin(x)
y2 = np.cos(x)

ax.plot(x, y1)
ax.set_title('How2matplotlib.com: Sin(x)')
plt.pause(1)

ax.clear()  # Equivalent to ax.cla()

ax.plot(x, y2)
ax.set_title('How2matplotlib.com: Cos(x)')
plt.show()

Output:

Comprehensive Guide to Matplotlib.axis.Axis.cla() Function in Python:

In this example, ax.clear() is used as an alternative to Matplotlib.axis.Axis.cla() to clear the axis content.

Using fig.clear() to Clear All Axes in a Figure

import matplotlib.pyplot as plt
import numpy as np

fig, (ax1, ax2) = plt.subplots(1, 2, figsize=(10, 4))

x = np.linspace(0, 10, 100)
y1 = np.sin(x)
y2 = np.cos(x)

ax1.plot(x, y1)
ax1.set_title('How2matplotlib.com: Sin(x)')

ax2.plot(x, y2)
ax2.set_title('How2matplotlib.com: Cos(x)')

plt.pause(1)

fig.clear()  # Clear all axes in the figure

ax = fig.add_subplot(111)  # Add a new subplot
ax.plot(x, x**2)
ax.set_title('How2matplotlib.com: x^2')

plt.show()

Output:

Comprehensive Guide to Matplotlib.axis.Axis.cla() Function in Python:

In this example, fig.clear() is used to clear all axes in the figure, allowing for a complete reset of the plot layout.

Best Practices for Using Matplotlib.axis.Axis.cla()

To make the most of the Matplotlib.axis.Axis.cla() function and avoid common pitfalls, consider the following best practices:

  1. Use Matplotlib.axis.Axis.cla() when you need to reuse an existing axis for a new plot.
  2. Be mindful of axis limits and properties that may need to be reset after clearing.
  3. Consider using more targeted update methods for simple changes or animations to improve performance.
  4. Combine Matplotlib.axis.Axis.cla() with other Matplotlib functions to create dynamic and interactive visualizations.
  5. Choose the appropriate clearing method (cla(), clf(), clear()) based on your specific needs and the scope of the changes you want to make.

Here’s an example that demonstrates some of these best practices:

import matplotlib.pyplot as plt
import numpy as np

def create_plot(ax, func, title, color='blue', linestyle='-'):
    ax.cla()  # Clear the axis
    x = np.linspace(0, 10, 100)
    y = func(x)
    ax.plot(x, y, color=color, linestyle=linestyle)
    ax.set_title(f'How2matplotlib.com: {title}')
    ax.set_xlim(0, 10)  # Reset x-axis limits
    ax.set_ylim(-1.5, 1.5)  # Reset y-axis limits
    ax.grid(True)  # Reapply grid

fig, ax = plt.subplots()

# Plot sin(x)
create_plot(ax, np.sin, 'Sin(x)')
plt.pause(1)

# Plot cos(x)
create_plot(ax, np.cos, 'Cos(x)', color='red', linestyle='--')
plt.pause(1)

# Plot tan(x)
create_plot(ax, np.tan, 'Tan(x)', color='green', linestyle=':')
plt.show()

Output:

Comprehensive Guide to Matplotlib.axis.Axis.cla() Function in Python:

This example demonstrates how to use Matplotlib.axis.Axis.cla() effectively within a function that creates different plots while maintaining consistent axis properties and limits.

Conclusion

The Matplotlib.axis.Axis.cla() function is a powerful tool in the Matplotlib library for managing plot content and creating dynamic visualizations. By clearing the content of an axis, it allows you to reuse existing plot elements, update visualizations efficiently, and create interactive and animated plots.

Like(0)

Matplotlib Articles