Comprehensive Guide to Matplotlib.axis.Axis.axis_date() Function in Python

Comprehensive Guide to Matplotlib.axis.Axis.axis_date() Function in Python

Matplotlib.axis.Axis.axis_date() function in Python is a powerful tool for handling date and time data on plot axes. This function is essential for creating time-based visualizations and is particularly useful when working with time series data. In this comprehensive guide, we’ll explore the Matplotlib.axis.Axis.axis_date() function in depth, covering its usage, parameters, and various applications in data visualization.

Understanding the Basics of Matplotlib.axis.Axis.axis_date()

The Matplotlib.axis.Axis.axis_date() function is a method of the Axis class in Matplotlib. Its primary purpose is to set up the axis for handling date values. When you call this function on an axis, it configures the axis to properly display and format date and time information.

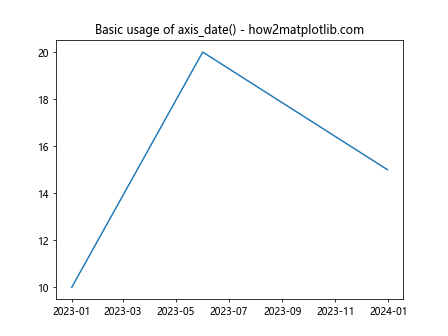
Let’s start with a simple example to illustrate the basic usage of Matplotlib.axis.Axis.axis_date():

import matplotlib.pyplot as plt
import datetime

# Create some sample data
dates = [datetime.datetime(2023, 1, 1), datetime.datetime(2023, 6, 1), datetime.datetime(2023, 12, 31)]
values = [10, 20, 15]

# Create the plot
fig, ax = plt.subplots()
ax.plot(dates, values)

# Apply axis_date() to the x-axis
ax.xaxis.axis_date()

plt.title("Basic usage of axis_date() - how2matplotlib.com")
plt.show()

Output:
Comprehensive Guide to Matplotlib.axis.Axis.axis_date() Function in Python

In this example, we create a simple line plot with dates on the x-axis. By calling ax.xaxis.axis_date(), we ensure that the x-axis is properly formatted to display dates.

Customizing Date Formats with Matplotlib.axis.Axis.axis_date()

One of the key features of the Matplotlib.axis.Axis.axis_date() function is its ability to customize date formats. You can specify different date formats to suit your visualization needs.

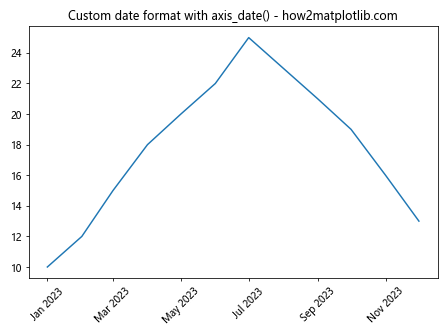
Here’s an example demonstrating how to customize the date format:

import matplotlib.pyplot as plt
import matplotlib.dates as mdates
import datetime

# Create sample data
dates = [datetime.datetime(2023, i, 1) for i in range(1, 13)]
values = [10, 12, 15, 18, 20, 22, 25, 23, 21, 19, 16, 13]

fig, ax = plt.subplots()
ax.plot(dates, values)

# Apply axis_date() with custom format
ax.xaxis.axis_date()
ax.xaxis.set_major_formatter(mdates.DateFormatter('%b %Y'))

plt.title("Custom date format with axis_date() - how2matplotlib.com")
plt.xticks(rotation=45)
plt.tight_layout()
plt.show()

Output:
Comprehensive Guide to Matplotlib.axis.Axis.axis_date() Function in Python

In this example, we use mdates.DateFormatter('%b %Y') to display dates in the format “Month Year” (e.g., “Jan 2023”).

Using Matplotlib.axis.Axis.axis_date() with Different Time Scales

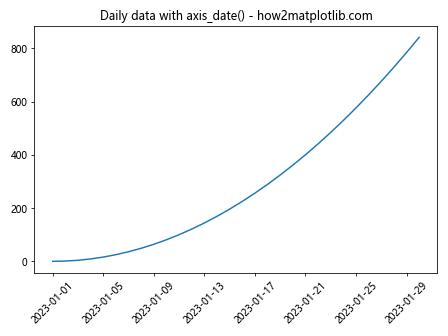
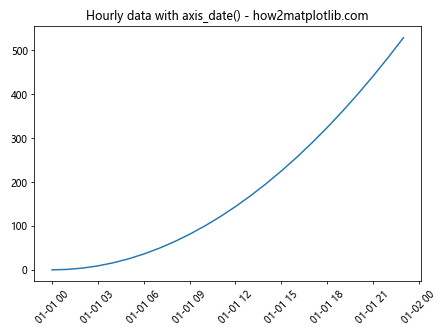
The Matplotlib.axis.Axis.axis_date() function can handle various time scales, from years down to milliseconds. Let’s explore how to work with different time scales:

Daily Data

import matplotlib.pyplot as plt
import datetime

# Create daily data
dates = [datetime.datetime(2023, 1, 1) + datetime.timedelta(days=i) for i in range(30)]
values = [i**2 for i in range(30)]

fig, ax = plt.subplots()
ax.plot(dates, values)

ax.xaxis.axis_date()
plt.title("Daily data with axis_date() - how2matplotlib.com")
plt.xticks(rotation=45)
plt.tight_layout()
plt.show()

Output:
Comprehensive Guide to Matplotlib.axis.Axis.axis_date() Function in Python

Hourly Data

import matplotlib.pyplot as plt
import datetime

# Create hourly data
dates = [datetime.datetime(2023, 1, 1) + datetime.timedelta(hours=i) for i in range(24)]
values = [i**2 for i in range(24)]

fig, ax = plt.subplots()
ax.plot(dates, values)

ax.xaxis.axis_date()
plt.title("Hourly data with axis_date() - how2matplotlib.com")
plt.xticks(rotation=45)
plt.tight_layout()
plt.show()

Output:
Comprehensive Guide to Matplotlib.axis.Axis.axis_date() Function in Python

Minute Data

import matplotlib.pyplot as plt
import datetime

# Create minute data
dates = [datetime.datetime(2023, 1, 1, 0, 0) + datetime.timedelta(minutes=i) for i in range(60)]
values = [i**2 for i in range(60)]

fig, ax = plt.subplots()
ax.plot(dates, values)

ax.xaxis.axis_date()
plt.title("Minute data with axis_date() - how2matplotlib.com")
plt.xticks(rotation=45)
plt.tight_layout()
plt.show()

Output:
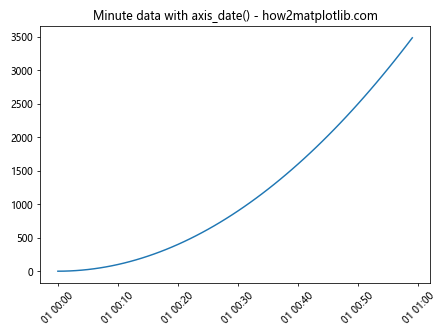
Comprehensive Guide to Matplotlib.axis.Axis.axis_date() Function in Python

Combining Matplotlib.axis.Axis.axis_date() with Locators

Matplotlib provides various locator classes that work well with the axis_date() function. These locators help in placing tick marks at appropriate intervals on the date axis.

Using YearLocator

import matplotlib.pyplot as plt
import matplotlib.dates as mdates
import datetime

# Create sample data
dates = [datetime.datetime(year, 1, 1) for year in range(2010, 2024)]
values = [i**2 for i in range(len(dates))]

fig, ax = plt.subplots()
ax.plot(dates, values)

ax.xaxis.axis_date()
ax.xaxis.set_major_locator(mdates.YearLocator())
ax.xaxis.set_major_formatter(mdates.DateFormatter('%Y'))

plt.title("YearLocator with axis_date() - how2matplotlib.com")
plt.xticks(rotation=45)
plt.tight_layout()
plt.show()

Output:
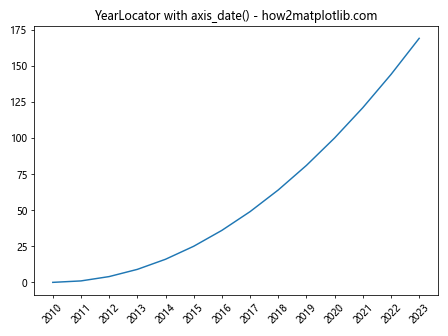
Comprehensive Guide to Matplotlib.axis.Axis.axis_date() Function in Python

Using MonthLocator

import matplotlib.pyplot as plt
import matplotlib.dates as mdates
import datetime

# Create sample data
dates = [datetime.datetime(2023, month, 1) for month in range(1, 13)]
values = [i**2 for i in range(len(dates))]

fig, ax = plt.subplots()
ax.plot(dates, values)

ax.xaxis.axis_date()
ax.xaxis.set_major_locator(mdates.MonthLocator())
ax.xaxis.set_major_formatter(mdates.DateFormatter('%b'))

plt.title("MonthLocator with axis_date() - how2matplotlib.com")
plt.xticks(rotation=45)
plt.tight_layout()
plt.show()

Output:
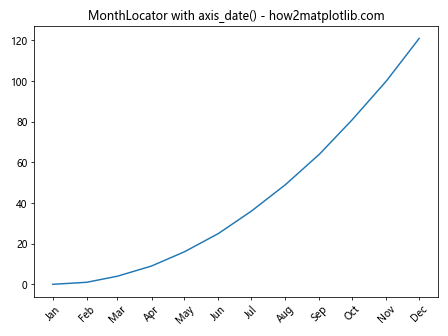
Comprehensive Guide to Matplotlib.axis.Axis.axis_date() Function in Python

Using DayLocator

import matplotlib.pyplot as plt
import matplotlib.dates as mdates
import datetime

# Create sample data
dates = [datetime.datetime(2023, 1, day) for day in range(1, 32)]
values = [i**2 for i in range(len(dates))]

fig, ax = plt.subplots()
ax.plot(dates, values)

ax.xaxis.axis_date()
ax.xaxis.set_major_locator(mdates.DayLocator(interval=5))
ax.xaxis.set_major_formatter(mdates.DateFormatter('%d'))

plt.title("DayLocator with axis_date() - how2matplotlib.com")
plt.xticks(rotation=45)
plt.tight_layout()
plt.show()

Output:
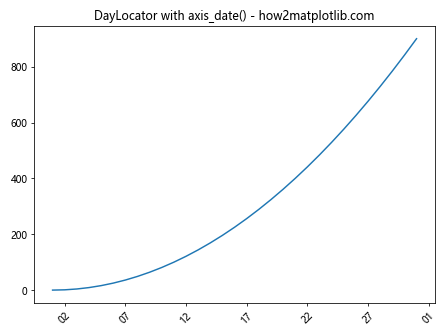
Comprehensive Guide to Matplotlib.axis.Axis.axis_date() Function in Python

Advanced Techniques with Matplotlib.axis.Axis.axis_date()

Now that we’ve covered the basics, let’s explore some advanced techniques using the Matplotlib.axis.Axis.axis_date() function.

Handling Time Zones

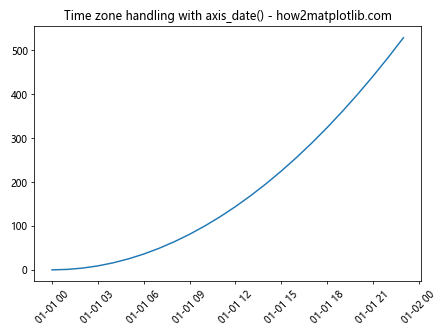
When working with date and time data from different time zones, it’s important to handle them correctly. Here’s an example of how to use axis_date() with time zone aware datetime objects:

import matplotlib.pyplot as plt
import datetime
import pytz

# Create time zone aware datetime objects
tz = pytz.timezone('US/Eastern')
dates = [tz.localize(datetime.datetime(2023, 1, 1) + datetime.timedelta(hours=i)) for i in range(24)]
values = [i**2 for i in range(24)]

fig, ax = plt.subplots()
ax.plot(dates, values)

ax.xaxis.axis_date(tz=tz)
plt.title("Time zone handling with axis_date() - how2matplotlib.com")
plt.xticks(rotation=45)
plt.tight_layout()
plt.show()

Output:
Comprehensive Guide to Matplotlib.axis.Axis.axis_date() Function in Python

In this example, we create time zone aware datetime objects and pass the time zone to axis_date() to ensure correct handling of the dates.

Combining Multiple Time Series

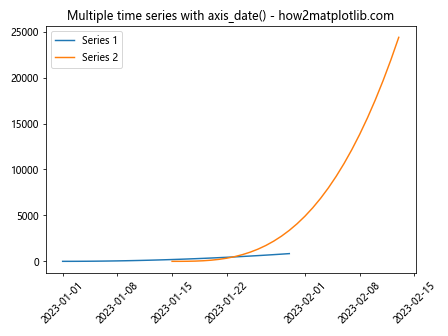
The Matplotlib.axis.Axis.axis_date() function is particularly useful when plotting multiple time series on the same axis. Here’s an example:

import matplotlib.pyplot as plt
import datetime

# Create two sets of sample data
dates1 = [datetime.datetime(2023, 1, 1) + datetime.timedelta(days=i) for i in range(30)]
values1 = [i**2 for i in range(30)]

dates2 = [datetime.datetime(2023, 1, 15) + datetime.timedelta(days=i) for i in range(30)]
values2 = [i**3 for i in range(30)]

fig, ax = plt.subplots()
ax.plot(dates1, values1, label='Series 1')
ax.plot(dates2, values2, label='Series 2')

ax.xaxis.axis_date()
plt.title("Multiple time series with axis_date() - how2matplotlib.com")
plt.legend()
plt.xticks(rotation=45)
plt.tight_layout()
plt.show()

Output:
Comprehensive Guide to Matplotlib.axis.Axis.axis_date() Function in Python

This example demonstrates how axis_date() can handle multiple time series with different date ranges on the same plot.

Creating a Date Slider

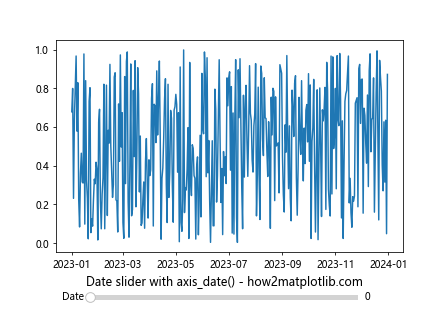
The Matplotlib.axis.Axis.axis_date() function can be combined with Matplotlib’s widgets to create interactive date-based visualizations. Here’s an example of creating a simple date slider:

import matplotlib.pyplot as plt
from matplotlib.widgets import Slider
import datetime
import numpy as np

# Create sample data
start_date = datetime.datetime(2023, 1, 1)
dates = [start_date + datetime.timedelta(days=i) for i in range(365)]
values = np.random.rand(365)

fig, ax = plt.subplots()
line, = ax.plot(dates, values)

ax.xaxis.axis_date()
plt.subplots_adjust(bottom=0.25)

# Create the slider
slider_ax = plt.axes([0.2, 0.1, 0.6, 0.03])
date_slider = Slider(slider_ax, 'Date', 0, 364, valinit=0, valstep=1)

def update(val):
    index = int(date_slider.val)
    ax.set_xlim(dates[index], dates[index+30])
    fig.canvas.draw_idle()

date_slider.on_changed(update)

plt.title("Date slider with axis_date() - how2matplotlib.com")
plt.show()

Output:
Comprehensive Guide to Matplotlib.axis.Axis.axis_date() Function in Python

This example creates a slider that allows the user to interactively explore different date ranges in the plot.

Best Practices for Using Matplotlib.axis.Axis.axis_date()

When working with the Matplotlib.axis.Axis.axis_date() function, there are several best practices to keep in mind:

  1. Always use datetime objects: The axis_date() function works best with Python’s datetime objects. Avoid using string representations of dates.

  2. Set appropriate locators and formatters: Use the right combination of locators and formatters to ensure your date axis is readable and informative.

  3. Handle time zones correctly: When working with data from different time zones, make sure to use time zone aware datetime objects and specify the time zone in axis_date().

  4. Rotate tick labels: For better readability, especially with longer date formats, rotate the tick labels using plt.xticks(rotation=45).

  5. Use tight_layout(): To prevent overlapping labels, use plt.tight_layout() to automatically adjust the plot layout.

Here’s an example incorporating these best practices:

import matplotlib.pyplot as plt
import matplotlib.dates as mdates
import datetime
import pytz

# Create sample data
tz = pytz.timezone('US/Eastern')
dates = [tz.localize(datetime.datetime(2023, 1, 1) + datetime.timedelta(days=i)) for i in range(365)]
values = [i**2 for i in range(365)]

fig, ax = plt.subplots(figsize=(12, 6))
ax.plot(dates, values)

# Apply best practices
ax.xaxis.axis_date(tz=tz)
ax.xaxis.set_major_locator(mdates.MonthLocator())
ax.xaxis.set_major_formatter(mdates.DateFormatter('%b %Y'))
ax.xaxis.set_minor_locator(mdates.DayLocator())

plt.title("Best practices for axis_date() - how2matplotlib.com")
plt.xticks(rotation=45)
plt.tight_layout()
plt.show()

Output:

Comprehensive Guide to Matplotlib.axis.Axis.axis_date() Function in Python

This example demonstrates the use of appropriate locators and formatters, correct time zone handling, rotated tick labels, and proper layout adjustment.

Troubleshooting Common Issues with Matplotlib.axis.Axis.axis_date()

When using the Matplotlib.axis.Axis.axis_date() function, you may encounter some common issues. Here are some problems and their solutions:

Issue 1: Dates not displaying correctly

If your dates are not displaying correctly, ensure that you’re using datetime objects and not strings. Here’s an example of how to convert string dates to datetime objects:

import matplotlib.pyplot as plt
import datetime

# Convert string dates to datetime objects
date_strings = ['2023-01-01', '2023-06-01', '2023-12-31']
dates = [datetime.datetime.strptime(date_str, '%Y-%m-%d') for date_str in date_strings]
values = [10, 20, 15]

fig, ax = plt.subplots()
ax.plot(dates, values)

ax.xaxis.axis_date()
plt.title("Converting string dates - how2matplotlib.com")
plt.show()

Output:

Comprehensive Guide to Matplotlib.axis.Axis.axis_date() Function in Python

Issue 2: Overlapping date labels

If your date labels are overlapping, you can adjust the figure size, rotate the labels, or use a different date format:

import matplotlib.pyplot as plt
import matplotlib.dates as mdates
import datetime

dates = [datetime.datetime(2023, 1, 1) + datetime.timedelta(days=i) for i in range(30)]
values = [i**2 for i in range(30)]

fig, ax = plt.subplots(figsize=(12, 6))
ax.plot(dates, values)

ax.xaxis.axis_date()
ax.xaxis.set_major_formatter(mdates.DateFormatter('%Y-%m-%d'))
plt.xticks(rotation=45, ha='right')
plt.title("Handling overlapping labels - how2matplotlib.com")
plt.tight_layout()
plt.show()

Output:

Comprehensive Guide to Matplotlib.axis.Axis.axis_date() Function in Python

Issue 3: Incorrect time zone display

If your dates are displaying in the wrong time zone, make sure to specify the correct time zone when creating datetime objects and when calling axis_date():

import matplotlib.pyplot as plt
import datetime
import pytz

tz = pytz.timezone('US/Pacific')
dates = [tz.localize(datetime.datetime(2023, 1, 1) + datetime.timedelta(hours=i)) for i in range(24)]
values = [i**2 for i in range(24)]

fig, ax = plt.subplots()
ax.plot(dates, values)

ax.xaxis.axis_date(tz=tz)
plt.title("Correct time zone display - how2matplotlib.com")
plt.xticks(rotation=45)
plt.tight_layout()
plt.show()

Output:

Comprehensive Guide to Matplotlib.axis.Axis.axis_date() Function in Python

This example demonstrates how to correctly handle time zones when using axis_date().

Advanced Applications of Matplotlib.axis.Axis.axis_date()

The Matplotlib.axis.Axis.axis_date() function can be used in various advanced applications. Let’s explore some of these scenarios:

Creating a Financial Chart

The axis_date() function is particularly useful for creating financial charts, such as stock price charts. Here’s an example:

import matplotlib.pyplot as plt
import matplotlib.dates as mdates
import datetime
import numpy as np

# Generate sample stock data
dates = [datetime.datetime(2023, 1, 1) + datetime.timedelta(days=i) for i in range(365)]
prices = np.cumsum(np.random.randn(365)) + 100

fig, ax = plt.subplots(figsize=(12, 6))
ax.plot(dates, prices)

ax.xaxis.axis_date()
ax.xaxis.set_major_locator(mdates.MonthLocator())
ax.xaxis.set_major_formatter(mdates.DateFormatter('%b %Y'))
ax.xaxis.set_minor_locator(mdates.DayLocator())

plt.title("Stock Price Chart - how2matplotlib.com")
plt.ylabel("Price")
plt.grid(True)
plt.xticks(rotation=45)
plt.tight_layout()
plt.show()

Output:

Comprehensive Guide to Matplotlib.axis.Axis.axis_date() Function in Python

This example creates a simple stock price chart with properly formatted date axis.

Creating a Heatmap with Date Axis

The axis_date() function can also be used in combination with other plot types, such as heatmaps:

import matplotlib.pyplot as plt
import matplotlib.dates as mdates
import datetime
import numpy as np

# Generate sample data
dates = [datetime.datetime(2023, 1, 1) + datetime.timedelta(days=i) for i in range(365)]
categories = ['A', 'B', 'C', 'D', 'E']
data = np.random.rand(len(categories), len(dates))

fig, ax = plt.subplots(figsize=(12, 6))
im = ax.imshow(data, aspect='auto', cmap='viridis')

ax.set_yticks(range(len(categories)))
ax.set_yticklabels(categories)

ax.xaxis.axis_date()
ax.xaxis.set_major_locator(mdates.MonthLocator())
ax.xaxis.set_major_formatter(mdates.DateFormatter('%b %Y'))

plt.colorbar(im)
plt.title("Heatmap with Date Axis - how2matplotlib.com")
plt.xticks(rotation=45)
plt.tight_layout()
plt.show()

Output:

Comprehensive Guide to Matplotlib.axis.Axis.axis_date() Function in Python

This example creates a heatmap with dates on the x-axis, demonstrating how axis_date() can be used with different plot types.

Creating a Multi-Axis Plot with Different Time Scales

The Matplotlib.axis.Axis.axis_date() function can be used to create plots with multiple axes, each with different time scales:

import matplotlib.pyplot as plt
import matplotlib.dates as mdates
import datetime
import numpy as np

# Generate sample data
dates1 = [datetime.datetime(2023, 1, 1) + datetime.timedelta(days=i) for i in range(365)]
dates2 = [datetime.datetime(2023, 1, 1) + datetime.timedelta(hours=i) for i in range(24*30)]

values1 = np.cumsum(np.random.randn(365))
values2 = np.cumsum(np.random.randn(24*30))

fig, (ax1, ax2) = plt.subplots(2, 1, figsize=(12, 8), sharex=True)

ax1.plot(dates1, values1, color='blue')
ax2.plot(dates2, values2, color='red')

ax1.xaxis.axis_date()
ax2.xaxis.axis_date()

ax1.xaxis.set_major_locator(mdates.MonthLocator())
ax1.xaxis.set_major_formatter(mdates.DateFormatter('%b %Y'))

ax2.xaxis.set_major_locator(mdates.DayLocator(interval=5))
ax2.xaxis.set_major_formatter(mdates.DateFormatter('%d %b'))

plt.title("Multi-Axis Plot with Different Time Scales - how2matplotlib.com")
plt.xticks(rotation=45)
plt.tight_layout()
plt.show()

Output:

Comprehensive Guide to Matplotlib.axis.Axis.axis_date() Function in Python

This example creates a plot with two axes, each showing data at different time scales (daily and hourly).

Integrating Matplotlib.axis.Axis.axis_date() with Other Libraries

The Matplotlib.axis.Axis.axis_date() function can be integrated with other popular data analysis and visualization libraries. Let’s explore some examples:

Using axis_date() with Pandas

Pandas is a powerful data manipulation library that works well with Matplotlib. Here’s an example of using axis_date() with Pandas:

import matplotlib.pyplot as plt
import pandas as pd

# Create a sample DataFrame
dates = pd.date_range(start='2023-01-01', end='2023-12-31', freq='D')
df = pd.DataFrame({'Date': dates, 'Value': range(len(dates))})

fig, ax = plt.subplots(figsize=(12, 6))
ax.plot(df['Date'], df['Value'])

ax.xaxis.axis_date()
plt.title("Using axis_date() with Pandas - how2matplotlib.com")
plt.xticks(rotation=45)
plt.tight_layout()
plt.show()

Output:

Comprehensive Guide to Matplotlib.axis.Axis.axis_date() Function in Python

This example demonstrates how to use axis_date() with a Pandas DataFrame.

Using axis_date() with Seaborn

Seaborn is a statistical data visualization library built on top of Matplotlib. Here’s how you can use axis_date() with Seaborn:

import matplotlib.pyplot as plt
import seaborn as sns
import pandas as pd

# Create a sample DataFrame
dates = pd.date_range(start='2023-01-01', end='2023-12-31', freq='D')
df = pd.DataFrame({'Date': dates, 'Value': range(len(dates))})

fig, ax = plt.subplots(figsize=(12, 6))
sns.lineplot(data=df, x='Date', y='Value', ax=ax)

ax.xaxis.axis_date()
plt.title("Using axis_date() with Seaborn - how2matplotlib.com")
plt.xticks(rotation=45)
plt.tight_layout()
plt.show()

Output:

Comprehensive Guide to Matplotlib.axis.Axis.axis_date() Function in Python

This example shows how to use axis_date() in combination with a Seaborn plot.

Performance Considerations for Matplotlib.axis.Axis.axis_date()

When working with large datasets, the performance of Matplotlib.axis.Axis.axis_date() can become a concern. Here are some tips to improve performance:

  1. Use appropriate locators: Choose locators that match your data’s time scale to reduce the number of tick marks.

  2. Limit the number of data points: If possible, aggregate your data to reduce the number of points plotted.

  3. Use blitting for animations: If you’re creating animated plots, use blitting to improve performance.

Here’s an example that demonstrates these performance tips:

import matplotlib.pyplot as plt
import matplotlib.dates as mdates
import datetime
import numpy as np

# Generate a large dataset
dates = [datetime.datetime(2023, 1, 1) + datetime.timedelta(minutes=i) for i in range(525600)]  # One year of minute data
values = np.cumsum(np.random.randn(525600))

# Aggregate data to daily values
daily_dates = dates[::1440]  # Every 1440 minutes (1 day)
daily_values = values[::1440]

fig, ax = plt.subplots(figsize=(12, 6))
ax.plot(daily_dates, daily_values)

ax.xaxis.axis_date()
ax.xaxis.set_major_locator(mdates.MonthLocator())
ax.xaxis.set_major_formatter(mdates.DateFormatter('%b %Y'))

plt.title("Performance Optimized Plot - how2matplotlib.com")
plt.xticks(rotation=45)
plt.tight_layout()
plt.show()

Output:

Comprehensive Guide to Matplotlib.axis.Axis.axis_date() Function in Python

This example demonstrates how to handle a large dataset by aggregating the data and using appropriate locators.

Conclusion

The Matplotlib.axis.Axis.axis_date() function is a powerful tool for handling date and time data in Matplotlib plots. Throughout this comprehensive guide, we’ve explored its basic usage, advanced techniques, integration with other libraries, and performance considerations.

Like(0)

Matplotlib Articles