Comprehensive Guide to Matplotlib.axis.Axis.get_majorticklabels() Function in Python
Matplotlib.axis.Axis.get_majorticklabels() function in Python is an essential tool for customizing and retrieving tick labels in Matplotlib plots. This function allows you to access and manipulate the major tick labels on an axis, providing greater control over the appearance and content of your visualizations. In this comprehensive guide, we’ll explore the Matplotlib.axis.Axis.get_majorticklabels() function in depth, covering its usage, parameters, return values, and practical applications.
Understanding the Matplotlib.axis.Axis.get_majorticklabels() Function
The Matplotlib.axis.Axis.get_majorticklabels() function is a method of the Axis class in Matplotlib. It returns a list of Text instances representing the major tick labels on the specified axis. This function is particularly useful when you need to access or modify the properties of individual tick labels, such as their text content, font properties, or positioning.
Let’s start with a simple example to demonstrate how to use the Matplotlib.axis.Axis.get_majorticklabels() function:
import matplotlib.pyplot as plt

# Create a simple plot
fig, ax = plt.subplots()
ax.plot([1, 2, 3, 4], [1, 4, 2, 3])

# Get the major tick labels
major_labels = ax.xaxis.get_majorticklabels()

# Print the text of each major tick label
for label in major_labels:
    print(f"Label text: {label.get_text()} - how2matplotlib.com")

plt.show()
Output:
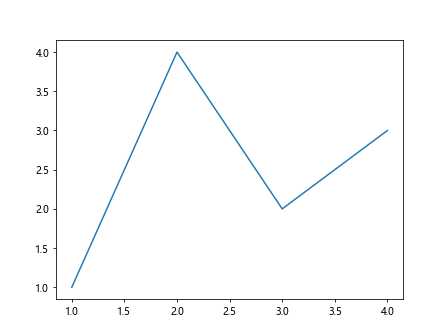
In this example, we create a simple line plot and then use the Matplotlib.axis.Axis.get_majorticklabels() function to retrieve the major tick labels on the x-axis. We then iterate through the labels and print their text content.
Parameters of Matplotlib.axis.Axis.get_majorticklabels()
The Matplotlib.axis.Axis.get_majorticklabels() function doesn’t accept any parameters. It simply returns the list of major tick labels for the specified axis.
Return Value of Matplotlib.axis.Axis.get_majorticklabels()
The Matplotlib.axis.Axis.get_majorticklabels() function returns a list of Text instances. Each Text instance represents a major tick label on the axis and provides various properties and methods for customizing the label’s appearance and content.
Let’s explore some of the properties and methods available for the Text instances returned by Matplotlib.axis.Axis.get_majorticklabels():
import matplotlib.pyplot as plt

fig, ax = plt.subplots()
ax.plot([1, 2, 3, 4], [1, 4, 2, 3])

major_labels = ax.xaxis.get_majorticklabels()

for label in major_labels:
    print(f"Label text: {label.get_text()} - how2matplotlib.com")
    print(f"Label position: {label.get_position()}")
    print(f"Label font properties: {label.get_fontproperties()}")
    print(f"Label color: {label.get_color()}")
    print("---")

plt.show()
Output:
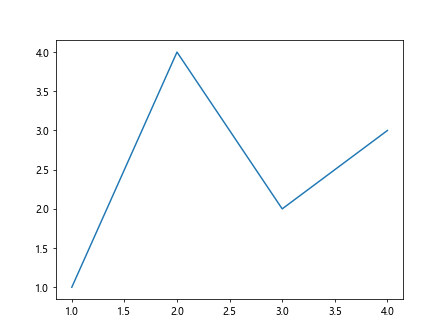
This example demonstrates how to access various properties of the Text instances returned by Matplotlib.axis.Axis.get_majorticklabels(). We print the text content, position, font properties, and color of each major tick label.
Customizing Major Tick Labels Using Matplotlib.axis.Axis.get_majorticklabels()
One of the primary use cases for the Matplotlib.axis.Axis.get_majorticklabels() function is to customize the appearance and content of major tick labels. Let’s explore some common customization techniques:
Changing the Text of Major Tick Labels
You can use Matplotlib.axis.Axis.get_majorticklabels() to modify the text of individual tick labels:
import matplotlib.pyplot as plt

fig, ax = plt.subplots()
ax.plot([1, 2, 3, 4], [1, 4, 2, 3])

major_labels = ax.xaxis.get_majorticklabels()

new_labels = ["A", "B", "C", "D", "E"]
for i, label in enumerate(major_labels):
    if i < len(new_labels):
        label.set_text(f"{new_labels[i]} - how2matplotlib.com")

plt.show()
Output:
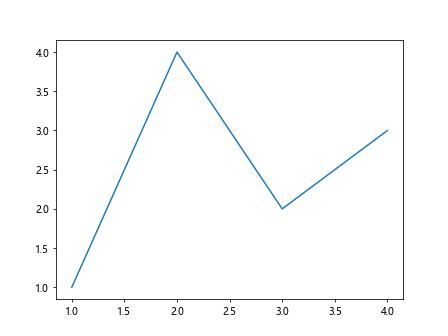
In this example, we replace the default numeric labels with custom text labels using the set_text() method.
Rotating Major Tick Labels
You can rotate the major tick labels to improve readability or accommodate long label text:
import matplotlib.pyplot as plt

fig, ax = plt.subplots()
ax.plot([1, 2, 3, 4], [1, 4, 2, 3])

major_labels = ax.xaxis.get_majorticklabels()

for label in major_labels:
    label.set_rotation(45)
    label.set_ha('right')

plt.title("Rotated Labels - how2matplotlib.com")
plt.tight_layout()
plt.show()
Output:
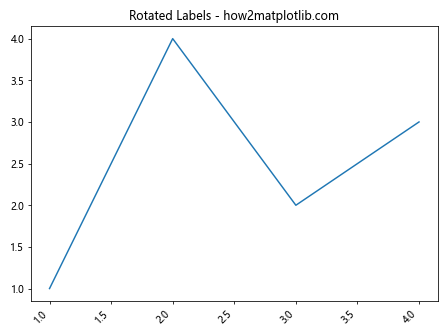
This example demonstrates how to rotate the major tick labels by 45 degrees and adjust their horizontal alignment.
Changing the Font Properties of Major Tick Labels
You can modify the font properties of major tick labels to customize their appearance:
import matplotlib.pyplot as plt

fig, ax = plt.subplots()
ax.plot([1, 2, 3, 4], [1, 4, 2, 3])

major_labels = ax.xaxis.get_majorticklabels()

for label in major_labels:
    label.set_fontweight('bold')
    label.set_fontsize(14)
    label.set_color('red')

plt.title("Custom Font Properties - how2matplotlib.com")
plt.show()
Output:
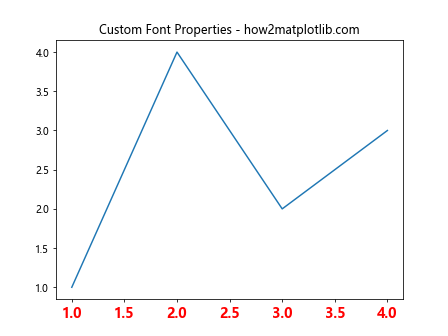
This example shows how to change the font weight, size, and color of the major tick labels.
Advanced Applications of Matplotlib.axis.Axis.get_majorticklabels()
Now that we've covered the basics, let's explore some more advanced applications of the Matplotlib.axis.Axis.get_majorticklabels() function:
Conditional Formatting of Major Tick Labels
You can apply conditional formatting to major tick labels based on their values or positions:
import matplotlib.pyplot as plt

fig, ax = plt.subplots()
ax.plot([1, 2, 3, 4, 5], [1, 4, 2, 3, 5])

major_labels = ax.xaxis.get_majorticklabels()

for label in major_labels:
    value = float(label.get_text())
    if value % 2 == 0:
        label.set_color('red')
        label.set_fontweight('bold')
    else:
        label.set_color('blue')
        label.set_fontstyle('italic')

plt.title("Conditional Formatting - how2matplotlib.com")
plt.show()
Output:
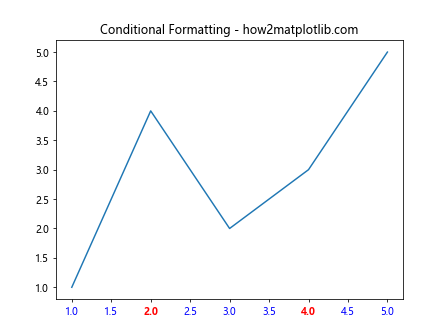
In this example, we apply different formatting to even and odd tick labels.
Adding Prefixes or Suffixes to Major Tick Labels
You can use Matplotlib.axis.Axis.get_majorticklabels() to add prefixes or suffixes to the existing tick labels:
import matplotlib.pyplot as plt

fig, ax = plt.subplots()
ax.plot([1, 2, 3, 4], [10, 20, 30, 40])

major_labels = ax.yaxis.get_majorticklabels()

for label in major_labels:
    current_text = label.get_text()
    label.set_text(f"${current_text} - how2matplotlib.com")

plt.title("Adding Prefixes to Labels")
plt.show()
Output:
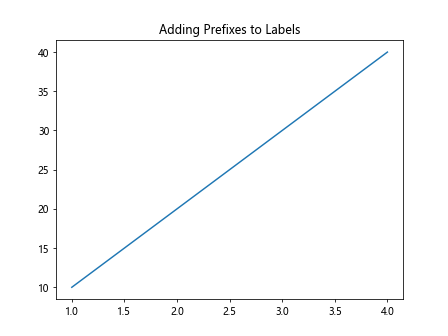
This example demonstrates how to add a dollar sign prefix to the y-axis tick labels.
Creating Custom Tick Formatters
You can use Matplotlib.axis.Axis.get_majorticklabels() in combination with custom tick formatters for more complex label formatting:
import matplotlib.pyplot as plt
import matplotlib.ticker as ticker

def custom_formatter(x, pos):
    if x < 2:
        return f"Low: {x:.1f}"
    elif x < 3:
        return f"Medium: {x:.1f}"
    else:
        return f"High: {x:.1f}"

fig, ax = plt.subplots()
ax.plot([1, 2, 3, 4], [1, 4, 2, 3])

ax.xaxis.set_major_formatter(ticker.FuncFormatter(custom_formatter))

major_labels = ax.xaxis.get_majorticklabels()
for label in major_labels:
    label.set_rotation(45)
    label.set_ha('right')

plt.title("Custom Tick Formatter - how2matplotlib.com")
plt.tight_layout()
plt.show()
Output:
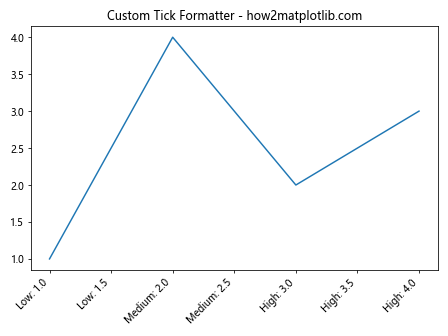
This example demonstrates how to create a custom tick formatter that categorizes values as "Low," "Medium," or "High" based on their magnitude.
Handling Date and Time Tick Labels
The Matplotlib.axis.Axis.get_majorticklabels() function is particularly useful when working with date and time data. Let's explore some examples:
Formatting Date Tick Labels
import matplotlib.pyplot as plt
import matplotlib.dates as mdates
from datetime import datetime, timedelta

dates = [datetime(2023, 1, 1) + timedelta(days=i) for i in range(10)]
values = [1, 3, 2, 4, 3, 5, 4, 6, 5, 7]

fig, ax = plt.subplots(figsize=(10, 5))
ax.plot(dates, values)

ax.xaxis.set_major_formatter(mdates.DateFormatter('%Y-%m-%d'))
ax.xaxis.set_major_locator(mdates.DayLocator(interval=2))

major_labels = ax.xaxis.get_majorticklabels()
for label in major_labels:
    label.set_rotation(45)
    label.set_ha('right')

plt.title("Date Formatting - how2matplotlib.com")
plt.tight_layout()
plt.show()
Output:
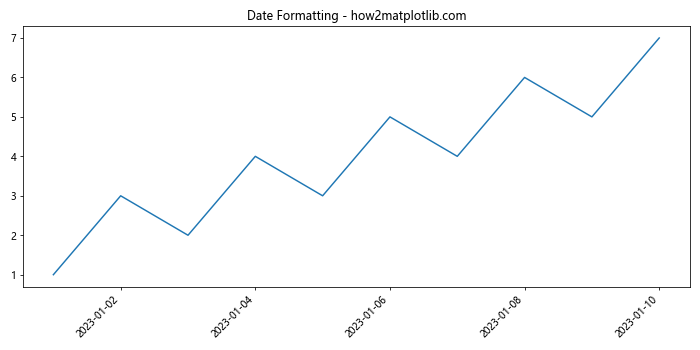
This example demonstrates how to format date tick labels and use Matplotlib.axis.Axis.get_majorticklabels() to rotate them for better readability.
Customizing Time Tick Labels
import matplotlib.pyplot as plt
import matplotlib.dates as mdates
from datetime import datetime, timedelta

times = [datetime(2023, 1, 1, 12, 0) + timedelta(hours=i) for i in range(24)]
values = [i**2 for i in range(24)]

fig, ax = plt.subplots(figsize=(12, 5))
ax.plot(times, values)

ax.xaxis.set_major_formatter(mdates.DateFormatter('%H:%M'))
ax.xaxis.set_major_locator(mdates.HourLocator(interval=3))

major_labels = ax.xaxis.get_majorticklabels()
for label in major_labels:
    label.set_color('blue')
    label.set_fontweight('bold')

plt.title("Time Formatting - how2matplotlib.com")
plt.tight_layout()
plt.show()
Output:
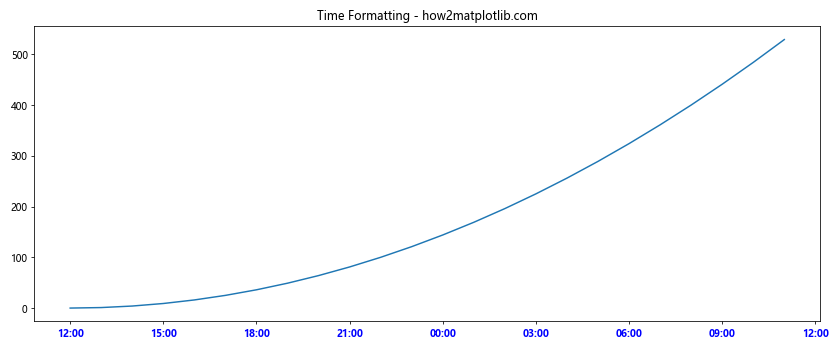
This example shows how to customize time tick labels using Matplotlib.axis.Axis.get_majorticklabels().
Working with Logarithmic Scales
The Matplotlib.axis.Axis.get_majorticklabels() function can be particularly useful when working with logarithmic scales. Let's explore some examples:
Customizing Logarithmic Tick Labels
import matplotlib.pyplot as plt
import numpy as np

fig, ax = plt.subplots()
x = np.logspace(0, 3, 100)
y = x**2

ax.loglog(x, y)

major_labels = ax.xaxis.get_majorticklabels()
for label in major_labels:
    label.set_color('red')
    label.set_fontweight('bold')

plt.title("Logarithmic Scale - how2matplotlib.com")
plt.show()
Output:
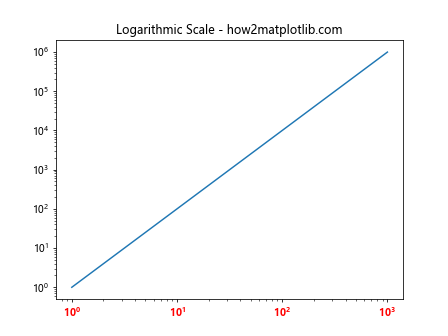
This example demonstrates how to customize the appearance of tick labels on a logarithmic scale.
Handling Multiple Subplots
The Matplotlib.axis.Axis.get_majorticklabels() function can be used to customize tick labels across multiple subplots. Let's explore some examples:
Synchronizing Tick Labels Across Subplots
import matplotlib.pyplot as plt

fig, (ax1, ax2) = plt.subplots(2, 1, figsize=(8, 8), sharex=True)

ax1.plot([1, 2, 3, 4], [1, 4, 2, 3])
ax2.plot([1, 2, 3, 4], [3, 2, 4, 1])

major_labels = ax2.xaxis.get_majorticklabels()
for label in major_labels:
    label.set_color('red')
    label.set_fontweight('bold')

plt.suptitle("Synchronized Tick Labels - how2matplotlib.com")
plt.tight_layout()
plt.show()
Output:
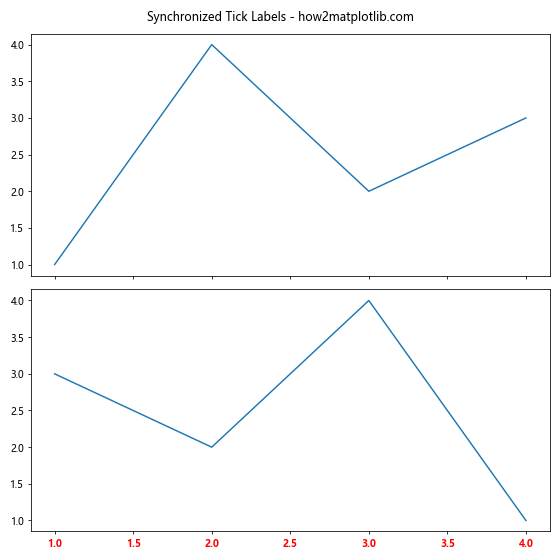
This example demonstrates how to synchronize and customize tick labels across multiple subplots using Matplotlib.axis.Axis.get_majorticklabels().
Customizing Tick Labels for Individual Subplots
import matplotlib.pyplot as plt

fig, (ax1, ax2) = plt.subplots(1, 2, figsize=(12, 5))

ax1.plot([1, 2, 3, 4], [1, 4, 2, 3])
ax2.plot([1, 2, 3, 4], [3, 2, 4, 1])

major_labels_1 = ax1.xaxis.get_majorticklabels()
for label in major_labels_1:
    label.set_color('blue')
    label.set_fontweight('bold')

major_labels_2 = ax2.xaxis.get_majorticklabels()
for label in major_labels_2:
    label.set_color('red')
    label.set_fontstyle('italic')

plt.suptitle("Custom Tick Labels for Subplots - how2matplotlib.com")
plt.tight_layout()
plt.show()
Output:
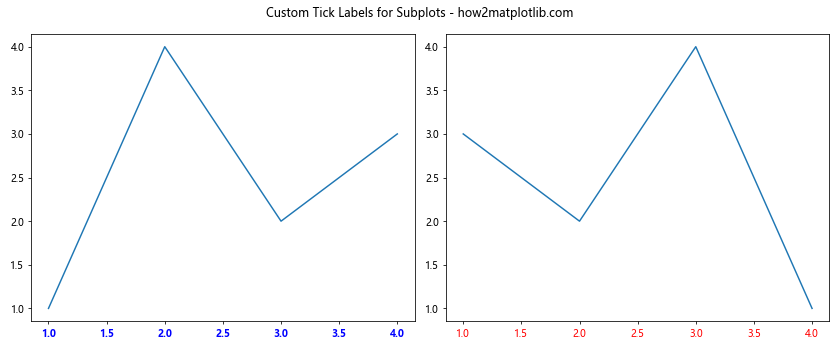
This example shows how to customize tick labels individually for different subplots using Matplotlib.axis.Axis.get_majorticklabels().
Handling Polar Plots
The Matplotlib.axis.Axis.get_majorticklabels() function can also be used with polar plots. Let's explore an example:
Customizing Tick Labels in Polar Plots
import matplotlib.pyplot as plt
import numpy as np

fig, ax = plt.subplots(subplot_kw=dict(projection='polar'))

r = np.arange(0, 2, 0.01)
theta = 2 * np.pi * r

ax.plot(theta, r)

major_labels = ax.xaxis.get_majorticklabels()
for label in major_labels:
    label.set_fontweight('bold')
    label.set_color('blue')

plt.title("Polar Plot with Custom Tick Labels - how2matplotlib.com")
plt.tight_layout()
plt.show()
Output:
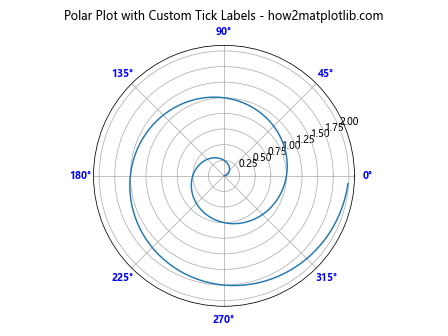
This example shows how to customize tick labels in a polar plot using Matplotlib.axis.Axis.get_majorticklabels().
Best Practices and Tips for Using Matplotlib.axis.Axis.get_majorticklabels()
When working with the Matplotlib.axis.Axis.get_majorticklabels() function, keep the following best practices and tips in mind:
- Always check the number of tick labels: The number of tick labels returned by get_majorticklabels() may vary depending on the plot size and data range. Make sure to handle cases where there might be fewer or more labels than expected.
Use tight_layout(): When modifying tick labels, especially when rotating them, use plt.tight_layout() to ensure that all labels are visible and not cut off by the plot boundaries.
Combine with set_major_locator(): For more control over the number and position of tick labels, use set_major_locator() in combination with get_majorticklabels().
Consider using FuncFormatter: For complex label formatting, consider using matplotlib.ticker.FuncFormatter instead of modifying each label individually.
Be mindful of performance: Modifying a large number of tick labels individually can be computationally expensive. For plots with many tick labels, consider using vectorized operations or custom tick formatters.
Use with get_minorticklabels(): Don't forget that you can also use get_minorticklabels() to customize minor tick labels in a similar way.
Test with different plot sizes: Ensure that your customizations work well with various plot sizes, as the number and position of tick labels may change.
Troubleshooting Common Issues with Matplotlib.axis.Axis.get_majorticklabels()
When working with Matplotlib.axis.Axis.get_majorticklabels(), you may encounter some common issues. Here are some troubleshooting tips: