How to Master plt.subplots Padding in Matplotlib
plt.subplots padding is an essential aspect of creating well-organized and visually appealing plots in Matplotlib. This article will delve deep into the intricacies of plt.subplots padding, providing you with a comprehensive understanding of how to effectively use this feature to enhance your data visualizations. We’ll explore various techniques, best practices, and examples to help you master the art of subplot padding in Matplotlib.
Understanding plt.subplots and Padding
Before we dive into the specifics of plt.subplots padding, let’s first understand what plt.subplots are and why padding is important. plt.subplots is a function in Matplotlib that allows you to create a figure and a set of subplots in a single call. Padding, in the context of plt.subplots, refers to the space between subplots and the figure edges.
Proper padding is crucial for several reasons:
- It improves the overall aesthetics of your plots
- It prevents overlapping of plot elements
- It ensures that labels and titles are clearly visible
- It helps in creating a balanced and professional-looking visualization
Let’s start with a basic example of creating subplots with default padding:
import matplotlib.pyplot as plt
import numpy as np

fig, (ax1, ax2) = plt.subplots(1, 2, figsize=(10, 5))

x = np.linspace(0, 10, 100)
ax1.plot(x, np.sin(x), label='Sine')
ax1.set_title('Sine Wave - how2matplotlib.com')
ax1.legend()

ax2.plot(x, np.cos(x), label='Cosine')
ax2.set_title('Cosine Wave - how2matplotlib.com')
ax2.legend()

plt.show()
Output:
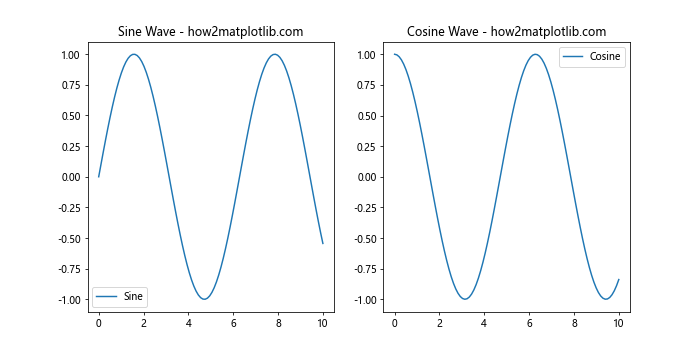
In this example, we create two subplots side by side using plt.subplots. The default padding is applied, which may not always be ideal for your specific visualization needs.
Adjusting Padding with plt.subplots_adjust
One of the primary methods to control padding in plt.subplots is by using the plt.subplots_adjust function. This function allows you to adjust the spacing between subplots and the figure edges. Let’s explore how to use plt.subplots_adjust to fine-tune your subplot padding:
import matplotlib.pyplot as plt
import numpy as np

fig, (ax1, ax2) = plt.subplots(1, 2, figsize=(10, 5))

x = np.linspace(0, 10, 100)
ax1.plot(x, np.sin(x), label='Sine')
ax1.set_title('Sine Wave - how2matplotlib.com')
ax1.legend()

ax2.plot(x, np.cos(x), label='Cosine')
ax2.set_title('Cosine Wave - how2matplotlib.com')
ax2.legend()

plt.subplots_adjust(left=0.1, right=0.95, top=0.9, bottom=0.1, wspace=0.3, hspace=0.4)

plt.show()
Output:
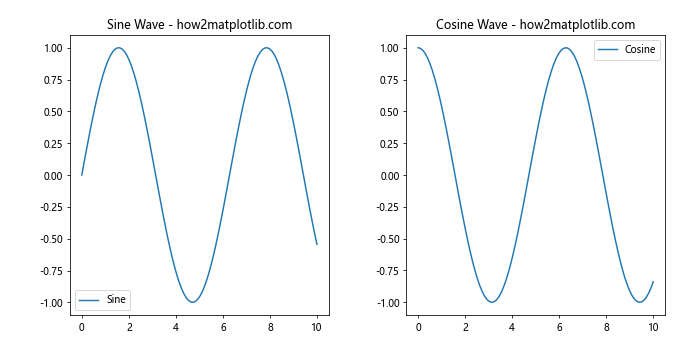
In this example, we use plt.subplots_adjust to modify the padding of our subplots. The parameters used are:
- left: The left side of the subplots of the figure
- right: The right side of the subplots of the figure
- top: The top of the subplots of the figure
- bottom: The bottom of the subplots of the figure
- wspace: The width of the padding between subplots, as a fraction of the average axes width
- hspace: The height of the padding between subplots, as a fraction of the average axes height
By adjusting these values, you can create custom padding that suits your specific visualization needs.
Using tight_layout for Automatic Padding Adjustment
While manually adjusting padding with plt.subplots_adjust gives you fine-grained control, it can be time-consuming to find the perfect values. Matplotlib provides a convenient function called tight_layout that automatically adjusts subplot parameters to give specified padding. Here’s how to use it:
import matplotlib.pyplot as plt
import numpy as np

fig, (ax1, ax2) = plt.subplots(1, 2, figsize=(10, 5))

x = np.linspace(0, 10, 100)
ax1.plot(x, np.sin(x), label='Sine')
ax1.set_title('Sine Wave - how2matplotlib.com')
ax1.legend()

ax2.plot(x, np.cos(x), label='Cosine')
ax2.set_title('Cosine Wave - how2matplotlib.com')
ax2.legend()

plt.tight_layout(pad=2.0)

plt.show()
Output:
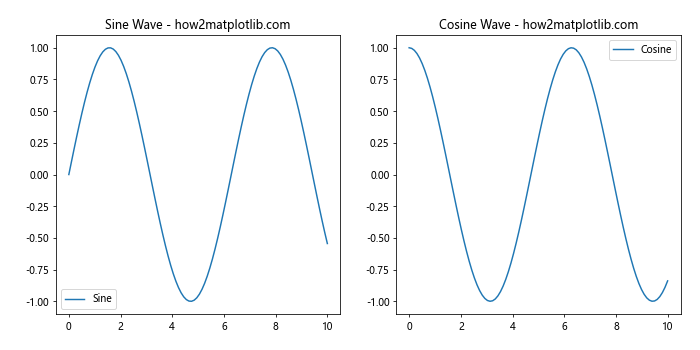
In this example, we use plt.tight_layout() with a pad parameter of 2.0. This automatically adjusts the padding around the subplots to ensure that there’s no overlap and that all elements are visible. The pad parameter controls the padding around the figure edge.
Controlling Padding in Grid-based Subplots
When working with grid-based subplots, you might want to have more control over the padding between rows and columns. The gridspec module in Matplotlib provides this functionality. Let’s see how to use gridspec to adjust padding in a grid of subplots:
import matplotlib.pyplot as plt
import matplotlib.gridspec as gridspec
import numpy as np

fig = plt.figure(figsize=(12, 8))
gs = gridspec.GridSpec(2, 2, width_ratios=[1, 1], height_ratios=[1, 1])
gs.update(wspace=0.3, hspace=0.4)

ax1 = plt.subplot(gs[0, 0])
ax2 = plt.subplot(gs[0, 1])
ax3 = plt.subplot(gs[1, 0])
ax4 = plt.subplot(gs[1, 1])

x = np.linspace(0, 10, 100)
ax1.plot(x, np.sin(x), label='Sine')
ax1.set_title('Sine Wave - how2matplotlib.com')
ax1.legend()

ax2.plot(x, np.cos(x), label='Cosine')
ax2.set_title('Cosine Wave - how2matplotlib.com')
ax2.legend()

ax3.plot(x, np.tan(x), label='Tangent')
ax3.set_title('Tangent Wave - how2matplotlib.com')
ax3.legend()

ax4.plot(x, np.exp(x), label='Exponential')
ax4.set_title('Exponential Function - how2matplotlib.com')
ax4.legend()

plt.show()
Output:
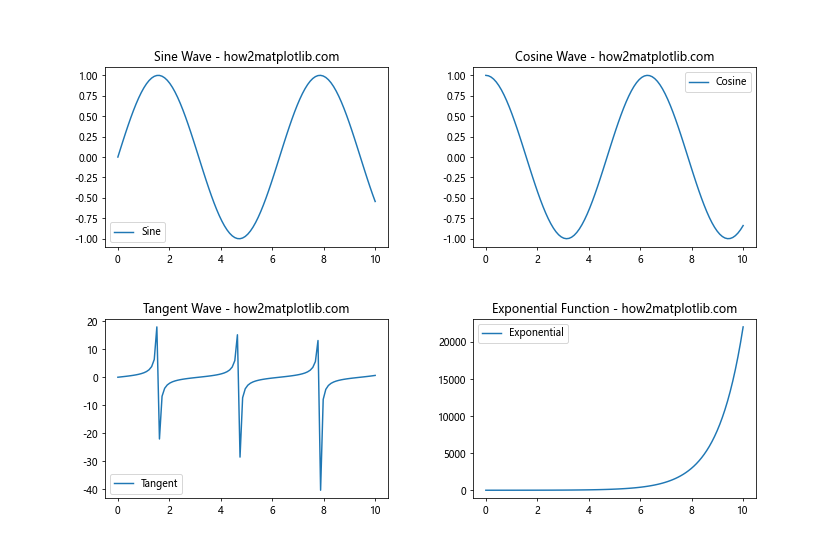
In this example, we use gridspec to create a 2×2 grid of subplots. The gs.update() method allows us to set the wspace and hspace parameters, which control the width and height of the padding between subplots, respectively.
Adjusting Padding for Specific Subplots
Sometimes, you may want to adjust the padding for specific subplots rather than applying the same padding to all subplots. This can be achieved by using the set_position method of the Axes object. Here’s an example:
import matplotlib.pyplot as plt
import numpy as np

fig, (ax1, ax2) = plt.subplots(1, 2, figsize=(10, 5))

x = np.linspace(0, 10, 100)
ax1.plot(x, np.sin(x), label='Sine')
ax1.set_title('Sine Wave - how2matplotlib.com')
ax1.legend()

ax2.plot(x, np.cos(x), label='Cosine')
ax2.set_title('Cosine Wave - how2matplotlib.com')
ax2.legend()

# Adjust padding for ax1
box = ax1.get_position()
ax1.set_position([box.x0, box.y0, box.width * 0.8, box.height])

# Adjust padding for ax2
box = ax2.get_position()
ax2.set_position([box.x0 + 0.1, box.y0, box.width * 0.8, box.height])

plt.show()
Output:
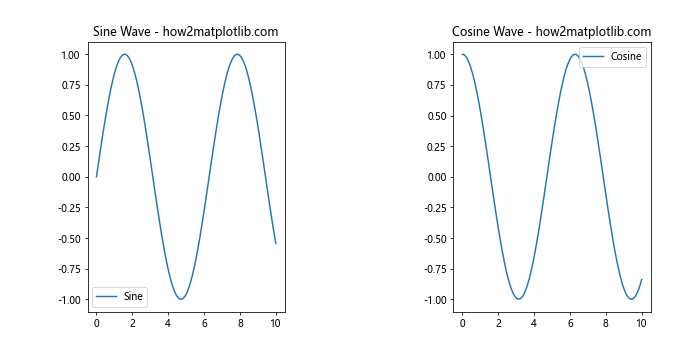
In this example, we use the get_position method to get the current position of each subplot, and then use set_position to adjust the position and size. This allows us to create custom padding for each subplot individually.
Handling Overlapping Labels with plt.subplots Padding
One common issue when working with multiple subplots is overlapping labels, especially when dealing with long titles or axis labels. Proper padding can help alleviate this issue. Let’s look at an example of how to handle overlapping labels:
import matplotlib.pyplot as plt
import numpy as np

fig, (ax1, ax2) = plt.subplots(2, 1, figsize=(10, 8))

x = np.linspace(0, 10, 100)
ax1.plot(x, np.sin(x), label='Sine')
ax1.set_title('Sine Wave with a Very Long Title - how2matplotlib.com')
ax1.set_xlabel('X-axis with a Long Label')
ax1.set_ylabel('Y-axis with a Long Label')
ax1.legend()

ax2.plot(x, np.cos(x), label='Cosine')
ax2.set_title('Cosine Wave with Another Very Long Title - how2matplotlib.com')
ax2.set_xlabel('X-axis with Another Long Label')
ax2.set_ylabel('Y-axis with Another Long Label')
ax2.legend()

plt.tight_layout(pad=3.0, h_pad=2.0, w_pad=2.0)

plt.show()
Output:
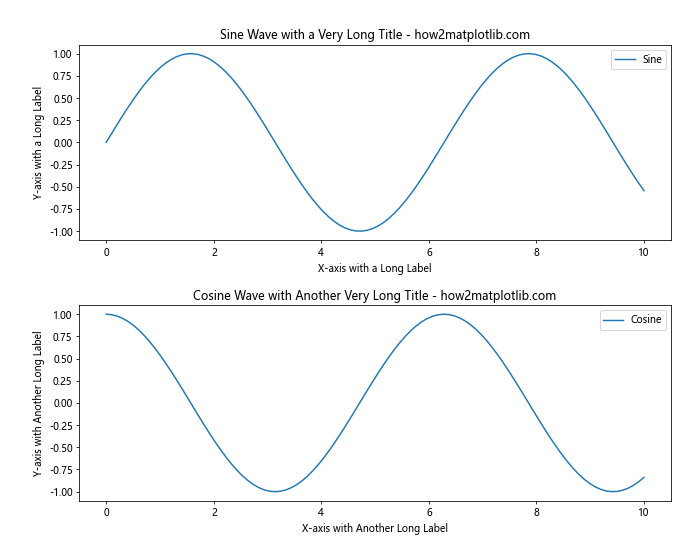
In this example, we use plt.tight_layout with custom pad, h_pad, and w_pad values to ensure that there’s enough space between the subplots and their labels. The pad parameter controls the padding around the entire figure, while h_pad and w_pad control the vertical and horizontal padding between subplots, respectively.
Creating Subplots with Different Sizes and Padding
Sometimes, you may want to create subplots of different sizes within the same figure. This can be achieved using gridspec with custom width and height ratios. Here’s an example of how to create subplots with different sizes and adjust their padding:
import matplotlib.pyplot as plt
import matplotlib.gridspec as gridspec
import numpy as np

fig = plt.figure(figsize=(12, 8))
gs = gridspec.GridSpec(2, 2, width_ratios=[2, 1], height_ratios=[1, 2])
gs.update(wspace=0.4, hspace=0.4)

ax1 = plt.subplot(gs[0, 0])
ax2 = plt.subplot(gs[0, 1])
ax3 = plt.subplot(gs[1, :])

x = np.linspace(0, 10, 100)
ax1.plot(x, np.sin(x), label='Sine')
ax1.set_title('Sine Wave - how2matplotlib.com')
ax1.legend()

ax2.plot(x, np.cos(x), label='Cosine')
ax2.set_title('Cosine Wave - how2matplotlib.com')
ax2.legend()

ax3.plot(x, np.tan(x), label='Tangent')
ax3.set_title('Tangent Wave - how2matplotlib.com')
ax3.legend()

plt.show()
Output:
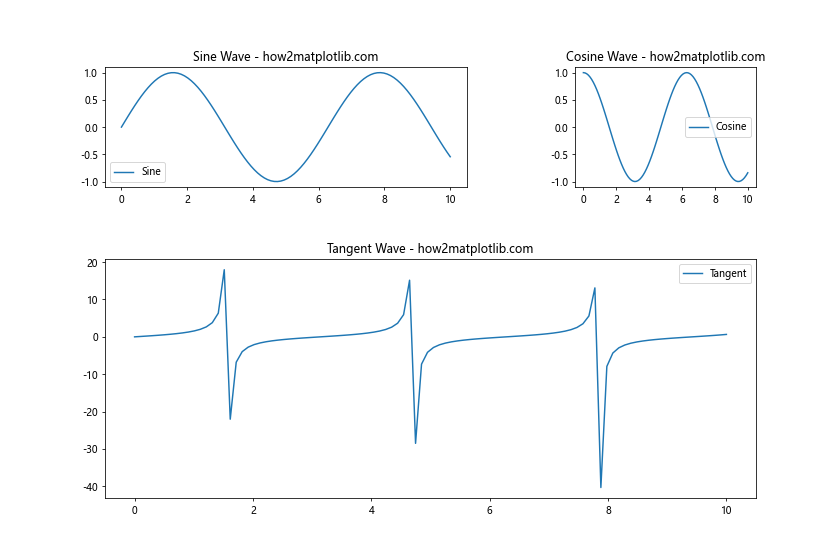
In this example, we create a 2×2 grid with custom width and height ratios. The top-left subplot is twice as wide as the top-right subplot, and the bottom subplot spans the entire width of the figure. We use gs.update to set the wspace and hspace parameters for consistent padding between the subplots.
Adjusting Padding for Colorbar Integration
When working with plots that include colorbars, proper padding becomes even more crucial to ensure that the colorbar doesn’t overlap with the main plot. Here’s an example of how to adjust padding when adding a colorbar to a subplot:
import matplotlib.pyplot as plt
import numpy as np

fig, (ax1, ax2) = plt.subplots(1, 2, figsize=(12, 5))

x = np.linspace(0, 10, 100)
y = np.linspace(0, 10, 100)
X, Y = np.meshgrid(x, y)
Z = np.sin(X) * np.cos(Y)

im1 = ax1.imshow(Z, cmap='viridis', extent=[0, 10, 0, 10])
ax1.set_title('2D Plot with Colorbar - how2matplotlib.com')

ax2.plot(x, np.sin(x), label='Sine')
ax2.set_title('Sine Wave - how2matplotlib.com')
ax2.legend()

# Add colorbar to ax1
cbar = fig.colorbar(im1, ax=ax1, pad=0.1)
cbar.set_label('Value')

plt.tight_layout(pad=2.0, w_pad=3.0)

plt.show()
Output:
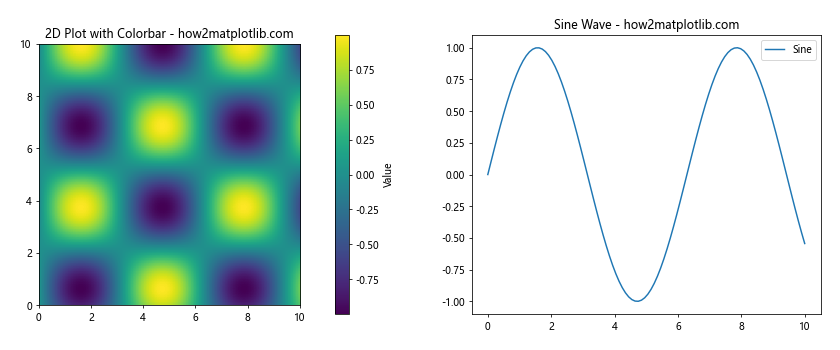
In this example, we create two subplots: one with a 2D image plot and a colorbar, and another with a simple line plot. We use fig.colorbar to add the colorbar to the first subplot, and specify a pad value to control the space between the subplot and the colorbar. Finally, we use plt.tight_layout with custom pad and w_pad values to ensure proper spacing between the subplots and the figure edges.
Handling Padding in Subplots with Shared Axes
When creating subplots with shared axes, proper padding becomes important to maintain readability while avoiding redundant labels. Here’s an example of how to handle padding in subplots with shared axes:
import matplotlib.pyplot as plt
import numpy as np

fig, (ax1, ax2, ax3) = plt.subplots(3, 1, figsize=(10, 12), sharex=True)

x = np.linspace(0, 10, 100)
ax1.plot(x, np.sin(x), label='Sine')
ax1.set_title('Sine Wave - how2matplotlib.com')
ax1.legend()

ax2.plot(x, np.cos(x), label='Cosine')
ax2.set_title('Cosine Wave - how2matplotlib.com')
ax2.legend()

ax3.plot(x, np.tan(x), label='Tangent')
ax3.set_title('Tangent Wave - how2matplotlib.com')
ax3.set_xlabel('X-axis (shared)')
ax3.legend()

plt.tight_layout(pad=2.0, h_pad=3.0)

plt.show()
Output:
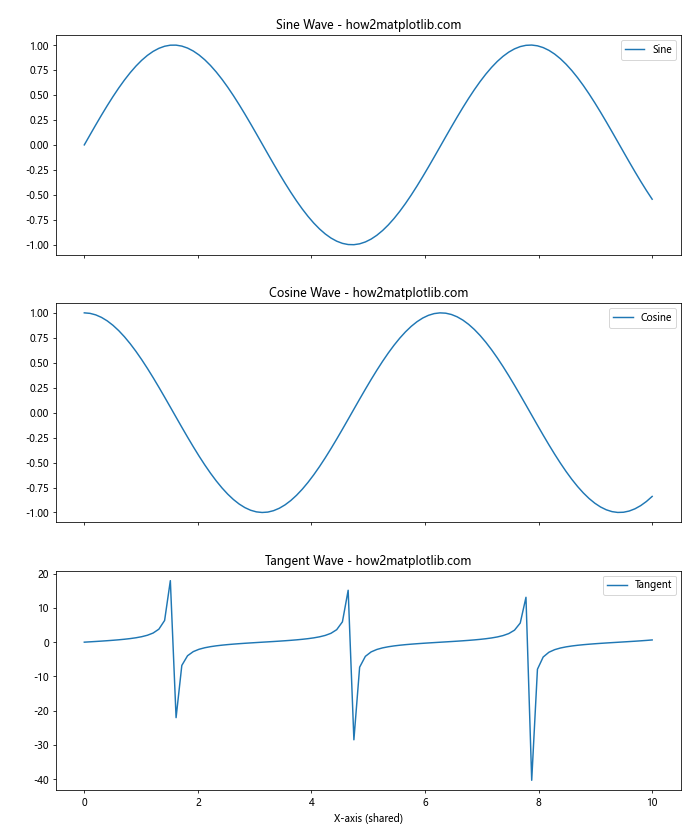
In this example, we create three subplots with a shared x-axis. We use the sharex=True parameter in plt.subplots to create shared x-axes. The plt.tight_layout function is used with custom pad and h_pad values to ensure proper spacing between the subplots while accommodating the shared x-axis label.
Adjusting Padding for Subplots with Different Scales
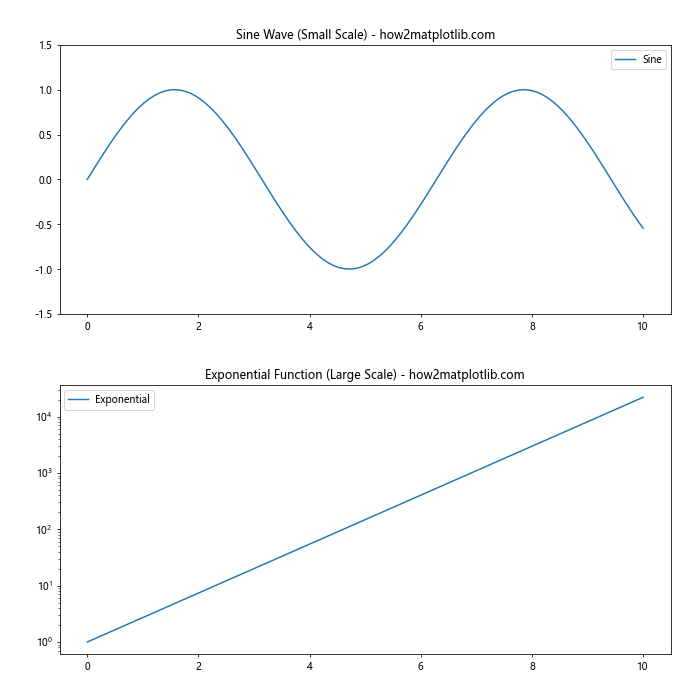
When working with subplots that have significantly different scales, proper padding becomes crucial to maintain readability and prevent overlapping. Here’s an example of how to handle padding in such cases:
import matplotlib.pyplot as plt
import numpy as np

fig, (ax1, ax2) = plt.subplots(2, 1, figsize=(10, 10))

x = np.linspace(0, 10, 100)
ax1.plot(x, np.sin(x), label='Sine')
ax1.set_title('Sine Wave (Small Scale) - how2matplotlib.com')
ax1.set_ylim(-1.5, 1.5)
ax1.legend()

ax2.plot(x, np.exp(x), label='Exponential')
ax2.set_title('Exponential Function (Large Scale) - how2matplotlib.com')
ax2.set_yscale('log')
ax2.legend()

plt.tight_layout(pad=3.0, h_pad=4.0)

plt.show()
In this example, we create two subplots with significantly different scales: a sine wave with a small scale and an exponential function with a large scale. We use plt.tight_layout with custom pad and h_pad values to ensure proper spacing between the subplots, accommodating the different scales and preventing label overlap.
Output:
Using plt.subplots Padding with Annotations
When adding annotations to your subplots, proper padding becomes essential to ensure that the annotations don’t overlap with other plot elements. Here’s an example of how to handle padding when adding annotations:
import matplotlib.pyplot as plt
import numpy as np

fig, (ax1, ax2) = plt.subplots(1, 2, figsize=(12, 5))

x = np.linspace(0, 10, 100)
ax1.plot(x, np.sin(x), label='Sine')
ax1.set_title('Sine Wave with Annotation - how2matplotlib.com')
ax1.legend()
ax1.annotate('Peak', xy=(np.pi/2, 1), xytext=(np.pi/2 + 1, 1.2),
             arrowprops=dict(facecolor='black', shrink=0.05))

ax2.plot(x, np.cos(x), label='Cosine')
ax2.set_title('Cosine Wave with Annotation - how2matplotlib.com')
ax2.legend()
ax2.annotate('Trough', xy=(np.pi, -1), xytext=(np.pi + 1, -1.2),
             arrowprops=dict(facecolor='black', shrink=0.05))

plt.tight_layout(pad=2.0, w_pad=3.0)

plt.show()
Output:
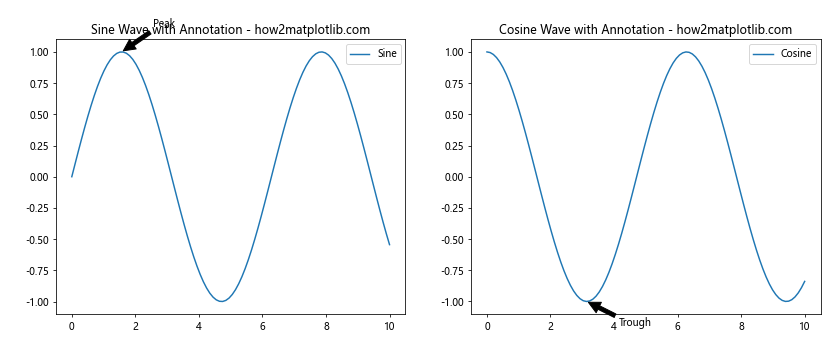
In this example, we create two subplots and add annotations to each. We use plt.tight_layout with custom pad and w_pad values to ensure that there’s enough space for the annotations without overlapping with other plot elements or the figure edges.
Handling Padding in Subplots with Multiple Y-axes
When working with subplots that have multiple y-axes, proper padding is crucial to prevent overlapping and ensure readability. Here’s an example of how to handle padding in such cases:
import matplotlib.pyplot as plt
import numpy as np

fig, (ax1, ax2) = plt.subplots(1, 2, figsize=(12, 5))

x = np.linspace(0, 10, 100)
ax1.plot(x, np.sin(x), 'b-', label='Sine')
ax1.set_ylabel('Sine', color='b')
ax1.tick_params(axis='y', labelcolor='b')

ax1_twin = ax1.twinx()
ax1_twin.plot(x, np.exp(x), 'r-', label='Exponential')
ax1_twin.set_ylabel('Exponential', color='r')
ax1_twin.tick_params(axis='y', labelcolor='r')

ax1.set_title('Sine and Exponential - how2matplotlib.com')

ax2.plot(x, np.cos(x), 'g-', label='Cosine')
ax2.set_ylabel('Cosine', color='g')
ax2.tick_params(axis='y', labelcolor='g')

ax2_twin = ax2.twinx()
ax2_twin.plot(x, x**2, 'm-', label='Quadratic')
ax2_twin.set_ylabel('Quadratic', color='m')
ax2_twin.tick_params(axis='y', labelcolor='m')

ax2.set_title('Cosine and Quadratic - how2matplotlib.com')

plt.tight_layout(pad=2.0, w_pad=4.0)

plt.show()
Output:
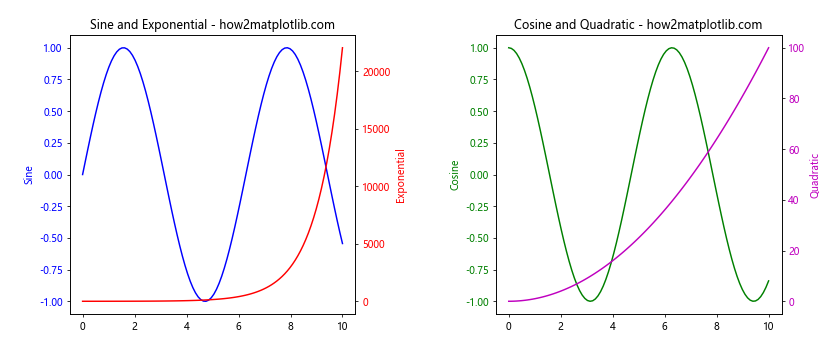
In this example, we create two subplots, each with two y-axes. We use the twinx() method to create the secondary y-axes. The plt.tight_layout function is used with custom pad and w_pad values to ensure proper spacing between the subplots and accommodate the multiple y-axes labels.
Adjusting Padding for Subplots with Inset Axes
When adding inset axes to your subplots, proper padding becomes important to ensure that the inset axes don’t overlap with the main plot or other elements. Here’s an example of how to handle padding with inset axes:
import matplotlib.pyplot as plt
import numpy as np
from mpl_toolkits.axes_grid1.inset_locator import inset_axes

fig, (ax1, ax2) = plt.subplots(1, 2, figsize=(12, 5))

x = np.linspace(0, 10, 100)
ax1.plot(x, np.sin(x), label='Sine')
ax1.set_title('Sine Wave with Inset - how2matplotlib.com')
ax1.legend()

# Add inset axes to ax1
axins1 = inset_axes(ax1, width="40%", height="30%", loc=1)
axins1.plot(x, np.sin(x))
axins1.set_xlim(2, 4)
axins1.set_ylim(0.5, 1)
axins1.set_xticklabels([])
axins1.set_yticklabels([])

ax2.plot(x, np.cos(x), label='Cosine')
ax2.set_title('Cosine Wave with Inset - how2matplotlib.com')
ax2.legend()

# Add inset axes to ax2
axins2 = inset_axes(ax2, width="40%", height="30%", loc=4)
axins2.plot(x, np.cos(x))
axins2.set_xlim(6, 8)
axins2.set_ylim(-1, -0.5)
axins2.set_xticklabels([])
axins2.set_yticklabels([])

plt.tight_layout(pad=2.0, w_pad=3.0)

plt.show()
Output:
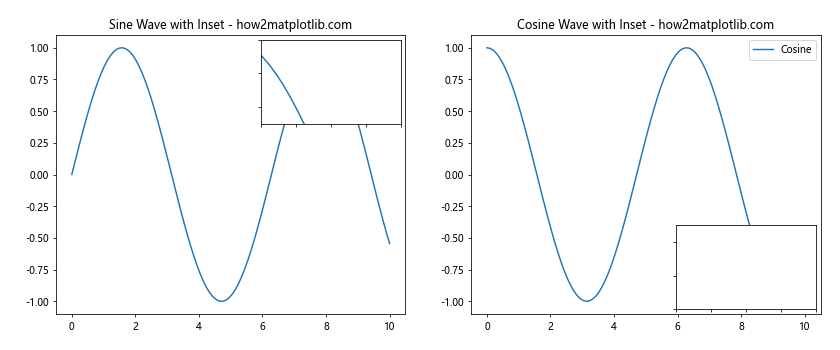
In this example, we create two subplots and add inset axes to each using the inset_axes function from mpl_toolkits.axes_grid1.inset_locator. We use plt.tight_layout with custom pad and w_pad values to ensure proper spacing between the subplots and accommodate the inset axes.
Handling Padding in Subplots with Different Aspect Ratios
When working with subplots that have different aspect ratios, proper padding becomes crucial to maintain a balanced layout. Here’s an example of how to handle padding in such cases:
import matplotlib.pyplot as plt
import numpy as np

fig = plt.figure(figsize=(12, 8))

# Subplot with aspect ratio 1:1
ax1 = fig.add_subplot(121, aspect='equal')
theta = np.linspace(0, 2*np.pi, 100)
ax1.plot(np.cos(theta), np.sin(theta))
ax1.set_title('Circle (1:1 Aspect Ratio) - how2matplotlib.com')

# Subplot with aspect ratio 2:1
ax2 = fig.add_subplot(122, aspect=2)
x = np.linspace(0, 10, 100)
ax2.plot(x, np.sin(x))
ax2.set_title('Sine Wave (2:1 Aspect Ratio) - how2matplotlib.com')

plt.tight_layout(pad=2.0, w_pad=3.0)

plt.show()
Output:
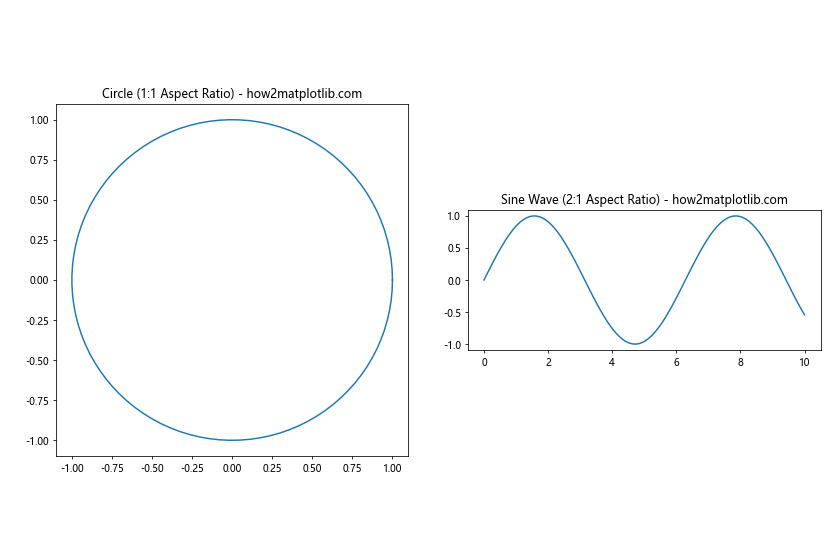
In this example, we create two subplots with different aspect ratios: one with a 1:1 aspect ratio (a circle) and another with a 2:1 aspect ratio (a sine wave). We use plt.tight_layout with custom pad and w_pad values to ensure proper spacing between the subplots while accommodating their different aspect ratios.
plt.subplots padding Conclusion
Mastering plt.subplots padding is essential for creating professional-looking and easily readable visualizations in Matplotlib. Throughout this article, we’ve explored various techniques and best practices for adjusting padding in different scenarios, including:
- Using plt.subplots_adjust for fine-grained control
- Leveraging tight_layout for automatic padding adjustment
- Controlling padding in grid-based subplots with gridspec
- Adjusting padding for specific subplots
- Handling overlapping labels
- Creating subplots with different sizes and padding
- Adjusting padding for colorbar integration
- Handling padding in subplots with shared axes
- Adjusting padding for subplots with different scales
- Using padding with annotations
- Handling padding in subplots with multiple y-axes
- Adjusting padding for subplots with inset axes
- Handling padding in subplots with different aspect ratios
By applying these techniques and understanding the importance of proper padding, you can significantly improve the quality and readability of your Matplotlib visualizations. Remember that the key to effective padding is finding the right balance between aesthetics and information density. Experiment with different padding settings and always consider the specific requirements of your data and target audience when creating your plots.